. 2025 Jan 2;23(1):1.
doi: 10.1186/s12964-024-01996-x.

Role of the Notch signaling pathway in porcine oocyte maturation

Affiliations

Role of the Notch signaling pathway in porcine oocyte maturation

Pil-Soo Jeong et al. Cell Commun Signal. .

Abstract

Background: Although the Notch signaling pathway is known to play an important role in ovarian follicle development in mammals, whether it is involved in oocyte maturation remains unclear. Therefore, this study was performed to elucidate the existence and role of the Notch signaling pathway during oocyte maturation in a porcine model.

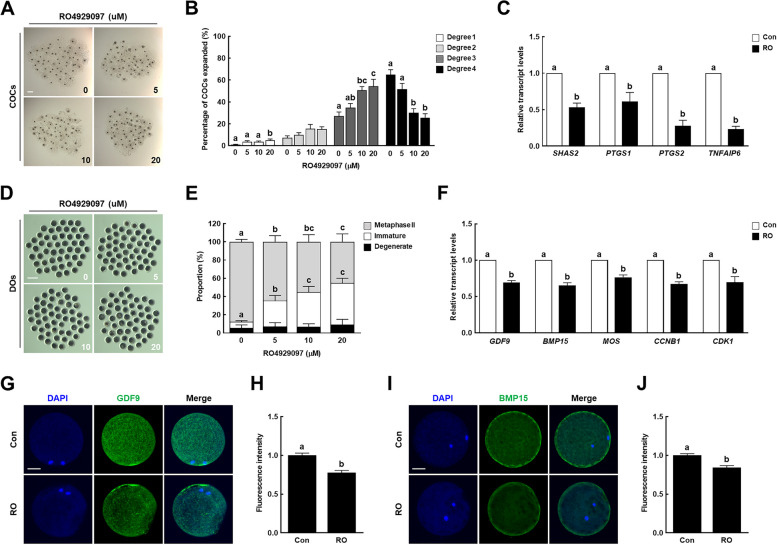
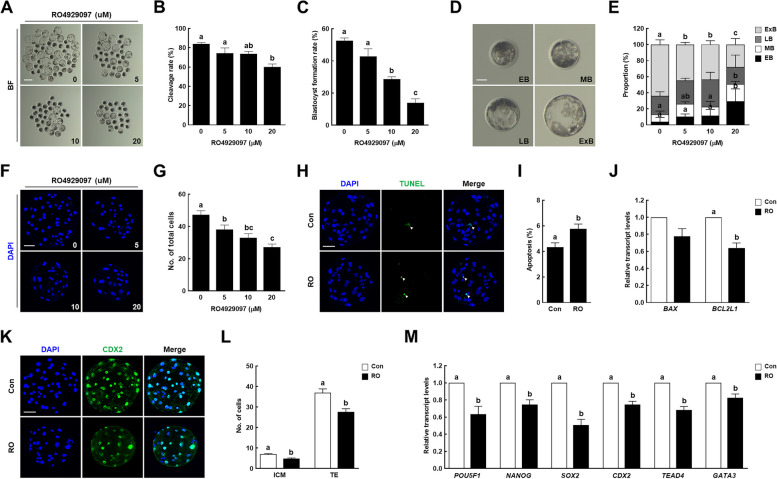
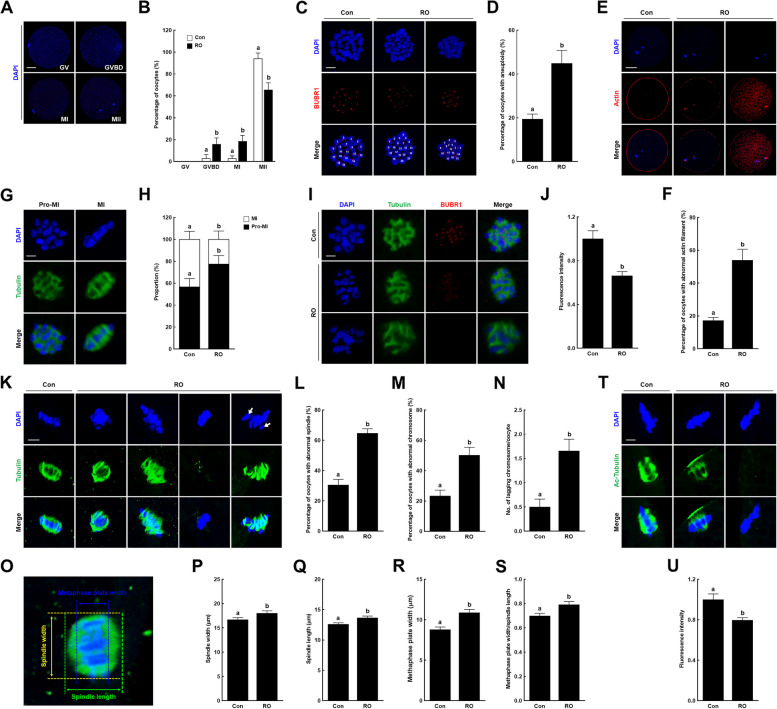
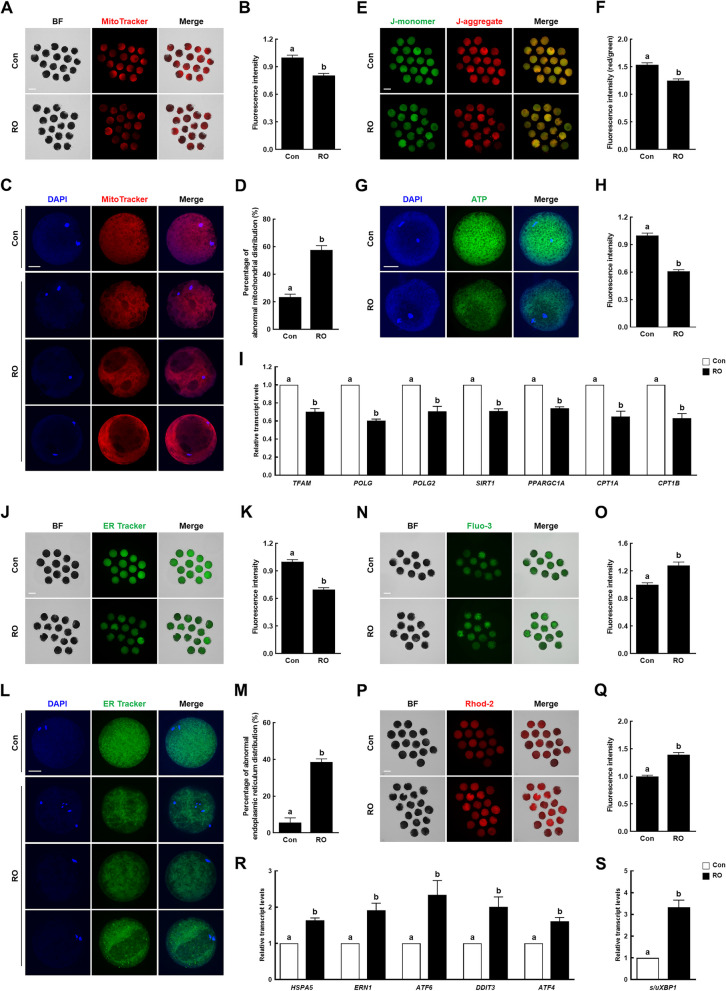
Methods: Reverse transcription-polymerase chain reaction (RT-PCR) and immunocytochemical assays were used to determine the existence of Notch signaling pathway-related transcripts and proteins in porcine cumulus-oocyte complexes (COCs). In vitro maturation (IVM) and parthenogenetic activation of oocytes were employed to examine the effects of Notch signaling inhibition on meiotic progression and embryogenesis of COCs using RO4929097 (RO), an inhibitor of γ secretase. Various staining methods (TUNEL, Phalloidin-TRITC, MitoTracker, JC-1, BODIPY FL ATP, ER-Tracker, Fluo-3, and Rhod-2) and immunocytochemical and quantitative PCR assays were used to identify the effects of Notch signaling inhibition on meiotic progression, embryogenesis, cell cycle progression, spindle assembly, chromosome alignment, mitochondrial and endoplasmic reticulum distribution, and downstream pathway targets in COCs.

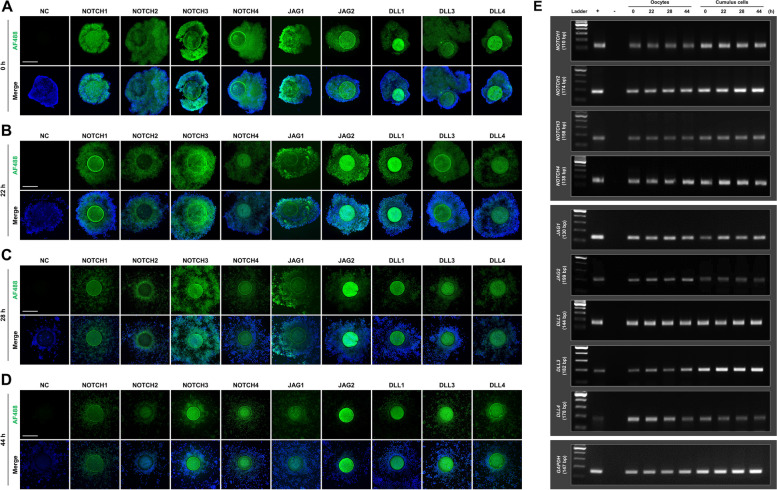
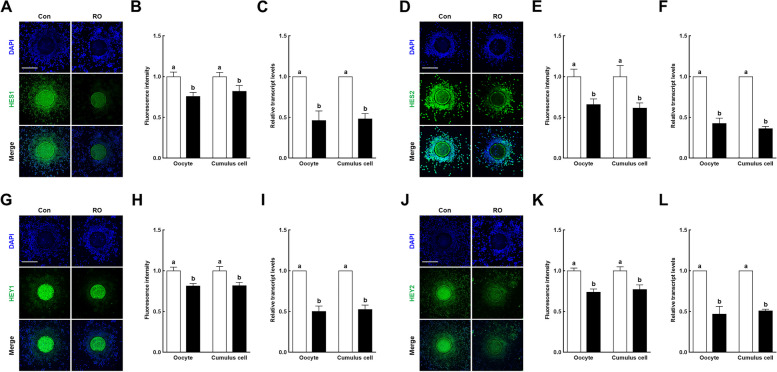
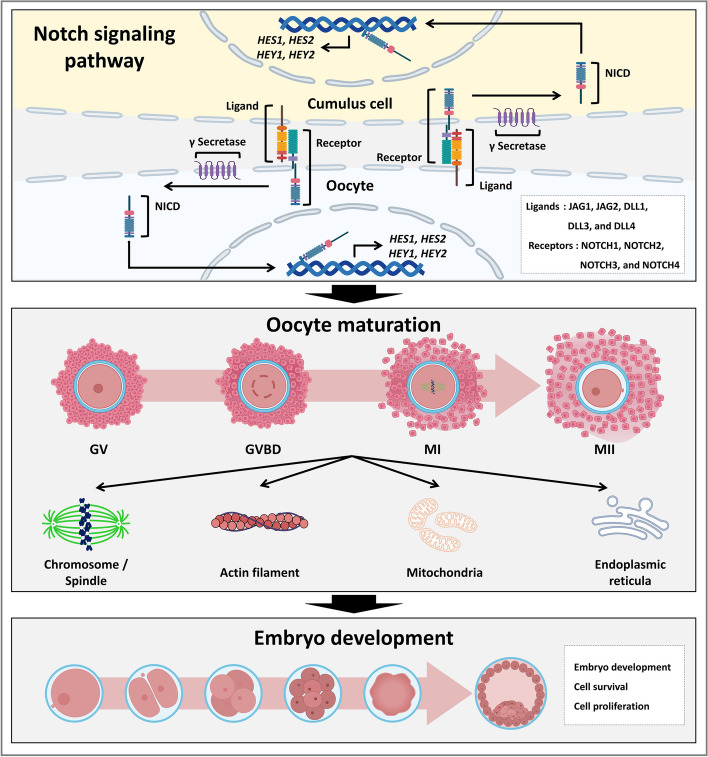
Results: The RT-PCR and immunocytochemical analyses revealed the presence of Notch signaling-related receptors (NOTCH1-4) and ligands (JAG1 and 2 and DLL1, 3, and 4) at 0, 22, 28, and 44 h of IVM in the COCs. RO treatment during oocyte maturation markedly reduced meiotic maturation and embryogenesis, inhibiting the cell cycle progression, spindle assembly, and chromosome alignment processes that are important for meiotic maturation. Furthermore, RO significantly impaired the cellular distribution and functions of the mitochondria and endoplasmic reticula, which are important organelles for the cytoplasmic maturation of oocytes. Finally, the involvement of canonical Notch signaling in oocyte maturation was confirmed by the decreased expression of HES and HEY family transcripts and proteins in the RO-treated COCs.

Conclusions: It was first demonstrated that Notch signaling pathway-related transcripts and proteins were expressed during the meiotic maturation of porcine COCs. Furthermore, the inhibition of Notch signaling during IVM revealed the essential role of this signaling pathway during oocyte maturation in pigs.

Keywords: Embryo development; Microtubule function; Notch signaling pathway; Oocyte maturation; Organelle function; Pig; γ secretase inhibitor.


Conflict of interest statement

Declarations. Ethics approval and consent to participate: Animal experiments were approved and reviewed by the Korea Research Institute of Bioscience and Biotechnology (KRIBB) Institutional Animal Care and Use Committee (approval no. KRIBB-AEC-21107, date 03.24.2021) and all studies were conducted in accordance with the Basel Declaration. Consent for publication: We also confirm that all the listed authors have participated actively in the study, and have seen and approved the submitted manuscript. Competing interests: The authors declare no competing interests.

Figures

Fig. 1
Fig. 1
Subcellular localization and expression of the Notch signaling pathway during porcine oocyte meiotic progression. Immunofluorescence analyses of Notch signaling receptors (NOTCH1, NOTCH2, NOTCH3, and NOTCH4) and ligands (JAG1, JAG2, DLL1, DLL3, and DLL4) in porcine cumulus–oocyte complexes (COCs) at (A) 0, (B) 22, (C) 28, and (D) 44 h of in vitro maturation (IVM). Bar = 200 µm. E RT-PCR analyses of Notch signaling receptors (NOTCH1, NOTCH2, NOTCH3, and NOTCH4) and ligands (JAG1, JAG2, DLL1, DLL3, and DLL4) in oocytes and cumulus cells at 0, 22, 28, and 44 h of IVM. Each RT-PCR experiment was performed using oocytes and cumulus cells isolated from 50 COCs
Fig. 2
Fig. 2
Effect of Notch signaling inhibition on porcine oocyte meiotic progression. A Representative images and (B) proportions of cumulus cell expansion in the control and RO4929097-treated groups after 44 h of in vitro maturation (IVM) (n = 250 per group). Bar = 200 µm. C qRT-PCR-assayed transcript levels of cumulus expansion-related genes (SHAS2, PTGS1, PTGS2, and TNFAIP6) in cumulus cells after 44 h of IVM in the indicated groups (n = 3 per group). D Representative images and (E) proportions of different stages of denuded oocytes in the control and RO4929097-treated groups after 44 h of IVM (n = 250 per group). Bar = 200 µm. F qRT-PCR-assayed transcript levels of genes related to oocyte competence (GDF9 and BMP15), mitogen-activated protein kinase (MOS), and maturation promoting factor (CCNB1 and CDK1) in oocytes after 44 h of IVM in the indicated groups (n = 3 per group). G Representative images and (H) fluorescence intensity of GDF9 immunocytochemical staining in oocytes in the indicated groups (n = 20 per group). Bar = 50 µm. I Representative images and (J) fluorescence intensity of BMP15 immunocytochemical staining in oocytes in the indicated groups (n = 20 per group). Bar = 50 µm. Data are derived from at least three independent experiments, and different superscripts indicate significant differences (P < 0.05). Con, control; RO, 10 µM RO4929097
Fig. 3
Fig. 3
Effect of Notch signaling inhibition during IVM on early porcine embryogenesis. A Representative images of blastocysts developed from control and RO4929097-treated groups after parthenogenetic activation. Bar = 200 µm. B Cleavage and (C) blastocyst formation rates of embryos from control and RO4929097-treated groups after parthenogenetic activation (0: n = 219; 5: n = 161; 10: n = 138; 20: n = 113). D Representative images of blastocysts at four different stages: early blastocyst (EB), middle blastocyst (MB), large blastocyst (LB), and expanded blastocyst (ExB). Bar = 50 µm. E Proportions of various blastocyst stages in the control and RO4929097-treated groups (0: n = 133; 5: n = 87; 10: n = 51; 20: n = 40). F Representative nuclear-stained images of blastocysts in the control and RO4929097-treated groups. Bar = 50 µm. G Quantification of total cell numbers in the control and RO4929097-treated groups (n = 20 per group). H Representative images of TdT-mediated dUTP nick-end labeling (TUNEL)-stained blastocysts. Bar = 50 µm. Embryos were subjected to TUNEL (green, white arrow) and nuclear staining (blue). I Quantification of the proportion of apoptotic cells in the indicated groups (n = 40 per group). J qRT-PCR-assayed transcript levels of apoptosis-related genes (BAX and BCL2L1) in blastocysts in the indicated groups (n = 3 per group). K Representative images of CDX2 staining in blastocysts. Bar = 50 µm. L Quantification of cell numbers in the inner cell mass and trophectoderm in the indicated groups (n = 33 per group). M qRT-PCR-assayed transcript levels of developmental potential-related genes (POU5F1, NANOG, SOX2, CDX2, TEAD4, and GATA3) in blastocysts in the indicated groups (n = 3 per group). Data are derived from at least three independent experiments, and different superscripts indicate significant differences (P < 0.05). Con, control; RO, 10 µM RO4929097
Fig. 4
Fig. 4
Effects of Notch signaling inhibition on cell cycle progression, spindle assembly, and chromosome alignment in porcine oocytes. A Representative images of oocytes at four various stages: germinal vesicle (GV), germinal vesicle breakdown (GVBD), metaphase I (MI), and metaphase II (MII). Bar = 50 µm. B Proportions of oocyte stages at 44 h of in vitro maturation (IVM) in the indicated groups (con: n = 238; RO: n = 226). C Representative images of chromosome spreading in MII oocytes in the indicated groups. Bar = 5 µm. D Proportions of MII oocytes with aneuploidy in the indicated groups (con: n = 135; RO: n = 91). E Representative images of MII oocytes stained for actin filaments in the indicated groups. Bar = 50 µm. F Proportions of MII oocytes with abnormal actin filaments in the indicated groups (con: n = 145; RO: n = 134). G Representative images of Pro-MI and MI stage oocytes. Bar = 5 µm. H Proportions of Pro-MI and MI stage oocytes at 28 h of IVM in the indicated groups (con: n = 175; RO: n = 173). I Representative images and (J) fluorescence intensity of BUBR1 staining in Pro-MI stage oocytes in the indicated groups (n = 48 per group). Bar = 5 µm. K Representative images of the spindle and chromosome structures in the indicated groups. Bar = 5 µm. White arrows indicate lagging chromosomes. Proportions of oocytes with abnormal (L) spindle and (M) chromosome morphology in the indicated groups (con: n = 65; RO: n = 79). N Quantification of lagging chromosomes per oocyte in the indicated groups (n = 50 per group). O Representative images of spindles and chromosomes indicating the spindle width and length and metaphase plate width. Bar = 5 µm. Quantification of the (P) spindle width, (Q) spindle length, (R) metaphase plate width, and (S) ratio of the metaphase plate width to spindle length in the indicated groups (n = 50 per group). T Representative images and (U) fluorescence intensity of acetylated tubulin staining in oocytes in the indicated groups (n = 35 per group). Bar = 5 µm. Data are derived from at least three independent experiments, and different superscripts indicate significant differences (P < 0.05). Con, control; RO, 10 µM RO4929097
Fig. 5
Fig. 5
Effects of Notch signaling inhibition on the distribution and functions of the mitochondria and endoplasmic reticula in porcine oocytes. A Representative images and (B) fluorescence intensity of MitoTracker-stained oocytes in the indicated groups (n = 78 per group). Bar = 100 µm. C Representative images of mitochondrial distribution in oocytes and (D) the proportions of oocytes with abnormal mitochondrial distribution in the indicated groups (n = 3 per group). Bar = 50 µm. E Representative images and (F) fluorescence intensity (red/green) of JC-1-stained oocytes in the indicated groups (n = 48 per group). Bar = 100 µm. G Representative images and (H) fluorescence intensity of BODYPY-ATP-stained oocytes in the indicated groups (n = 40 per group). Bar = 50 µm. I qRT-PCR-assayed transcript levels of mitochondria-related genes (TFAM, POLG, POLG2, SIRT1, PPARGC1A, CPT1A, and CPT1B) in the indicated groups (n = 3 per group). J Representative images and (K) fluorescence intensity of ER-Tracker-stained oocytes in the indicated groups (n = 118 per group). Bar = 100 µm. L Representative images of endoplasmic reticulum (ER) distribution in oocytes and (M) the proportions of oocytes with abnormal ER distribution in the indicated groups (n = 3 per group). Bar = 50 µm. N Representative images and (O) fluorescence intensity of Fluo-3-stained oocytes in the indicated groups (n = 50 per group). Bar = 100 µm. P Representative images and (Q) fluorescence intensity of Rhod-2-stained oocytes in the indicated groups (n = 80 per group). Bar = 100 µm. R qRT-PCR-assayed transcript levels of ER stress-related genes (HSPA5, ERN1, ATF6, DDIT3, and ATF4) in the indicated groups (n = 3 per group). S Ratios of qRT-PCR-assayed transcript levels of spliced/unspliced XBP1 genes in the indicated groups (n = 3 per group). Data are derived from at least three independent experiments, and different superscripts indicate significant differences (P < 0.05). Con, control; RO, 10 µM RO4929097
Fig. 6
Fig. 6
Effects of Notch signaling inhibition on downstream targets in porcine cumulus–oocyte complexes. A Representative images and (B) fluorescence intensity of HES1 immunocytochemical staining in cumulus–oocyte complexes (COCs) in the indicated groups (n = 30 per group). Bar = 200 µm. C qRT-PCR-assayed transcript levels of the HES1 gene in the indicated groups (n = 3 per group). D Representative images and (E) fluorescence intensity of HES2 immunocytochemical staining in COCs in the indicated groups (n = 21 per group). Bar = 200 µm. F qRT-PCR-assayed transcript levels of the HES2 gene in the indicated groups (n = 3 per group). G Representative images and (H) fluorescence intensity of HEY1 immunocytochemical staining in COCs in the indicated groups (n = 27 per group). Bar = 200 µm. I qRT-PCR-assayed transcript levels of the HEY1 gene in the indicated groups (n = 3 per group). J Representative images and (K) fluorescence intensity of HEY2 immunocytochemical staining in COCs in the indicated groups (n = 30 per group). Bar = 200 µm. L qRT-PCR-assayed transcript levels of the HEY2 gene in the indicated groups (n = 3 per group). Data are derived from at least three independent experiments, and different superscripts indicate significant differences (P < 0.05). Con, control; RO, 10 µM RO4929097
Fig. 7
Fig. 7
Graphical overview of the canonical role and potential regulatory mechanisms of the Notch signaling pathway on porcine oocyte maturation. Notch signaling-related transcripts and proteins were continuously detected in oocytes and cumulus cells during meiotic maturation. Notably, the Notch signaling regulates microtubule function, including spindle organization and chromosome segregation, and supports proper cytoplasmic maturation by maintaining homeostasis of the mitochondrial and ER systems in porcine oocytes. These findings provide novel insights into the canonical role and potential regulatory mechanisms of the Notch signaling pathway in porcine oocyte maturation

References

    1. Rimon-Dahari N, Yerushalmi-Heinemann L, Alyagor L, Dekel N. Ovarian Folliculogenesis. Results Probl Cell Differ. 2016;58:167–90. - PubMed
    1. Richards JS, Pangas SA. The ovary: basic biology and clinical implications. J Clin Invest. 2010;120(4):963–72. - PMC - PubMed
    1. Li L, Shi X, Shi Y, Wang Z. The Signaling pathways involved in ovarian follicle development. Front Physiol. 2021;12:730196. - PMC - PubMed
    1. Eppig JJ. Reproduction: Oocytes call, granulosa cells connect. Curr Biol. 2018;28(8):R354–6. - PubMed
    1. Perrimon N, Pitsouli C, Shilo BZ. Signaling mechanisms controlling cell fate and embryonic patterning. Cold Spring Harb Perspect Biol. 2012;4(8):a005975. - PMC - PubMed

Substances

LinkOut - more resources