

Estimating relative risks and risk differences in randomised controlled trials: a systematic review of current practice
- PMID: 39748241
- PMCID: PMC11694472
- DOI: 10.1186/s13063-024-08690-w
Estimating relative risks and risk differences in randomised controlled trials: a systematic review of current practice
Abstract
Background: Guidelines for randomised controlled trials (RCTs) recommend reporting relative and absolute measures of effect for binary outcomes while adjusting for covariates. There are a number of different ways covariate-adjusted relative risks and risk differences can be estimated.
Objectives: Our goal was to identify methods used to estimate covariate-adjusted relative risk and risk differences in RCTs published in high-impact journals with binary outcomes. Other secondary objectives included the identification of how covariates are chosen for adjustment and whether covariate adjustment results in an increase in statistical precision in practice.
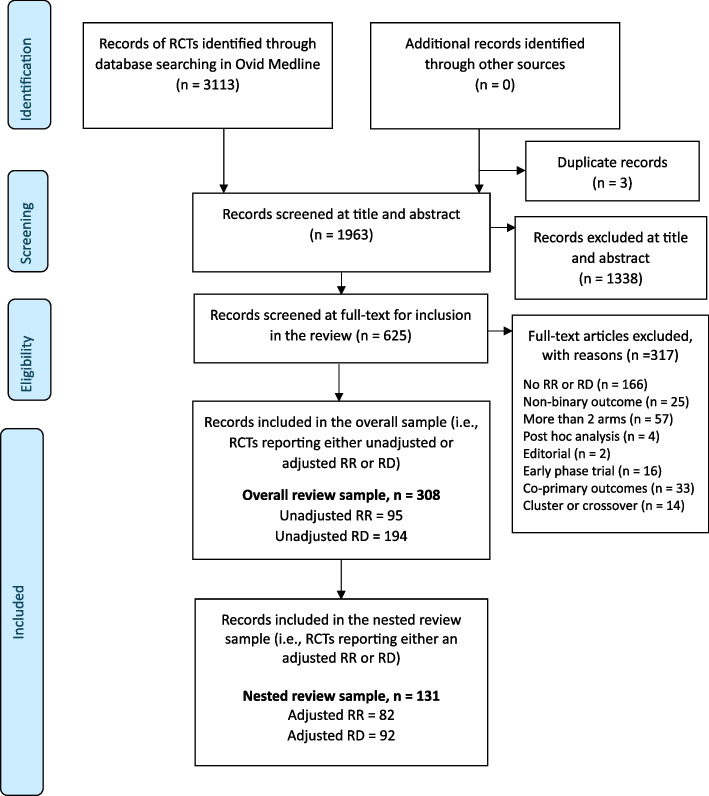
Methods: We included two-arm parallel RCTs published in JAMA, NEJM, Lancet, or the BMJ between January 1, 2018, and March 11, 2023, reporting relative risks or risk differences as a summary measure for a binary primary outcome. The search was conducted in Ovid-MEDLINE.
Results: Of the 308 RCTs identified, around half (49%; 95% CI: 43-54%) reported a covariate-adjusted relative risk or risk difference. Of these, 82 reported an adjusted relative risk. When the reporting was clear (n = 65, 79%), the log-binomial model (used in 65% of studies; 95% CI: 52-76%) and modified Poisson (29%; 95% CI: 19-42%) were most commonly used. Of the 92 studies that reported an adjusted risk difference, when the reporting was clear (n = 56, 61%), the binomial model (used in 48% of studies; 95% CI: 35-62%) and marginal standardisation (21%; 95% CI: 12-35%) were the common approaches used.
Conclusions: Approximately half of the RCTs report either a covariate-adjusted relative risk or risk difference. Many RCTs lack adequate details on the methods used to estimate covariate-adjusted effects. Of those that do report the approaches used, the binomial model, modified Poisson and to a lesser extent marginal standardisation are the approaches used.
Keywords: Binary outcomes; Covariate adjustment; Relative risk; Risk difference; Statistical efficiency; Statistical practice.
© 2024. Crown.
Conflict of interest statement
Declarations. Ethics approval and consent to participate: This research relied solely on published articles and therefore did not require ethical approval. Consent for publication: The views expressed are those of the author(s) and not necessarily those of the funders. Competing interests: The authors declare that they have no competing interests.
Figures

References
-
- Office of the Federal Register NAaRA. Adjusting for Covariates in Randomized Clinical Trials for Drugs and Biological Products; Draft Guidance for Industry; Availability. [Government]. In: 27627 F, editor. USA: Office of the Federal Register, National Archives and Records Administration 2021. p. 27627–9.
-
- EMA. Guideline on adjustment for baseline covariates in clinical trials In: (CHMP) CfMPfHU, editor. London: EMA; 2015. p. 1–11.
Publication types
MeSH terms
Grants and funding
LinkOut - more resources
Full Text Sources
