

Serum levels of oxidative stress, IL-8, and pepsinogen I/II ratio in Helicobacter pylori and gastric cancer patients: potential diagnostic biomarkers
- PMID: 39748276
- PMCID: PMC11697901
- DOI: 10.1186/s12876-024-03564-6
Serum levels of oxidative stress, IL-8, and pepsinogen I/II ratio in Helicobacter pylori and gastric cancer patients: potential diagnostic biomarkers
Abstract
Background and aim: Helicobacter pylori (H.pylori), a gram-negative bacterial pathogen associated with an increased risk of gastric cancer. This study investigates potential factors in the incidence of gastric cancer in patients with H.pylori, including oxidative stress, inflammatory biomarkers, serum pepsinogens (PG) of I and II, and PG-I/PG-II ratio.
Methods: The study comprised individuals with Helicobacter pylori (H.pylori) infection, gastric cancer patients, and healthy individuals. Biochemical parameters such as FBS (fasting blood sugar), lipid profile, and liver and kidney functional factors were evaluated using colorimetric techniques. Oxidative markers such as total oxidant status (TOS) and malondialdehyde (MDA) were quantified through colorimetric methods. IL-8, PG-II, and PG-II levels were also determined using the ELISA technique.
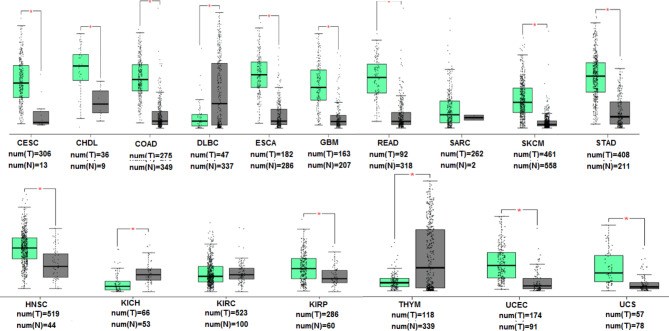
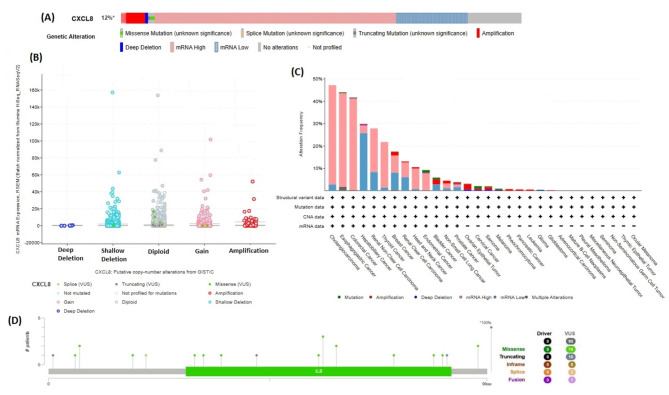
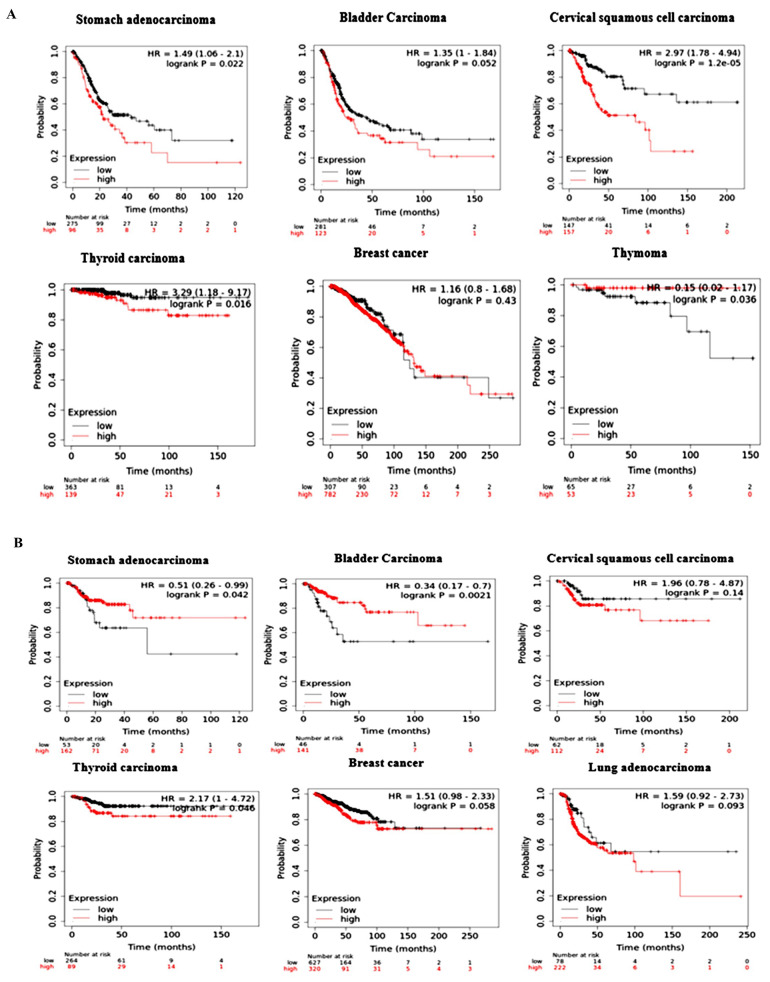
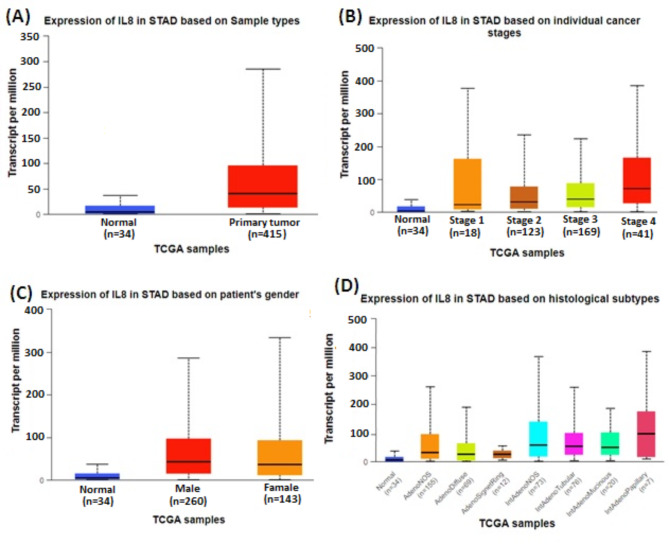
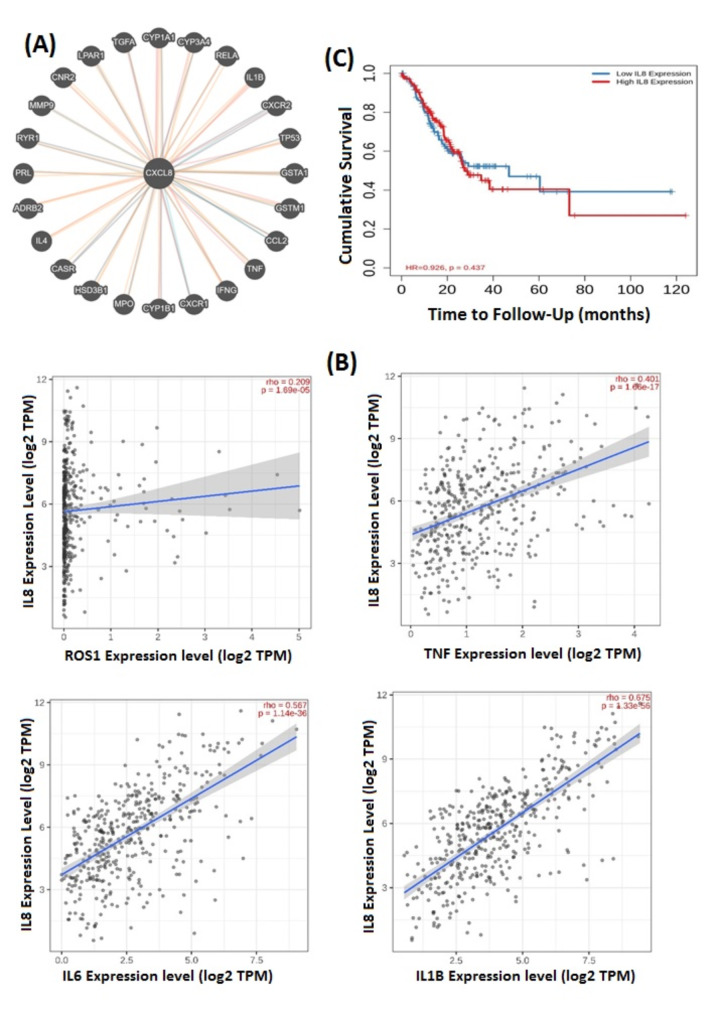
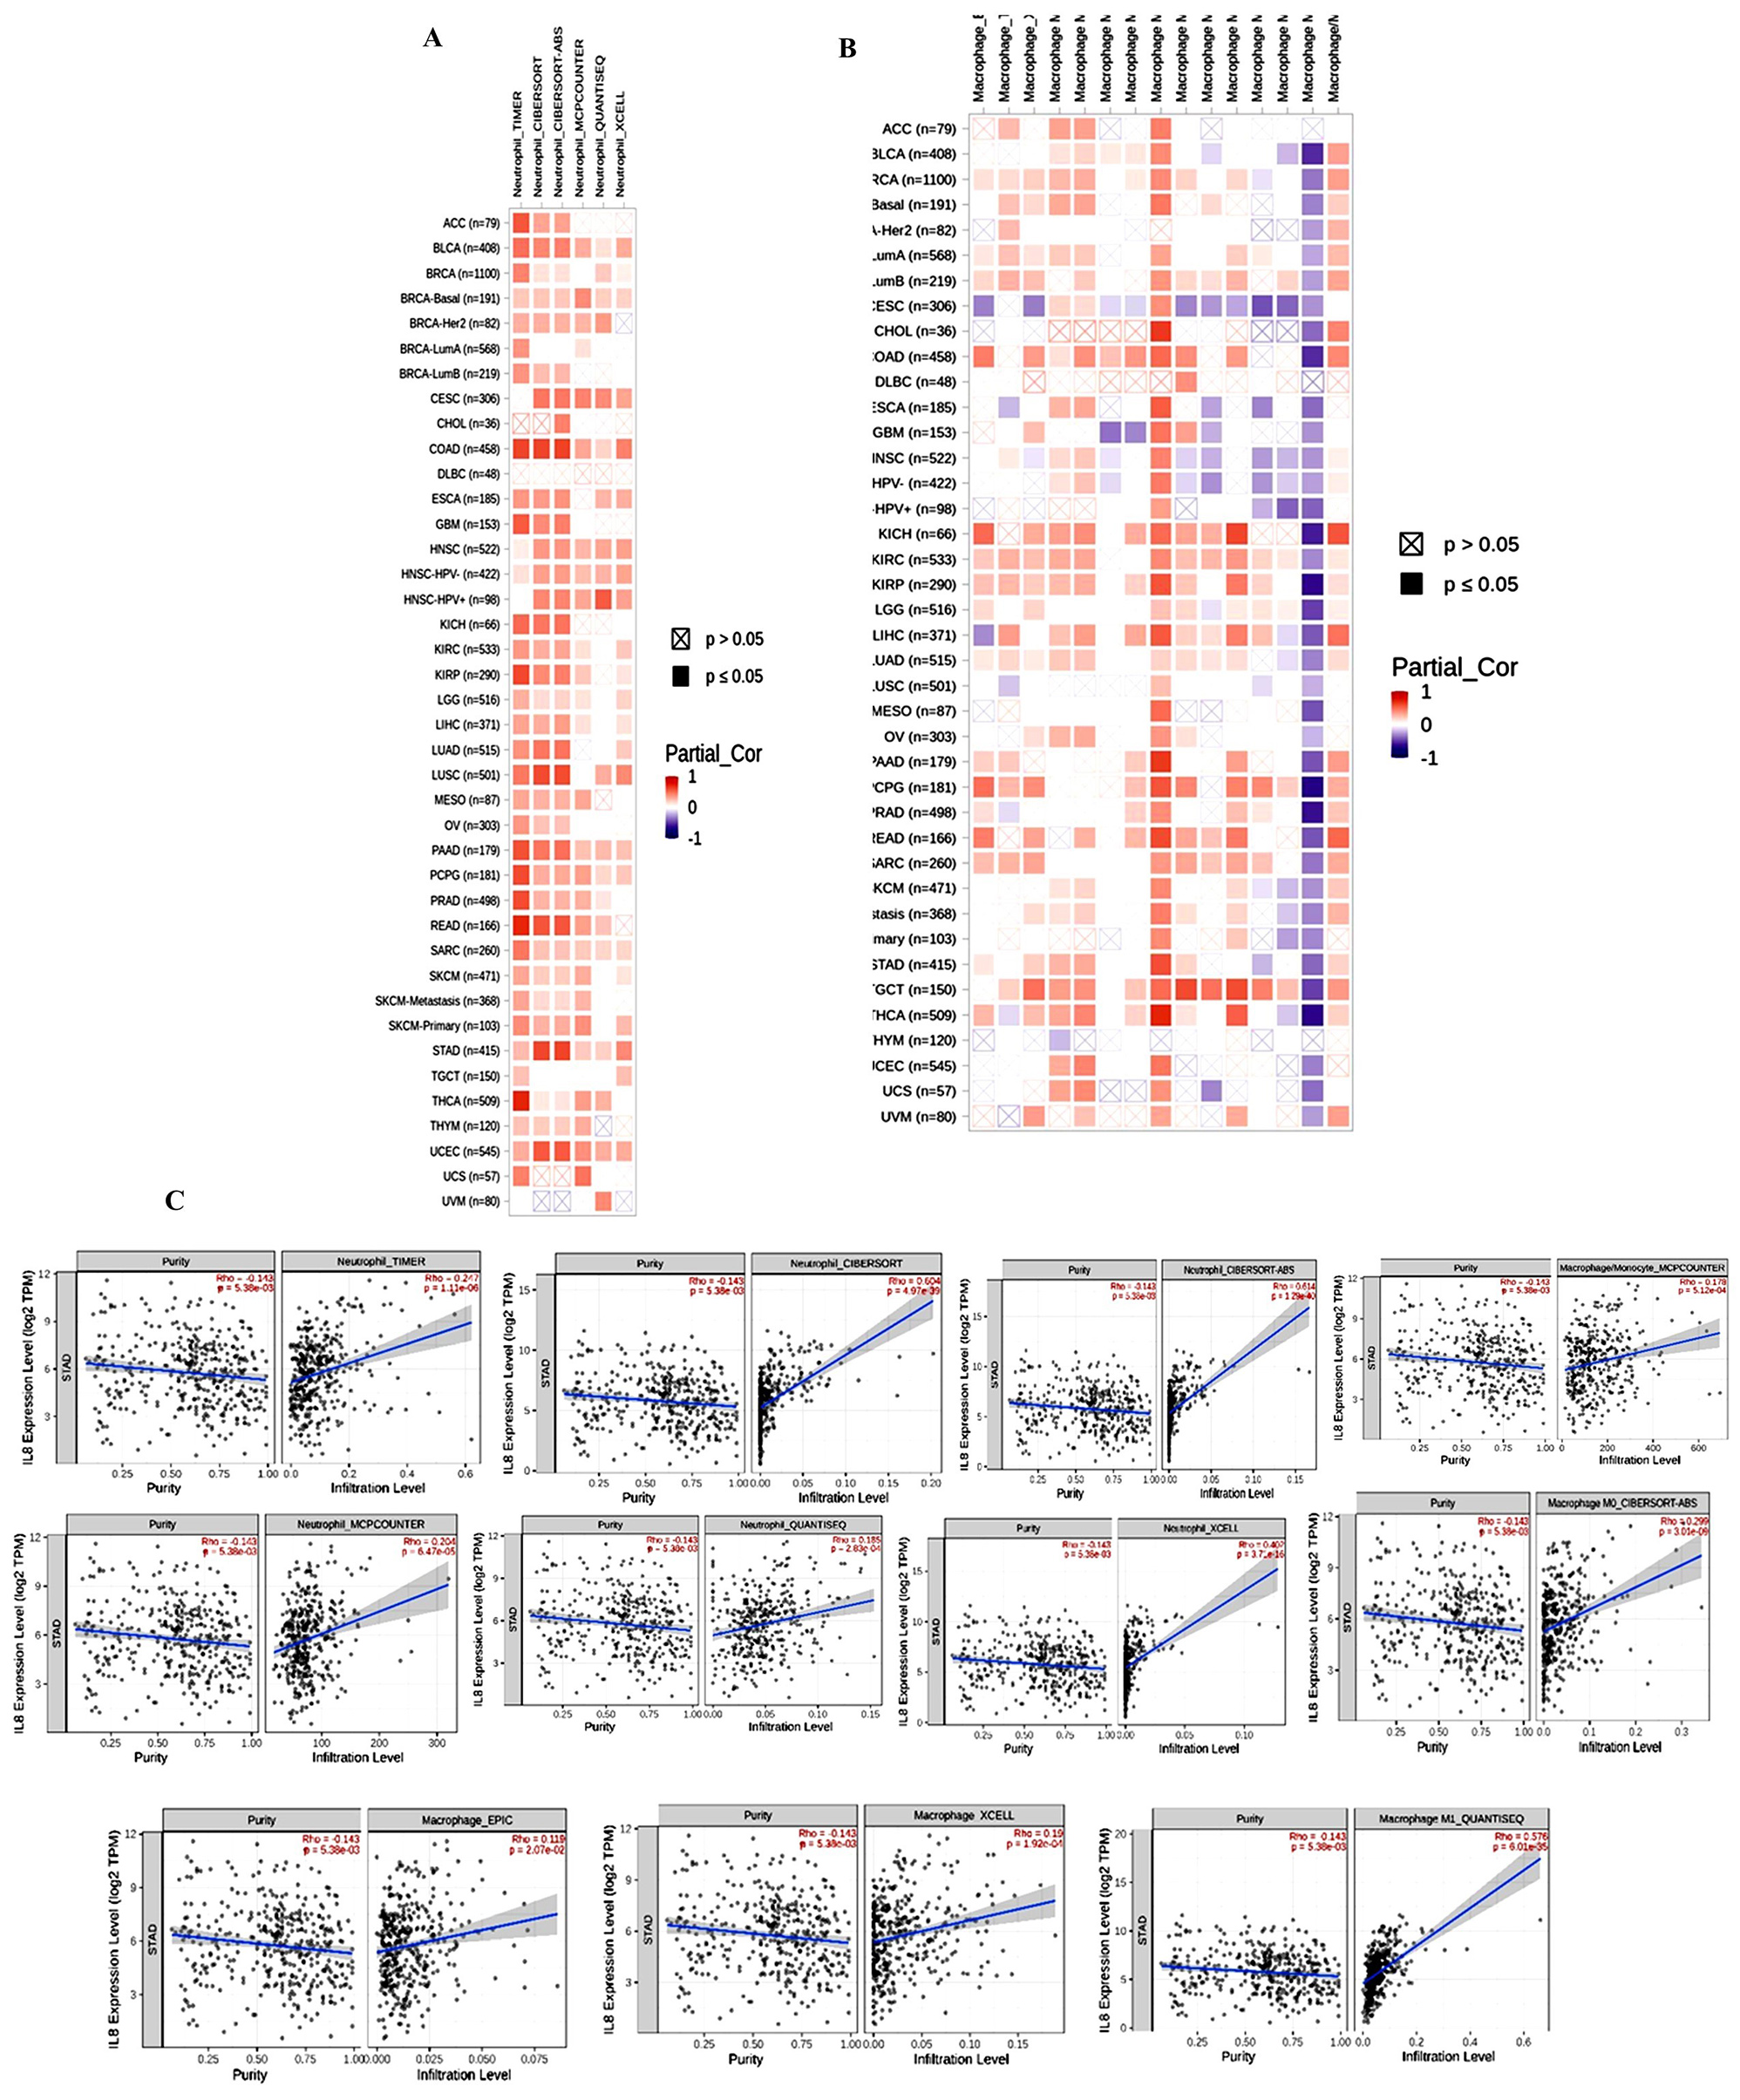
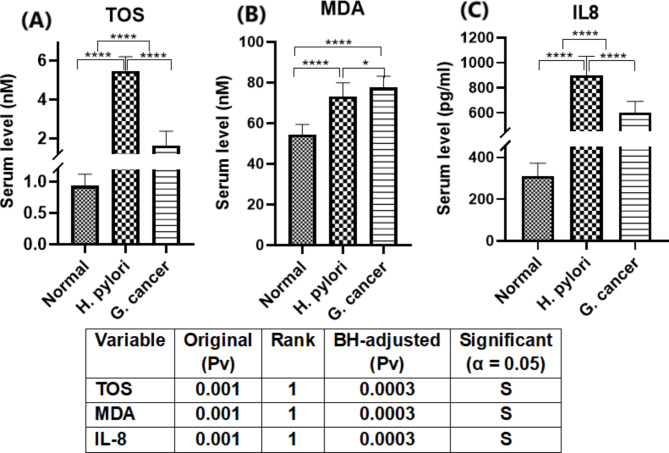
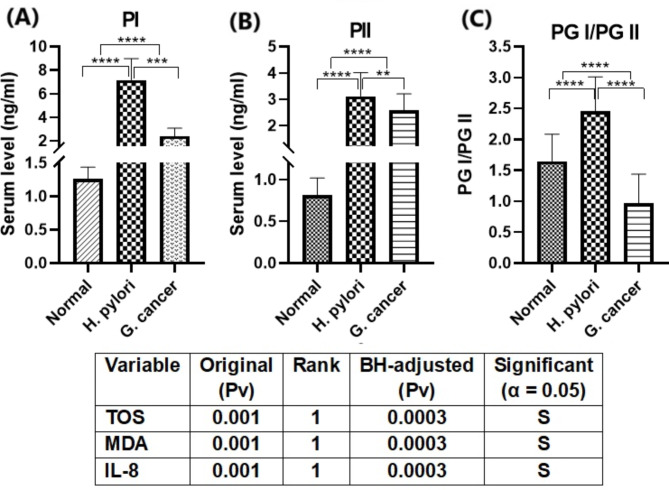
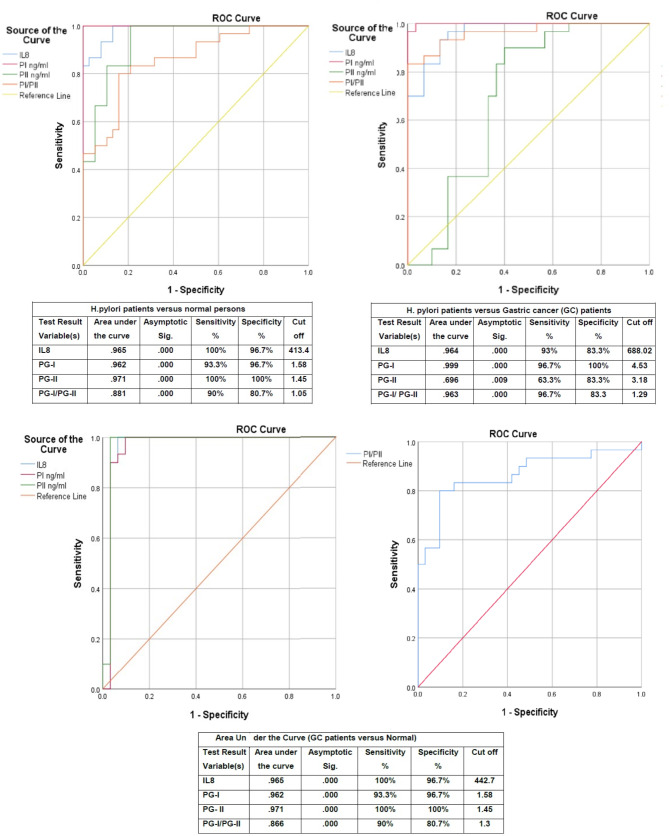
Results: Individuals with H. pylori infection exhibited elevated levels of IL-8 (940.5 ± 249.7 vs. 603.4 ± 89.1 pg/ml, P < 0.0001) and oxidative species (5.47 ± 0.7 vs. 1.64 ± 0.7 nM, P < 0.05) compared to gastric cancer patients, who, despite having lower levels of IL-8 and oxidative species, showed higher levels of MDA. H.pylori patients exhibited significantly higher levels of PG-I (7.28 ± 2.1 vs. 2.61 ± 1.4 ng/ml, P < 0.001), PG-II (3.21 ± 1 vs. 2.6 ± 0.6 ng/ml, P < 0.001), and the PG-I/PG-II ratio (2.27 ± 1.2 vs. 1 ± 0.4, P < 0.001) compared to gastric cancer patients. The findings were substantiated using various data analysis platforms such as Gene Expression Profiling Interactive Analysis (GEPIA), UALCAN (The University of ALabama at Birmingham CANcer data analysis), cBioPortal, and TIMER (Tumor IMmune Estimation Resource). These parameters could serve as potential diagnostic biomarkers for screening and therapeutic interventions based on the cut-off values derived from ROC (receiver operating characteristic) curves for IL-8, PGI, PGII, and PGI/PGII across the three groups.
Conclusions: IL-8, PGI, PGII, and PGI/PGII parameters could serve as potential diagnostic markers for the screening and treatment of gastric conditions.
Keywords: Gastric cancer; Helicobacter pylori; Oxidative stress; Pepsinogen-I; Pepsinogen-I, PG-I/PG-II interleukin-8.
© 2024. The Author(s).
Conflict of interest statement
Declarations. Ethical approval and consent to participate: The Ethics Commission of the Iran University of Medical Sciences (Ethical Code: IR.IUMS.REC.1401.98) verified the project’s compliance with “Helsinki Laws” and approved the study. Informed consent was obtained from all of the participants in the study. Consent for publication: Not applicable. Competing interests: The authors declare no competing interests.
Figures

Similar articles
-
Associations of Serum Pepsinogens and Helicobacter Pylori Infection with High-Sensitivity C-Reactive Protein in Medical Examination Population.Lab Med. 2021 Jan 4;52(1):57-63. doi: 10.1093/labmed/lmaa042. Lab Med. 2021. PMID: 32702129
-
Serum pepsinogen II is a better diagnostic marker in gastric cancer.World J Gastroenterol. 2012 Dec 28;18(48):7357-61. doi: 10.3748/wjg.v18.i48.7357. World J Gastroenterol. 2012. PMID: 23326145 Free PMC article.
-
Serum pepsinogen levels and their influencing factors: a population-based study in 6990 Chinese from North China.World J Gastroenterol. 2007 Dec 28;13(48):6562-7. doi: 10.3748/wjg.v13.i48.6562. World J Gastroenterol. 2007. PMID: 18161928 Free PMC article.
-
PGII Higher than PGI: a Case Analysis and Literature Review.Clin Lab. 2025 May 1;71(5). doi: 10.7754/Clin.Lab.2024.241104. Clin Lab. 2025. PMID: 40387737 Review.
-
Economic Evaluation of Gastric Cancer Screening Strategies: A Systematic Review.J Gastrointest Cancer. 2025 Mar 25;56(1):85. doi: 10.1007/s12029-025-01202-2. J Gastrointest Cancer. 2025. PMID: 40131569
Cited by
-
Therapeutic potential of microbiome modulation in reproductive cancers.Med Oncol. 2025 Apr 6;42(5):152. doi: 10.1007/s12032-025-02708-2. Med Oncol. 2025. PMID: 40188410 Review.
-
Integrated analysis of myeloperoxidase in gastric health and cancer: associations with pepsinogen levels, immune regulation, and prognosis in a large healthy population-based and TCGA cohorts.Front Immunol. 2025 Jun 6;16:1590257. doi: 10.3389/fimmu.2025.1590257. eCollection 2025. Front Immunol. 2025. PMID: 40547041 Free PMC article.
-
Cytokine Regulation and Oxidative Stress in Helicobacter Pylori-Associated Gastric Adenocarcinoma at Different Stages: Insights from a Cross-Sectional Study.Int J Mol Sci. 2025 Aug 6;26(15):7609. doi: 10.3390/ijms26157609. Int J Mol Sci. 2025. PMID: 40806737 Free PMC article.
References
-
- Yan L, Chen Y, Chen F, Tao T, Hu Z, Wang J, et al. Effect of Helicobacter pylori eradication on gastric cancer prevention: updated report from a randomized controlled trial with 26.5 years of follow-up. Gastroenterology. 2022;163(1):154–62. e3. - PubMed
-
- Usui Y, Taniyama Y, Endo M, Koyanagi YN, Kasugai Y, Oze I, et al. Helicobacter pylori, homologous-recombination genes, and gastric cancer. N Engl J Med. 2023;388(13):1181–90. - PubMed
-
- Ferlay J, Colombet M, Soerjomataram I, Mathers C, Parkin DM, Piñeros M, et al. Estimating the global cancer incidence and mortality in 2018: GLOBOCAN sources and methods. Int J Cancer. 2019;144(8):1941–53. - PubMed
MeSH terms
Substances
LinkOut - more resources
Full Text Sources
Medical
