. 2025 Jan 2;26(1):2.
doi: 10.1186/s13059-024-03464-8.

Spatiotemporal dynamics of early oogenesis in pigs

Affiliations

Spatiotemporal dynamics of early oogenesis in pigs

Wei Ge et al. Genome Biol. .

Abstract

Background: In humans and other mammals, the process of oogenesis initiates asynchronously in specific ovarian regions, leading to the localization of dormant and growing follicles in the cortex and medulla, respectively; however, the current understanding of this process remains insufficient.

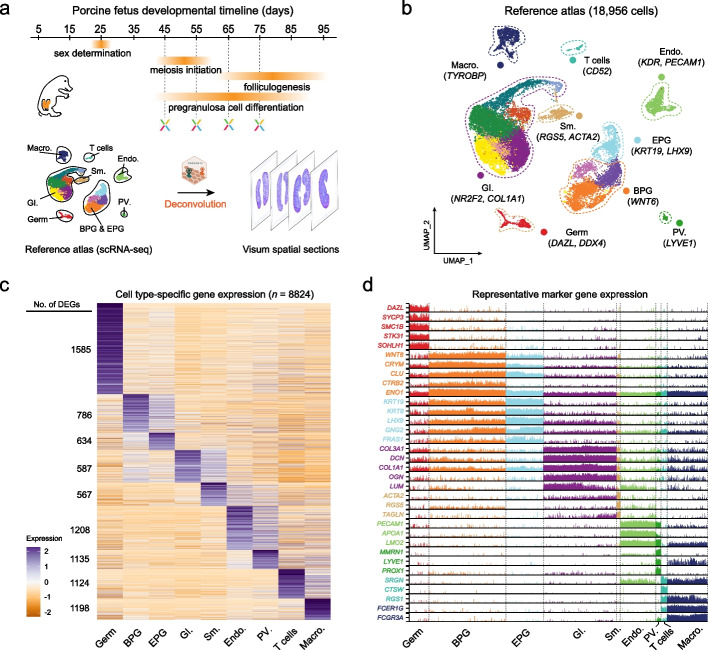
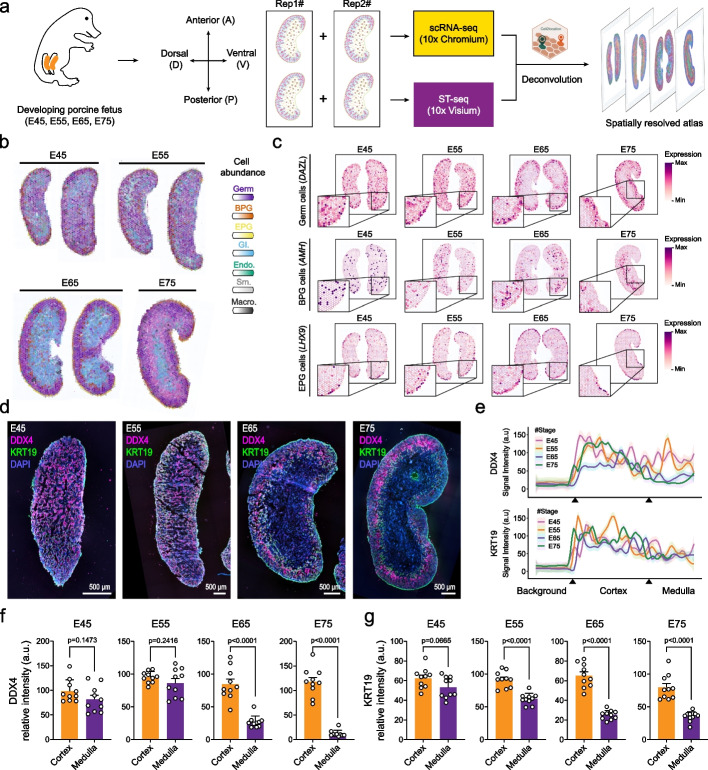
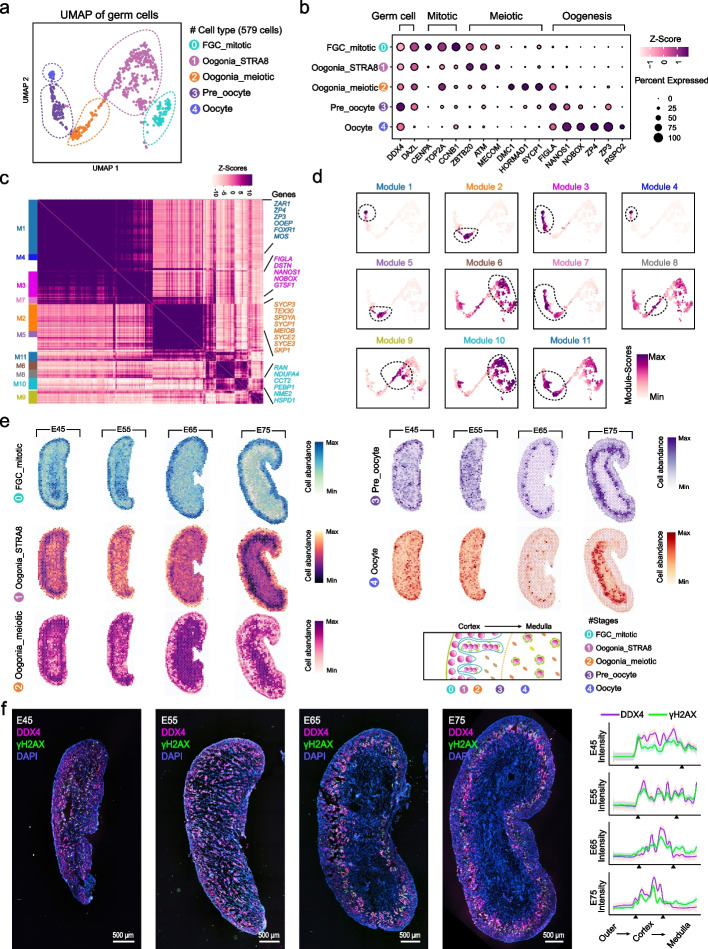
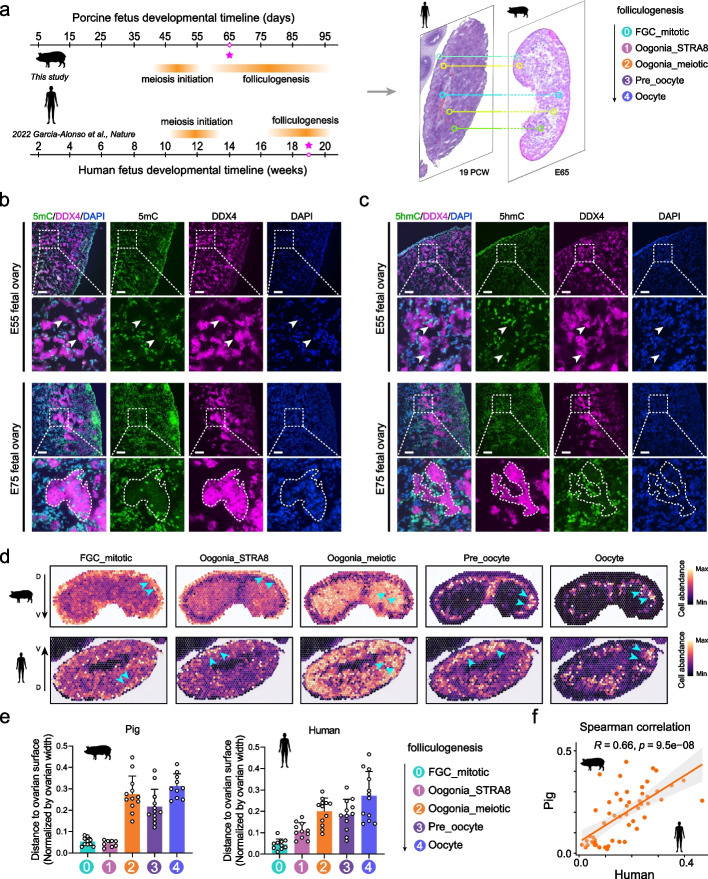
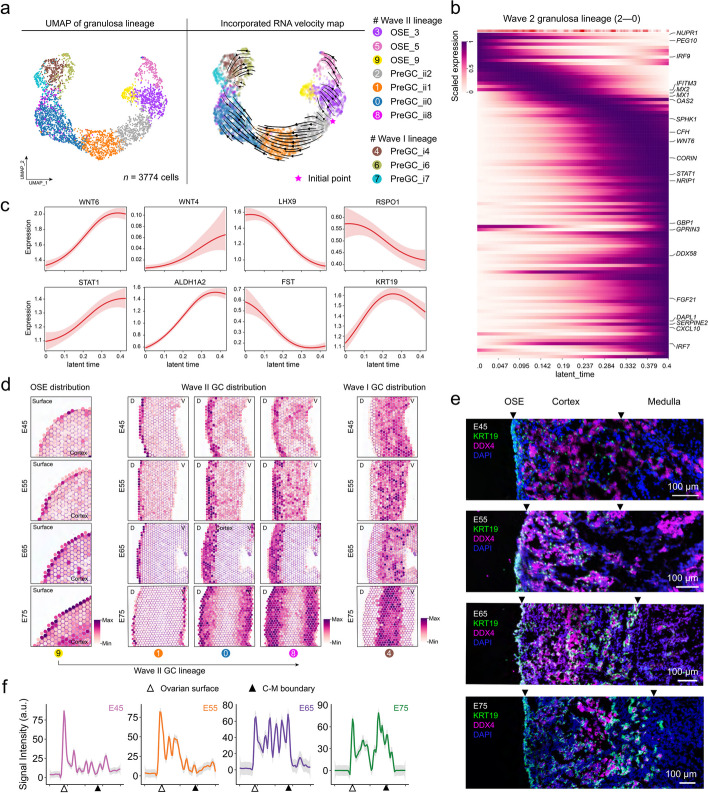
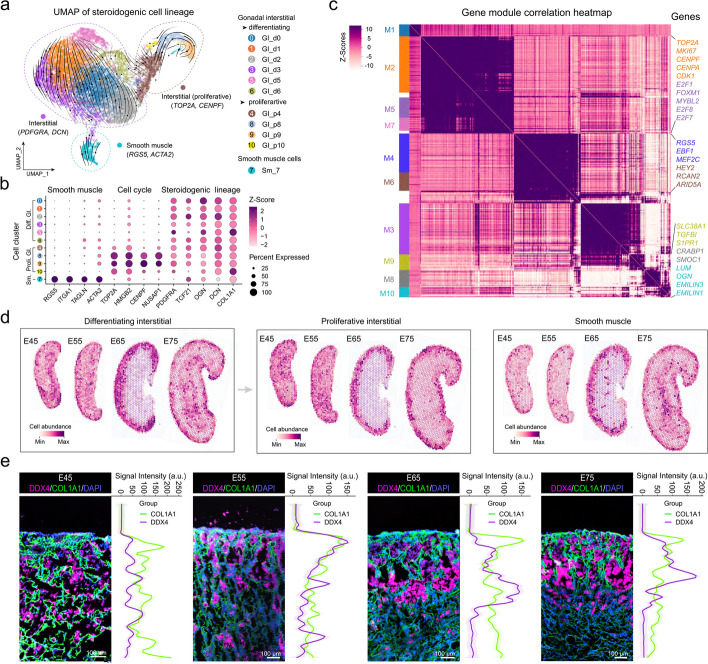
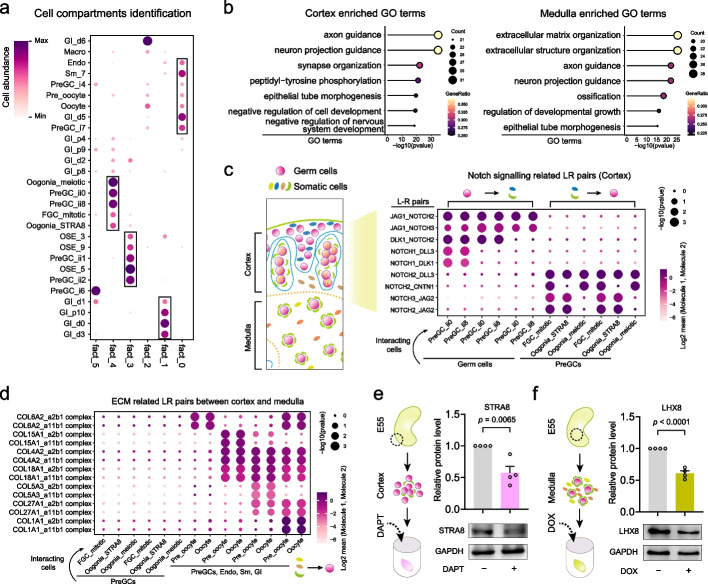
Results: Here, we integrate single-cell RNA sequencing (scRNA-seq) and spatial transcriptomics (ST) to comprehend spatial-temporal gene expression profiles and explore the spatial organization of ovarian microenvironments during early oogenesis in pigs. Projection of the germ cell clusters at different stages of oogenesis into the spatial atlas unveils a "cortical to medullary (C-M)" distribution of germ cells in the developing porcine ovaries. Cross-species analysis between pigs and humans unveils a conserved C-M distribution pattern of germ cells during oogenesis, highlighting the utility of pigs as valuable models for studying human oogenesis in a spatial context. RNA velocity analysis with ST identifies the molecular characteristics and spatial dynamics of granulosa cell lineages originating from the cortical and medullary regions in pig ovaries. Spatial co-occurrence analysis and intercellular communication analysis unveils a distinct cell-cell communication pattern between germ cells and somatic cells in the cortex and medulla regions. Notably, in vitro culture of ovarian tissues verifies that intercellular NOTCH signaling and extracellular matrix (ECM) proteins played crucial roles in initiating meiotic and oogenic programs, highlighting an underappreciated role of ovarian microenvironments in orchestrating germ cell fates.

Conclusions: Overall, our work provides insight into the spatial characteristics of early oogenesis and the regulatory role of ovarian microenvironments in germ cell fate within a spatial context.

Keywords: Early oogenesis; Microenvironments; Spatiotemporal transcriptomics.


Conflict of interest statement

Declarations. Ethics approval and consent to participate: All experimental procedures involving animal experiments were approved by the Ethics Committee of Qingdao Agricultural University (No. SYXK-20220–021). Consent for publication: Not applicable. Competing interests: The authors declare that they have no competing interests.

Figures

Fig. 1
Fig. 1
scRNA-seq of the developing porcine ovary. a A brief scheme depicting study design and sampling information. Four developmental time points spanning meiosis prophase I and early folliculogenesis were included. The scRNA-seq libraries from E45 to E75 were constructed using tissues from two independent embryos, and for each embryo, one ovary tissue was used for scRNA-seq, while the other was used for ST to enhance the accuracy of cell type deconvolution. For ST, E45-E65 contains two ovary sections from two independent embryos, and E75 contains one ovarian section due to the chip size. b UMAP plot showing different cell clusters annotated by canonical marker gene expression. BPG, biopotential pregranulosa; EPG, epithelial pregranulosa; GI, gonadal interstitial; PV, perivascular; Sm, smooth muscle; Endo, endothelial; Macro, macrophage. c Heatmap demonstrating cell-type specific marker gene expression across different cell populations. Numbers on the left indicate the number of identified cell cluster-specific expressed genes. d Trackplot demonstrating representative marker gene expression for each cell type
Fig. 2
Fig. 2
Deconvolution of ST based on scRNA-seq using Cell2location. a A brief scheme illustrating the cell type deconvolution procedure using Cell2location. b Estimated cell abundances (revealed by color intensity) of seven major cell types across four developmental time points. c Visualization of the spatial gene expression pattern of the canonical marker gene in germ cells, BPG, and EPG across four developmental time points. The intensity of color represents the relative level of gene expression. d Whole-mount staining assay of germ cell marker DDX4 (magenta) and EPG marker KRT19 (green) using ovaries from E45-E75 fetal porcine ovaries. DAPI was used to stain nuclei. Scale bars, 500 μm. e Comparative analysis of DDX4 (top panel) and KRT19 (bottom panel) fluorescence intensity along the ovarian dorsal–ventral axis. The triangular in the x-axis from left to right represents the position of the ovarian surface and the boundary between the cortex and medulla regions, and the distance was normalized by the ovarian width. For each group, at least five random linear fluorescence intensity profiles were measured and the shaded regions around the curves depict the 95% confidence intervals. f The comparative analysis of DDX4 fluorescence staining signal intensity between the cortex and medulla regions was conducted. Ten regions of interest (ROI) were captured for each group using ImageJ. Data are presented as mean ± SEM. g The comparative analysis of KRT19 fluorescence staining signal intensity between the cortex and medulla regions was conducted. Ten ROI were captured for each group using ImageJ. Data are presented as mean ± SEM
Fig. 3
Fig. 3
Characterization of germ cell spatial location pattern using ST. a Fine-scale characterization of germ cell subclusters at the early stage of oogenesis in pigs. FGC_mitotic, mitotic germ cells; Oogonia_STRA8, pre-meiotic germ cells; Oogonia_meiotic, meiotic germ cells; Pre_oocyte, early oocytes. b Dot plot illustrating stage-specific marker gene expression across germ cell subclusters. c Correlation heatmap of functional gene modules identified by Hotspot analysis. Representative module genes were colored-coded in the right panel. d Scoring of Hotspot-identified gene modules in the UMAP plot. e Estimated abundance (revealed by color intensity) of germ cells at different developmental stages across four developmental time points. The schematic diagram in the bottom right corner illustrates the relative spatial location of germ cell subclusters at different stages in the ovary. f Left panel: Characterization of leptotene stage germ cells in situ by whole-mount co-staining of DDX4 (magenta) and γH2AX (green). DAPI was used to stain nuclei. Scale bars, 500 μm. Right panel: Normalized fluorescence intensity of DDX4 and γH2AX along the dorsal–ventral axis. The range of the x-axis represents the distance from the outer edge to the middle of the ovary. For each group, at least five random linear fluorescence intensity profiles were measured and the shaded regions around the curves depict the 95% confidence intervals
Fig. 4
Fig. 4
Cross-species comparative analysis of ovarian ST data between pigs and humans. a A brief diagram illustrating the timeline of oogenesis progression between pigs and humans, and sampling time point used for cross-species analysis. b Immunofluorescence for 5-methylcytosine (5mC, green) and DDX4 (magenta) in E55 and E75 fetal ovaries. Scale bars, 100 μm. c Immunofluorescence for 5-hydroxymethylcytosine (5hmC, green) and DDX4 (magenta) in E55 and E75 fetal ovaries. Scale bars, 100 μm. d Comparison of the spatial location of germ cells at different stages of oogenesis in the spatial context between pigs and humans. Arrows indicate the localization of representative high-abundance cell populations. e Comparative analysis of the relative spatial distance from germ cells to the ovarian surface in pigs and humans. The y-axis represents the relative distance normalized by ovarian width (along the dorsal–ventral axis). f Spearman correlation analysis of the spatial location of germ cells at different stages of oogenesis between pigs and humans
Fig. 5
Fig. 5
Characterization of pregranulosa cell developmental trajectory and their spatial location pattern using ST. a Fine-scale characterization of pregranulosa cell heterogeneity and inference of pregranulosa cell developmental trajectory by CellRank. n indicates the number of cells analyzed and the pentagram represents the initiation point of differentiation identified by CellRank. b Smoothed gene expression trends of the top 100 genes whose expression correlates with wave II pregranulosa cell lineage; genes were ranked from top to bottom according to their expression pattern in latent time. c Representative marker gene expression trend along the wave II granulosa cell developmental trajectory (latent time). d Estimated cell abundances (color intensity) of two main pregranulosa lineage subtypes across four developmental time points. e Characterization of the spatial dynamics of wave II granulosa cells in porcine ovaries from E45 to E75 using KRT19 (green) and DDX4 (magenta). The sections for each stage represent magnifying images of ovarian sections along the dorsal–ventral axis. Scale bars, 100 μm. f Comparative analysis of the fluorescence signal intensity of KRT19 at different stages along the dorsal–ventral axis. The range of the x-axis represents the distance from the outer edge to the middle of the ovary. For each group, at least five random linear fluorescence intensity profiles were measured and the shaded regions around the curves depict the 95% confidence intervals
Fig. 6
Fig. 6
Characterization of steroidogenic cell lineage heterogeneity and spatial location pattern using ST. a Fine-scale characterization of steroidogenic cell lineage cell heterogeneity. Arrows in the UMAP plot indicate RNA velocity vectors. GI, gonadal interstitial; Sm, smooth muscle. b Dot plot illustrating representative marker gene expression across steroidogenic cell lineage. c Correlation heatmap of functional gene modules identified by Hotspot analysis. Representative module genes were colored-coded in the right panel. d Estimated cell abundances (color intensity) of GI and Sm cell subtypes across four developmental time points. e Comparative analysis of the fluorescence signal intensity of COL1A1 (green) and DDX4 (magenta) at different stages along the dorsal–ventral axis. From top to bottom represents the distance from the outer edge to the middle of the ovary. The fluorescence intensity in each image is presented from top to bottom on the right side of each image. For each group, at least five random linear fluorescence intensity profiles were measured and the shaded regions around the curves depict the 95% confidence intervals. Scale bars, 100 μm
Fig. 7
Fig. 7
Comparison of cell–cell communication patterns between the ovarian cortex and medulla. a Cell type co-occurrence analysis using NMF. Columns indicate NMF components while rows indicate estimated weights of cell types. b GO enrichment analysis of intercellular communication patterns between cortical and medullary cell populations in the porcine ovary. c Dot plot showing representative NOTCH signaling related L-R pairs between pregranulosa cells and germ cells in the cortex region. d Dot plot showing representative ECM-related L-R pairs between germ cells and somatic cells in the medulla region. e The effects of the NOTCH signaling inhibitor DAPT on the expression of meiotic marker STRA8 during in vitro culture of cortex tissues isolated from E55 fetal ovaries. Ovarian tissues were harvested after 10 days in vitro suspension culture. Data are presented as mean ± SEM. f The effects of the matrix metalloproteinase inhibitor doxycycline on the expression of folliculogenesis marker LHX8 during in vitro culture of medulla tissues isolated from E55 fetal ovaries. Ovarian tissues were harvested after 10 days in vitro suspension culture. Data are presented as mean ± SEM

References

    1. Zhang J, Yan L, Wang Y, Zhang S, Xu X, Dai Y, et al. In vivo and in vitro activation of dormant primordial follicles by EGF treatment in mouse and human. Clin Transl Med. 2020;10: e182. - PMC - PubMed
    1. Grosbois J, Bailie EC, Kelsey TW, Anderson RA, Telfer EE. Spatio-temporal remodelling of the composition and architecture of the human ovarian cortical extracellular matrix during in vitro culture. Hum Reprod. 2023;38:444–58. - PMC - PubMed
    1. Zheng W, Zhang H, Gorre N, Risal S, Shen Y, Liu K. Two classes of ovarian primordial follicles exhibit distinct developmental dynamics and physiological functions. Hum Mol Genet. 2014;23:920–8. - PMC - PubMed
    1. Niu W, Spradling AC. Two distinct pathways of pregranulosa cell differentiation support follicle formation in the mouse ovary. Proc Natl Acad Sci U S A. 2020;117:20015–26. - PMC - PubMed
    1. Richardson BE, Lehmann R. Mechanisms guiding primordial germ cell migration: strategies from different organisms. Nat Rev Mol Cell Biol. 2010;11:37–49. - PMC - PubMed

LinkOut - more resources