. 2025 Jan 2;21(1):1.
doi: 10.1186/s12993-024-00261-y.

Host genetics maps to behaviour and brain structure in developmental mice

Affiliations

Host genetics maps to behaviour and brain structure in developmental mice

Sarah Asbury et al. Behav Brain Funct. .

Abstract

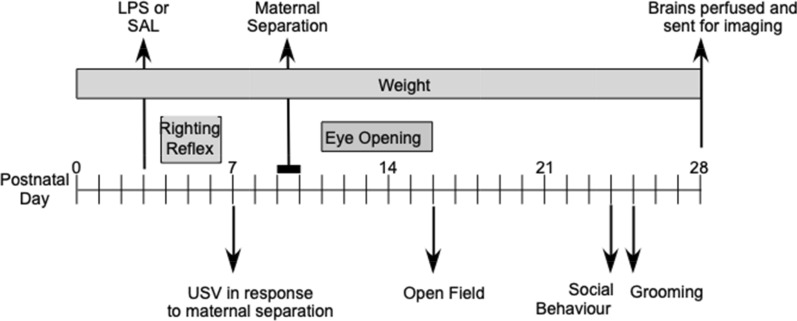
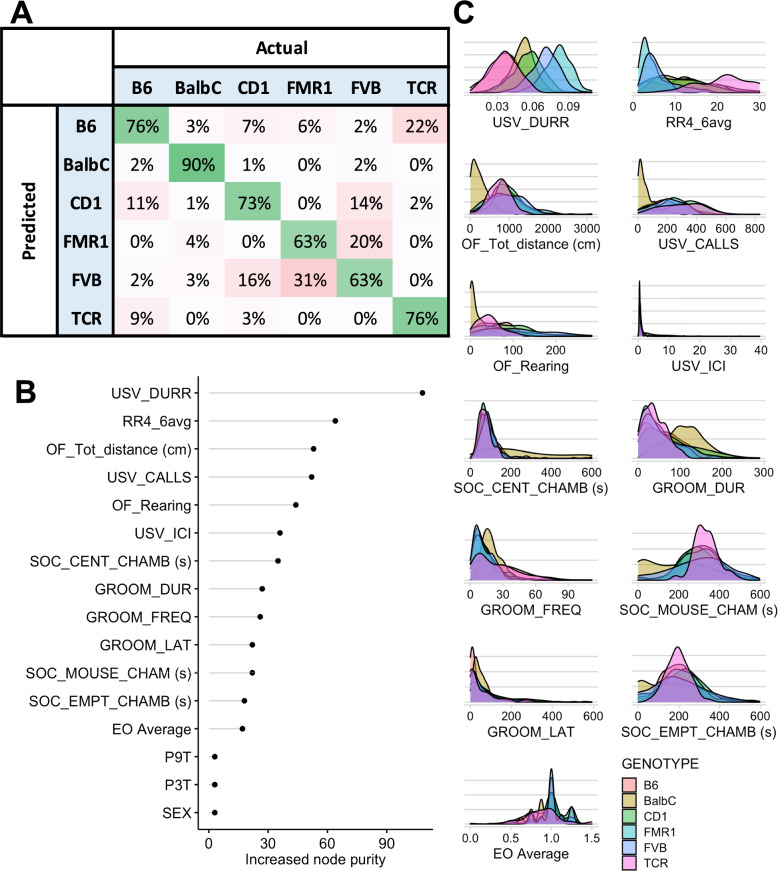
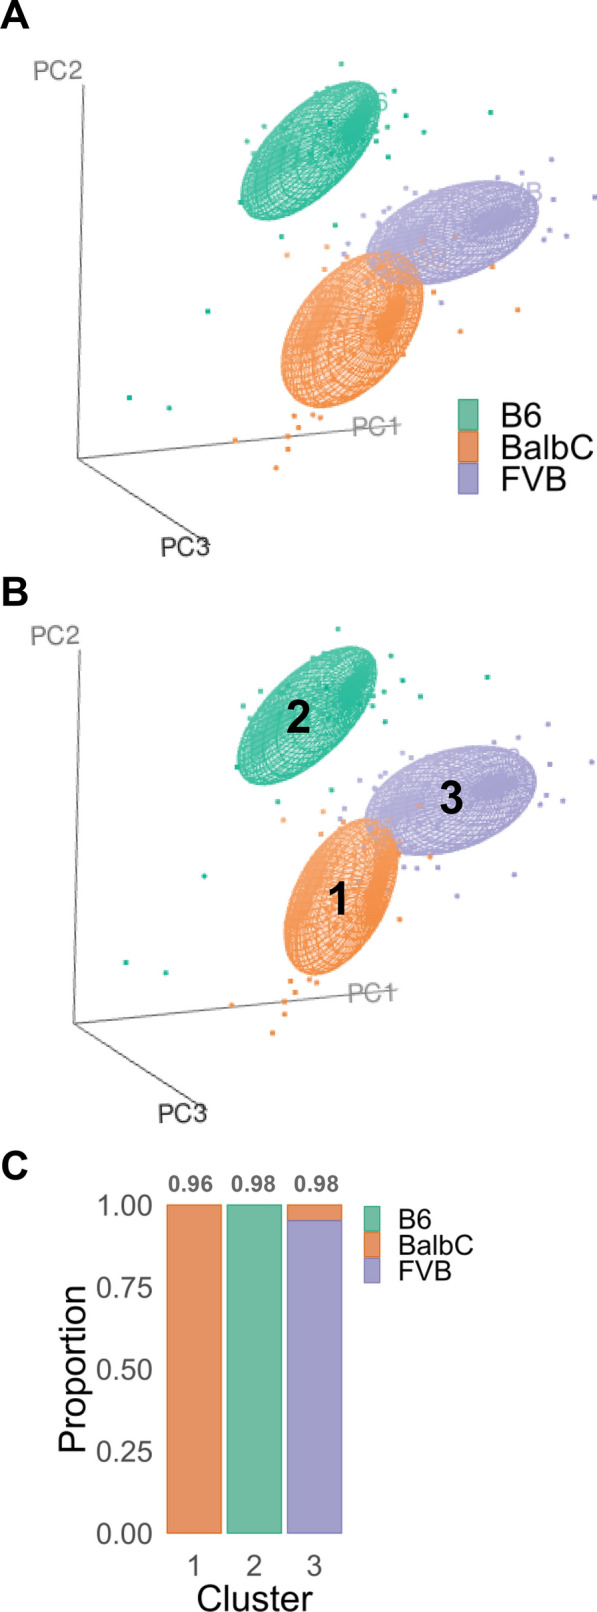
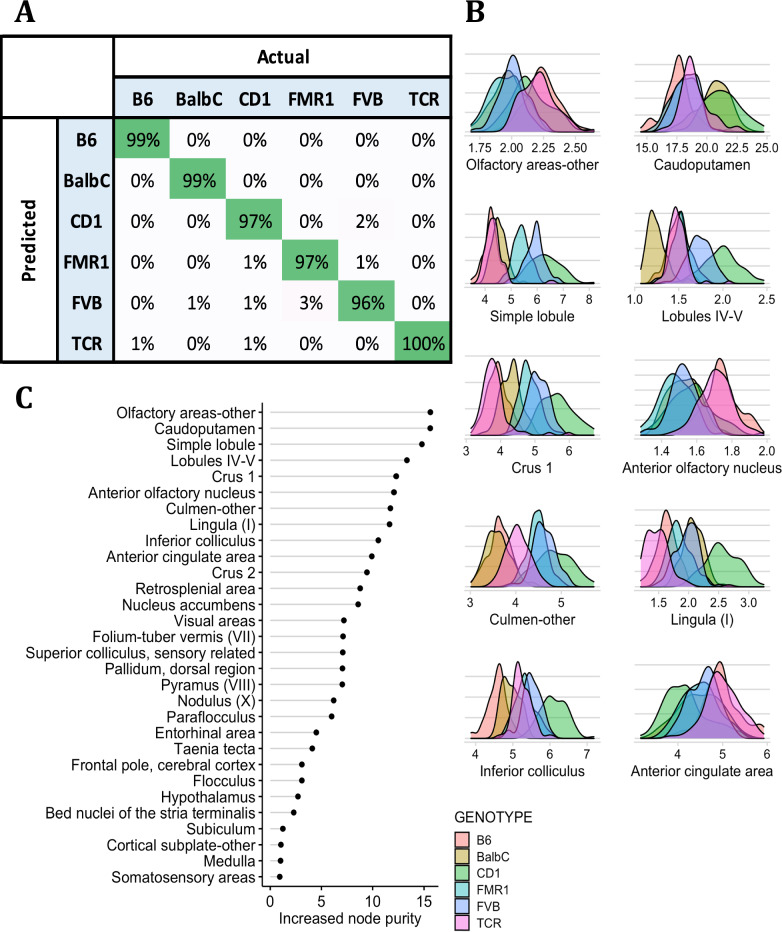
Gene-environment interactions in the postnatal period have a long-term impact on neurodevelopment. To effectively assess neurodevelopment in the mouse, we developed a behavioural pipeline that incorporates several validated behavioural tests to measure translationally relevant milestones of behaviour in mice. The behavioral phenotype of 1060 wild type and genetically-modified mice was examined followed by structural brain imaging at 4 weeks of age. The influence of genetics, sex, and early life stress on behaviour and neuroanatomy was determined using traditional statistical and machine learning methods. Analytical results demonstrated that neuroanatomical diversity was primarily associated with genotype whereas behavioural phenotypic diversity was observed to be more susceptible to gene-environment variation. We describe a standardized mouse phenotyping pipeline, termed the Developmental Behavioural Milestones (DBM) Pipeline released alongside the 1000 Mouse Developmental Behavioural Milestones (1000 Mouse DBM) database to institute a novel framework for reproducible interventional neuroscience research.

Keywords: Early life stress; Machine learning; Neurodevelopment; Random forest; Structural MRI.


Conflict of interest statement

Declarations. Ethics approval and consent to participate: All experimental procedures were approved by the Animal Research Ethics Board, McMaster University in accordance with the guidelines of the Canadian Council on Animal Care. Consent for publication: Not applicable. Competing interests: JAF serves on the Scientific Advisory Board for MRM Health NL and has received consulting/speaker fees from Alphasights, Novozymes, Klaire Labs, Takeda Canada, Rothman, Benson, Hedges Inc, and WebMD. All other authors have no conflicts to report.

Figures

Fig. 1
Fig. 1
Experimental design showing postnatal challenges, developmental outcomes and behavioural tests used in the first 4 weeks of postnatal life
Fig. 2
Fig. 2
Representative behavioural graphs for righting reflex on postnatal day (P) 4–6 and average righting reflex time (A), ultrasonic vocalizations (USV) (B), SAL treated mice are shown as grey and LPS treated mice as orange (A, B). Total distance travelled in the Open Field at P17 is shown for different treatment conditions at P3 and P9—SALCON, SALMS, LPSCON, LPSMS (C). Data is shown for female and male C57Bl/6 mice (mean ± S.E.)
Fig. 3
Fig. 3
Representative behavioural graphs for self grooming (A) and sociability (B). Data is shown for female and male C57Bl/6 mice (mean ± S.E.). Female (B-left panel) and male (B-right panel) mice showed typical sociability measured as social preference for chamber with stranger mouse. * p < 0.05, significantly different from stranger time
Fig. 4
Fig. 4
Principal component analysis of all neurodevelopment and behavioral metrics in inbred mice. Variance explained: PC1 = 25.4%, PC2 = 14.1% PC3 = 11.8%. A Top: PCA points coloured by genotype. Balb/C = Orange, FVB = Purple, B6 = Green. Bottom: PCA points coloured by 3 clusters generated by unsupervised hierarchical clustering (k = 3). Orange = Cluster 1 (Jaccard Index = 0.65), Green = Cluster 2 (Jaccard Index = 0.71), Purple = Cluster 3 (Jaccard Index = 0.49). B Behavioural and neurodevelopmental hierarchical cluster membership by mouse strain. Cluster stability is annotated above the bar graph for each cluster. Cluster stability was measured by the average Jaccard similarity index with the clusters of 1000 bootstrapped samples
Fig. 5
Fig. 5
Random Forest machine learning models accurately predict mouse genotype using behavioural and neurodevelopmental outcomes. Behavioural outcomes, neurodevelopmental outcomes, sex, and treatment (P3T and P9T) were input as predictor variables. A Confusion matrix represented as proportion of prediction from the total observations across 10 validation sets for each genotype. B Variable importance of predictor variables for genotype as measured by increased Gini index when included in the model. C Density plots of behavioural and neurodevelopmental outcomes for each mouse genotype P3T—postnatal day 3 treatment, P9T—postnatal day 9 treatment, EO—eye opening, SOC_EMP_CHAMB—time in empty chamber, SOC_CENT_CHAMB—time in the center chamber, SOC_MOUSE_CHAM—time in mouse chamber, DUR—duration, FREQ—frequency, LAT—latency, USV—ultrasonic vocalization, ICI—intercall interval, OF—open field, Tot—total, RR4—righting reflex postnatal day 4, DURR—duration
Fig. 6
Fig. 6
Principal component analysis of MRI relative volumes in inbred mice. Brain regions included in analysis are available in Supplementary File 3 and Supplementary Fig. S3. Variance explained: PC1 = 23.2%, PC2 = 15.9% PC3 = 11.3%. A PCA, observations coloured by Genotype. B PCA points coloured by 3 clusters generated by unsupervised hierarchical clustering. Orange = Cluster 1, Green = Cluster 2, Purple = Cluster 3. C Bar graph describing the proportion of observations belonging to each Genotype in Clusters I, 2, and 3
Fig. 7
Fig. 7
Random Forest machine learning models accurately predict mouse genotype from relative neuroanatomical volumes. The brain regions used as predictor variables are listed in Supplemental File 3. A Confusion matrix represented as proportion of genotype predictions from the total number of each genotype across 10 validation sets. B Variable importance of predictor variables for genotype as measured by increased Gini index when included in the model. The top 20 ranked, random 5, and lowest 5 ranked predictor variables were plotted. C Density plots of brain regions in the top 20 of predictor variable importance; grouped by mouse genotype
Fig. 8
Fig. 8
Neurodevelopment and behavioral metrics from 871 clustered by Euclidian distances. Ward.D2 hierarchical clustering method was used to generate 2 clusters. Clusters were bootstrapped to validate cluster stability (Jaccard Mean = 0.972 (Cluster i), 0.986 (Cluster ii))

Similar articles

References

    1. Foster JA, MacQueen G: Neurobiological factors linking personality traits and major depression. Can J Psychiatry 2008, 53(1):6–13. - PubMed
    1. Belay H, Burton CL, Lovic V, Meaney MJ, Sokolowski M, Fleming AS: Early adversity and serotonin transporter genotype interact with hippocampal glucocorticoid receptor mRNA expression, corticosterone, and behavior in adult male rats. Behav Neurosci 2011, 125(2):150–160. - PubMed
    1. Bilbo SD: Early-life infection is a vulnerability factor for aging-related glial alterations and cognitive decline. Neurobiol Learn Mem 2010, 94(1):57–64. - PMC - PubMed
    1. Fox WM. Reflex-ontogeny and behavioural development of the mouse. Anim Behav. 1965;13(2):234–41. - PubMed
    1. Hill JM, Lim MA, Stone MM. Developmental milestones in the newborn mouse. In: Gozes I, editor. Neuropeptide techniques. Totowa, NJ: Humana Press; 2008. p. 131–49. 10.1007/978-1-60327-099-1_10.

LinkOut - more resources