. 2025 Jan 2;44(1):2.
doi: 10.1186/s13046-024-03269-4.

Gastric cancer-derived exosomal let-7 g-5p mediated by SERPINE1 promotes macrophage M2 polarization and gastric cancer progression

Affiliations

Gastric cancer-derived exosomal let-7 g-5p mediated by SERPINE1 promotes macrophage M2 polarization and gastric cancer progression

Zhenzhen Ye et al. J Exp Clin Cancer Res. .

Abstract

Background: Tumor-associated macrophages (TAMs), particularly M2-polarized TAMs, are significant contributors to tumor progression, immune evasion, and therapy resistance in gastric cancer (GC). Despite efforts to target TAM recruitment or depletion, clinical efficacy remains limited. Consequently, the identification of targets that specifically inhibit or reprogram M2-polarized TAMs presents a promising therapeutic strategy.

Objective: This study aims to identify a dual-function target in GC cells that drives both malignant phenotypes and M2 macrophage polarization, revealing its molecular mechanisms to provide novel therapeutic targets for selectivly targeting M2-polarized TAMs in GC.

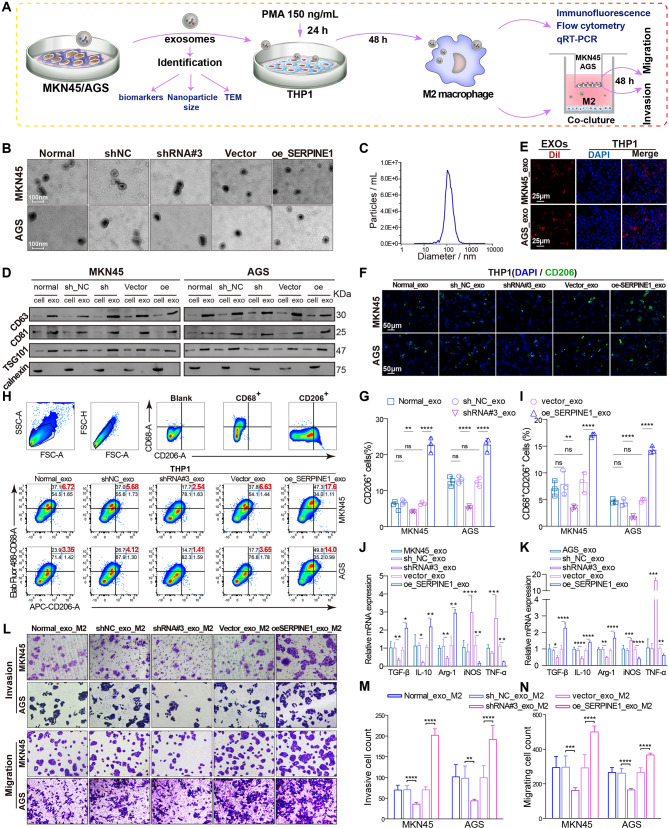
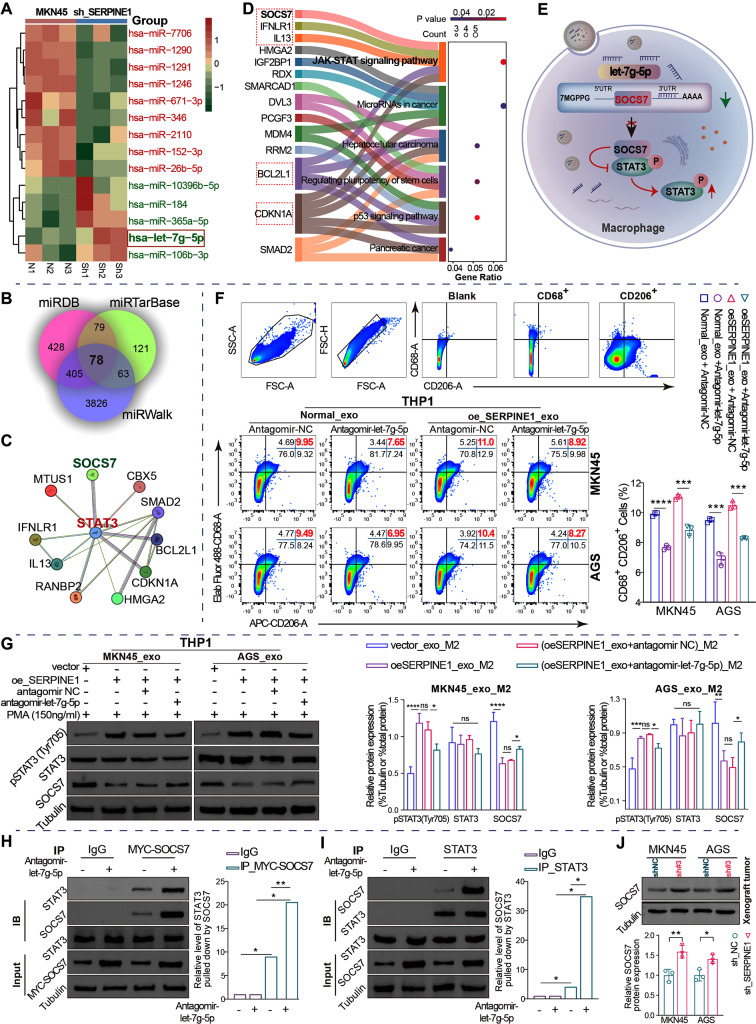
Methods: Transcriptomic and clinical data from GC and adjacent tissues were utilized to identify mRNAs associated with high M2 macrophage infiltration and poor prognosis. Single-cell sequencing elucidated cell types expressing the target gene. Transwell co-culture and exosome intervention experiments demonstrated its role in M2 polarization. Small RNA sequencing of exosomes, western blotting, and CoIP assays revealed the molecular mechanisms underlying exosome-mediated M2 polarization. Protein array, ChIP and dual-luciferase reporter assays clarified the molecular mechanisms by which the target gene regulated exosomal miRNA. In vivo validation was performed using xenograft tumor models.

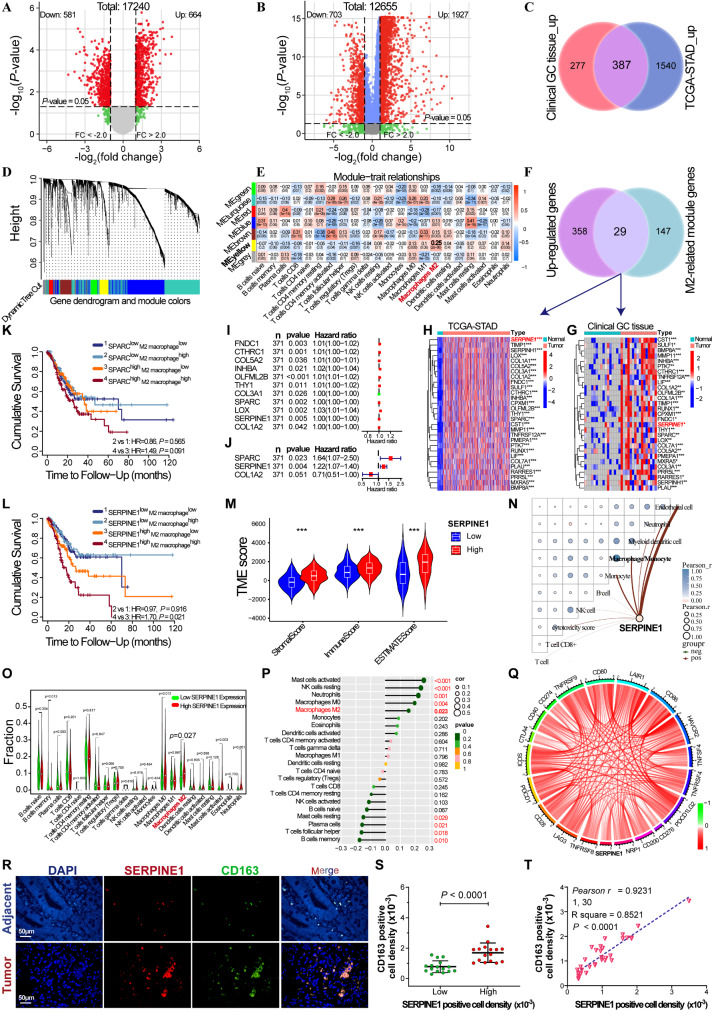
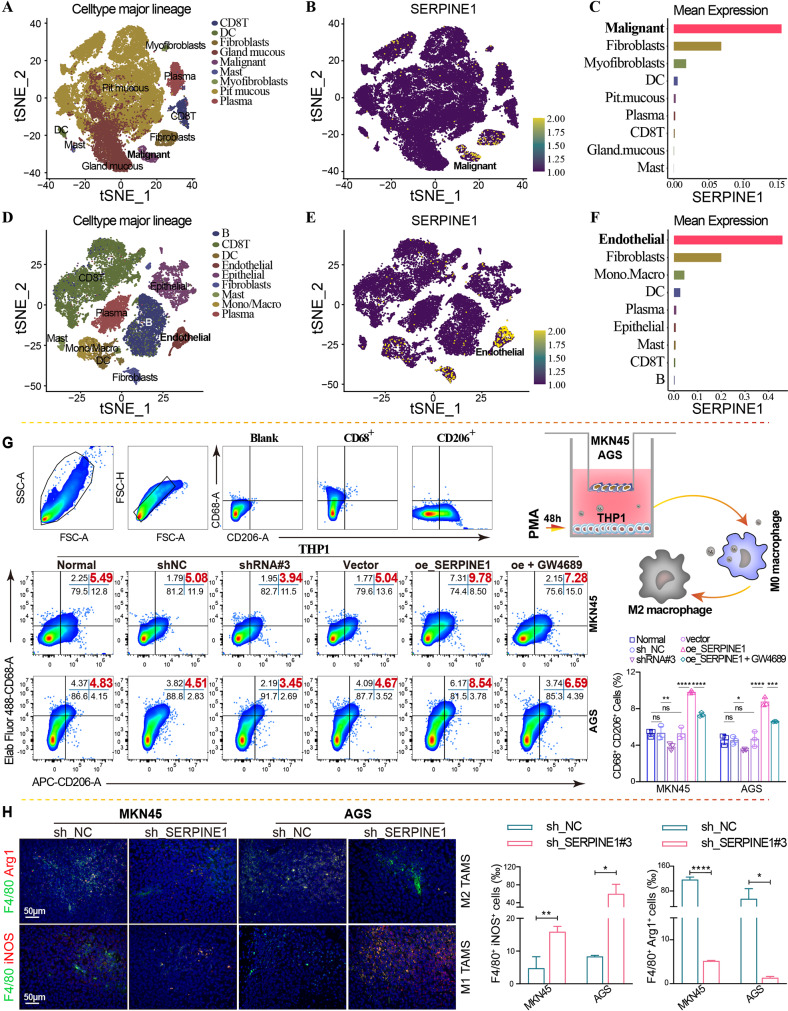
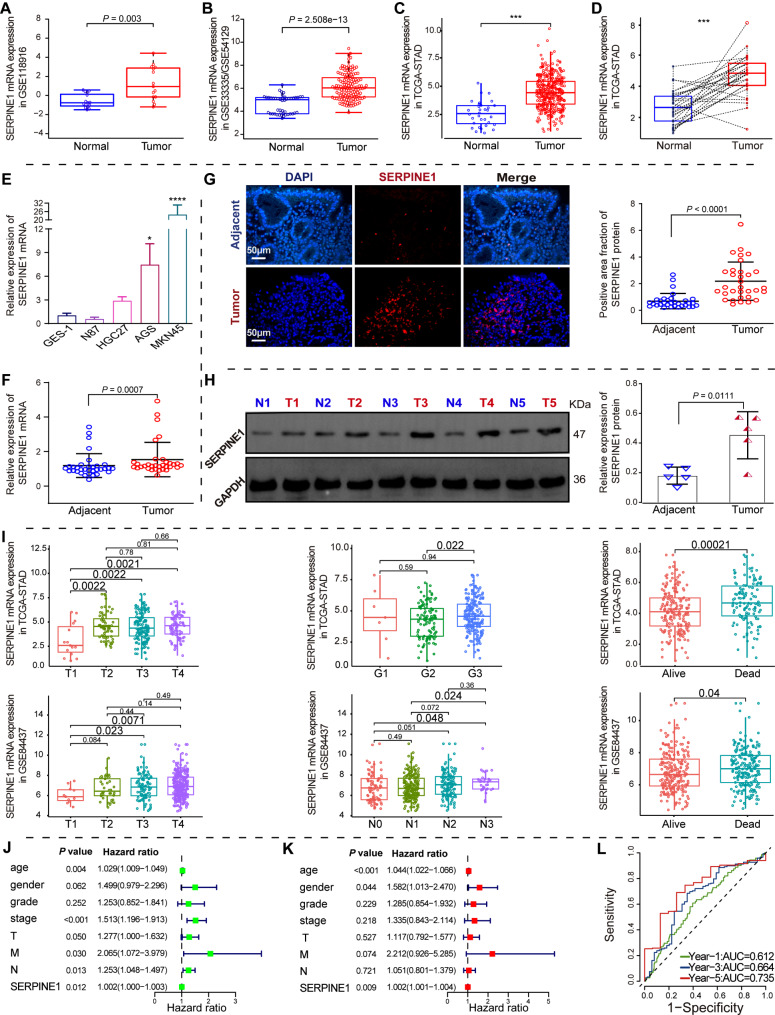
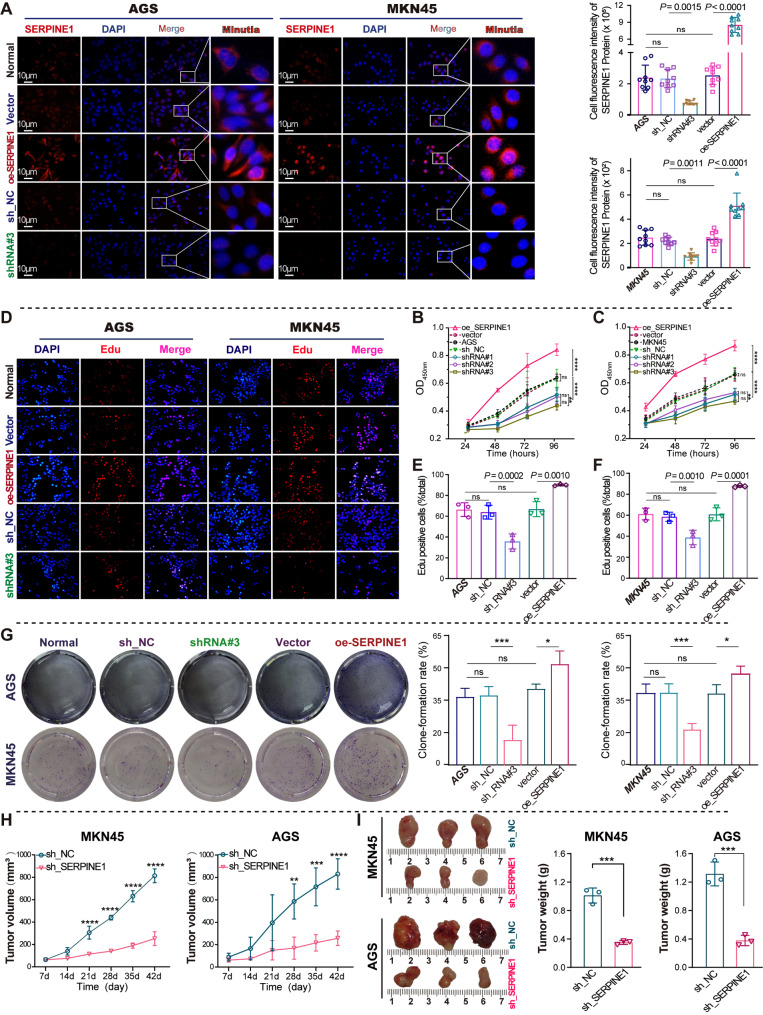
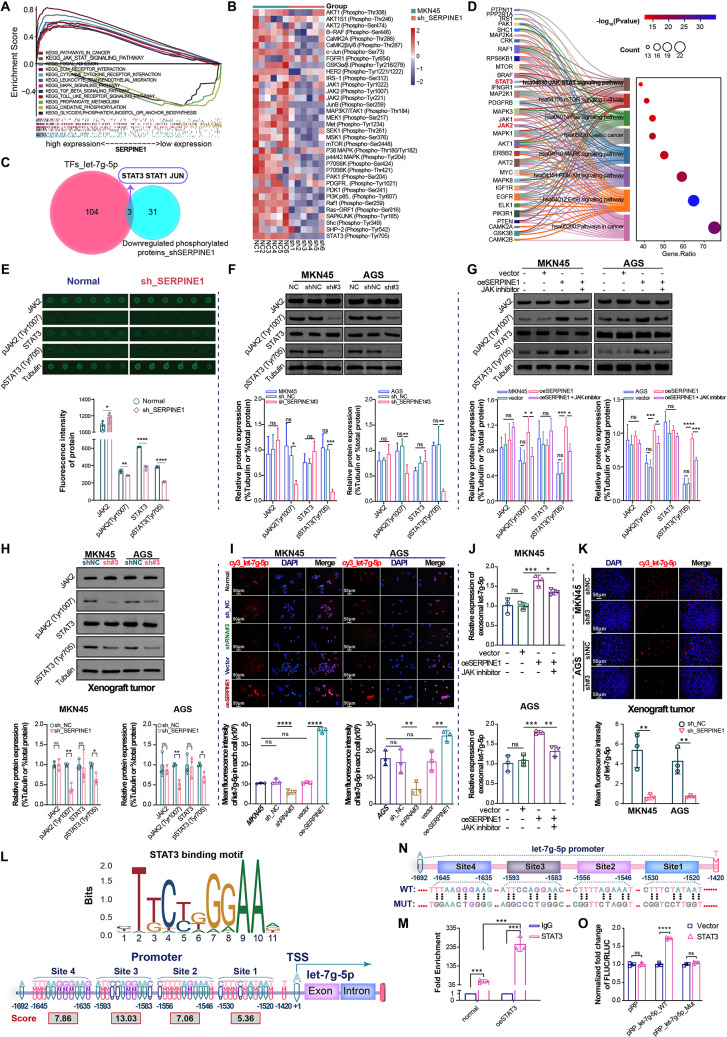
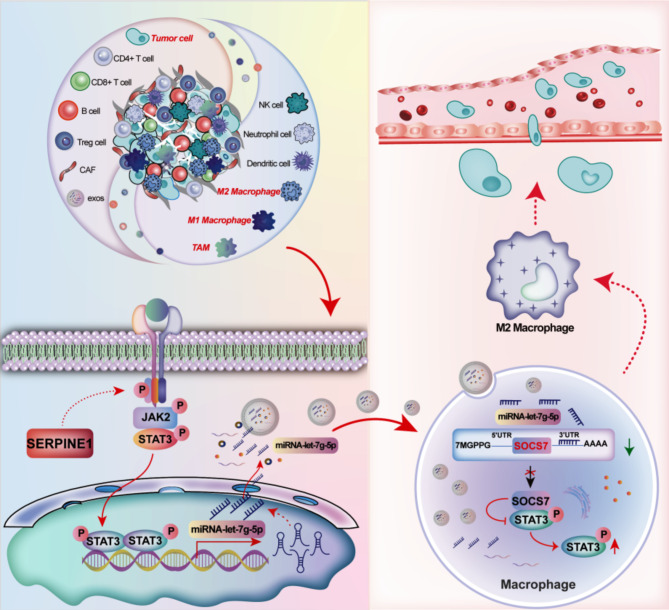
Results: SERPINE1 was identified as a highly expressed mRNA in GC tissues and cells, significantly associated with advanced clinical stages, worse prognosis, and higher M2 macrophage infiltration in patients with GC. SERPINE1 overexpression in GC cells promoted tumor growth and M2 macrophage polarization. SERPINE1 facilitated the transfer of let-7 g-5p to macrophages via cancer-derived exosomes, inducing M2 polarization. Exosomal let-7 g-5p internalized by macrophages downregulated SOCS7 protein levels, disrupting its interaction with STAT3 and relieving the inhibition of STAT3 phosphorylation, thereby leading to STAT3 hyperactivation, which consequently drove M2 polarization. Additionally, in GC cells, elevated SERPINE1 expression activated JAK2, enhancing STAT3 binding to the let-7 g-5p promoter and promoting its transcription, thereby increasing let-7 g-5p levels in exosomes.

Conclusion: GC cell-derived SERPINE1, functioning as a primary driver of GC growth and TAM M2 polarization, promotes M2 polarization through the regulation of exosomal let-7 g-5p transfer via autocrine activation of the JAK2/STAT3 signaling pathway. These findings elucidate a novel mechanism of SERPINE1-induced M2 polarization and highlight SERPINE1 as a promising target for advancing immunotherapy and targeted treatments in GC.

Keywords: SERPINE1/PAI-1; Cancer-derived exosome; Gastric cancer; M2 polarization; let-7 g-5p.


Conflict of interest statement

Declarations. Ethics approval and consent to participate: The Ethics Committee of The Second Hospital of Lanzhou University approved the study (No. 2024 A-662), with informed consent from all participants. Animal experiment was approved by Animal Ethics Committee of Gansu University of Chinese Medicine followed the guidelines for the Care and Use of Laboratory Animals (No. 2021-063). Consent for publication: All authors contributed significantly to the conception, design, execution, and interpretation of the research. They reviewed and approved the manuscript and agreed to be listed as co-authors. Competing interests: All authors declare no confict of interest.

Figures

Fig. 1
Fig. 1
Screening of genes associated with M2 macrophages and prognosis of GC. Volcano plots of differential mRNA expression in 16 GC patients (A) and TCGA-STAD cohort (B); red dots indicate upregulated genes, and green dots indicate downregulated genes. (C) Venn diagram of upregulated mRNAs in 16 GC patients and the TCGA-STAD cohort. (D) WGCNA cluster dendrogram and module assignment using a dynamic tree-cutting algorithm. (E) Correlation between module genes and immune cell infiltration. The abscissa represents different types of immune cell infiltration and the ordinate represents different modules. Each rectangle displayed the Pearson correlation coefficient. (F) Venn diagram of the upregulated mRNAs and M2-related yellow module mRNAs. (G and H) Heatmap of M2-related module-mRNA expression in 16 GC patients and the TCGA-STAD cohort. (I and J) Forest plots of univariate and multivariate Cox regression analysis of the M2-related module mRNAs. Kaplan-Meier cumulative survival curves for the combined analysis of SPARC (K) or SERPINE1 (L) expression and M2 macrophage infiltration in GC. (M) Differential analysis of immune stromal components between high- and low-SERPINE1 expression groups. (N) Correlation analysis of SERPINE1 expression and immune cells. (O) Differential analysis of immune cell infiltration between high- and low-SERPINE1 expression groups. (P) Correlation analysis of SERPINE1 expression and immune cell infiltration. (Q) Correlation analysis of SERPINE1 expression with immune checkpoint expression. (R) Immunofluorescence analysis of CD163 and SERPINE1 expression in 32 pairs of GC and non-GC tissue. (S) Difference of CD163-positive cell density between high and low SERPINE1-positive cell density groups. (T) Correlation analysis of CD163-positive and SERPINE1-positive cell densities in 32 GC tissues
Fig. 2
Fig. 2
High SERPINE1 expression in GC cells promotes macrophage M2 polarization. tSNE visualization of nine single-cell clusters partitioned by unsupervised cluster analysis, SERPINE1 expression of each single-cell, and SERPINE1 expression abundance of different single-cell clusters in the GSE134520 (AC) and GSE167297 (DF) datasets. (G) Flow cytometry analysis of the proportion of CD68+CD206+ macrophages in a Transwell co-culture system, with MKN45 and AGS cells overexpressing (oe_SERPINE1) or silencing SERPINE1 (shRNA#3 or sh_SERPINE1#3) in the upper chamber, and THP1 cells treated with PMA in the lower chamber. (H) Immunofluorescence staining of xenograft tumor tissues. Comparison of the proportion of M1 or M2 macrophage infiltration. Green indicates F4/80. Red indicates iNOS or Arg1 expression
Fig. 3
Fig. 3
Differential expression and prognosis analysis of SERPINE1. (AD) Differential expression of SERPINE1 mRNA in merged GSE33335/GSE54129 (A), GSE118916 (B), and TCGA-STAD (C and D) cohorts. (E) Differential SERPINE1 mRNA expression in GC and GES-1 cells. qRT-PCR (F), immunofluorescence (G), and western blotting (H) analysis of SERPINE1 mRNA and protein expression in GC and non-GC tissues. (I) Differential expression of SERPINE1 in GC patients with different clinical stages and survival statuses in TCGA-STAD cohorts and GSE84437 dataset. (JK) Forest plots of univariate and multivariate Cox regression analysis of GC prognosis. (L) Time-dependent ROC curves for OS at different time points to assess the predictive ability of SERPINE1 mRNA expression
Fig. 4
Fig. 4
SERPINE1 promotes GC cell proliferation in vitro and in vivo. (A) Immunofluorescence analysis of SERPINE1 protein cellular localization and expression in GC cells with SERPINE1 silencing and overexpression. (BG) Cell proliferation assays for GC cells with SERPINE1 silencing (sh_SERPINE1#3) and overexpression (oe_SERPINE1): CCK8 (B and C), EdU (DF), and colony formation assay (G). (H and I) Nude mice were observed 42 days after subcutaneous injection of MKN45/AGS cells with either silenced (shSERPINE1#3) or non-silenced SERPINE1 (shNC). (H) Growth curves of xenograft tumor volumes. (I) Comparison of tumor weights between shSERPINE1#3 and shNC groups
Fig. 5
Fig. 5
SERPINE1-mediated gastric cancer-derived exosomes facilitate the polarization of THP1 cells into M2 macrophages. (A) Schematic representation of the extraction and identification of exosomes and the induction of macrophage polarization. Transmission electron microscopy (B), nanoparticle tracking analysis (C), and western blotting (D) were used to identify the morphology, particle size, and markers of exosomes. (E) Confocal laser scanning microscopy detected Dil-labeled exosomes (red) internalized by DAPI-labeled macrophages (blue). (FG) Immunofluorescence analysis of the proportion of CD206+ cells in THP1 cells treated with exosomes. (HI) Flow cytometry analysis of the proportion of CD68+CD206+ cells in THP1 cells treated with exosomes. (JK) qRT-PCR analysis of M1 markers (iNOS and TNF-α) and M2 markers (TGF-β, IL-10, and Arg-1) in THP1 cells treated with exosomes. (LN) Transwell migration and invasion assays of GC cells (upper chamber) co-cultured with macrophages (lower chamber) ingesting exosomes
Fig. 6
Fig. 6
SERPINE1-mediated GC-derived exosomal let-7 g-5p facilitates macrophage M2 polarization through STAT3 hyperphosphorylation resulting from inhibition of SOCS7 interactions with STAT3. (A) Differential miRNA analysis of exosomes derived from MKN45 cells with stably silenced SERPINE1 and normal MKN45 cells using sRNA-Seq. N, normal group. sh, stably silenced SERPINE1. (B) Venn diagram of target genes predicted by miRDB, miRWalk, and miRTarBase for let-7 g-5p. (C) Network of target genes that interact with STAT3. (D) KEGG pathway analysis of the 78 target genes of let-7 g-5p using DAVID. (E) Schematic representation: exosomal let-7 g-5p ingested by macrophages inhibits SOCS7 interaction with STAT3, resulting in STAT3 hyperphosphorylation. (F) Flow cytometric assay of the impact of let-7 g-5p on M2 polarization induced by exosomes derived from GC cells. (G) Western blotting analysis for the levels of SOCS7 protein and STAT3 phosphorylation in macrophages treated with exosomes and antagomir-let-7 g-5p. (H and I) Endogenous CoIP assay for SOCS7 and STAT3 in macrophages ingesting exosomes derived from normal MKN45 cells. (J) Western blotting analysis of SOCS7 protein levels in xenograft tumors
Fig. 7
Fig. 7
SERPINE1 promotes exosomal let-7 g-5p expression through the JAK2/STAT3 pathway. (A) GSEA was conducted for SERPINE1 co-expressed genes using GSEA (version 4.1.0). (B) Heatmap of 35 phosphorylation sites of 34 STAT3 upstream proteins determined by the median fluorescent intensity of the protein array normalized using Grubb’s algorithm. (C) Venn diagram of 34 downregulated phosphorylated proteins in the silenced SERPINE1 group and 107 TFs targeting let-7 g-5p. (D) Bubble plot combined with Sankey diagram of enriched KEGG pathways for 32 of the 34 STAT3 upstream proteins. (E) Statistical analysis of normalized phospho- and nonphospho-fluorescent protein spots in protein arrays. Western blotting analysis of total protein and phosphorylation levels of JAK2/STAT3 in GC cells silencing SERPINE1 (F), overexpressing SERPINE1 or treated with a JAK inhibitor (G). (H) Western blotting analysis of JAK2/STAT3 and SOCS7 in xenograft tumors. (I) Representative FISH images and comparison of let-7 g-5p expression in GC cells. (J) qRT-PCR analysis of exosomal let-7 g-5p expression in GC cells. (K) Representative FISH images and comparison of let-7 g-5p expression in xenograft tissues. (L) STAT3-binding motif and sites in the let-7 g-5p promoter region predicted using the JASPR database. (M) ChIP-qPCR assay demonstrated that STAT3 interacted with the let-7 g-5p promoter (site position: -1666~-1483). (N) Dual-luciferase reporter gene assay for the let-7 g-5p promoter region (position: -1692~-1420). (O) Luciferase activity of wt- and mut- let-7 g-5p promoter in the presence of vector or oeSTAT3. Mut, mutated-type. WT, wild-type. Vector, negative control plasmid. oeSTAT3, STAT3 overexpression plasmid
Fig. 8
Fig. 8
Graphical summarization of the molecular mechanism of SERPINE1-mediated Gastric cancer-derived exosomes promoting macrophage M2 polarization

References

    1. Pei X, Zhang SL, Qiu BQ, et al. Cancer Cell secreted Legumain promotes gastric Cancer Resistance to Anti-PD-1 Immunotherapy by enhancing macrophage M2 polarization [J]. Pharmaceuticals (Basel). 2024;17(7):951. - DOI - PMC - PubMed
    1. Su P, Yu T, Zhang Y, et al. Upregulation of MELK promotes chemoresistance and induces macrophage M2 polarization via CSF-1/JAK2/STAT3 pathway in gastric cancer [J]. Cancer Cell Int. 2024;24(1):287. - DOI - PMC - PubMed
    1. Hu X, Ma Z, Xu B, et al. Glutamine metabolic microenvironment drives M2 macrophage polarization to mediate trastuzumab resistance in HER2-positive gastric cancer [J]. Cancer Commun (Lond). 2023;43(8):909–37. - DOI - PMC - PubMed
    1. Peranzoni E, Lemoine J, Vimeux L et al. Macrophages impede CD8 T cells from reaching tumor cells and limit the efficacy of anti–PD-1 treatment [J]. Proc Nat Acad Sci. 2018;115(17):E4041-E4050. - PMC - PubMed
    1. Mantovani A, Allavena P, Marchesi F, et al. Macrophages as tools and targets in cancer therapy [J]. Nat Rev Drug Discovery. 2022;21(11):799–820. - DOI - PMC - PubMed

MeSH terms

LinkOut - more resources