. 2025 Jan 2;24(1):2.
doi: 10.1186/s12943-024-02182-w.

Pan-cancer drivers of metastasis

Affiliations

Pan-cancer drivers of metastasis

Ryan Lusby et al. Mol Cancer. .

Abstract

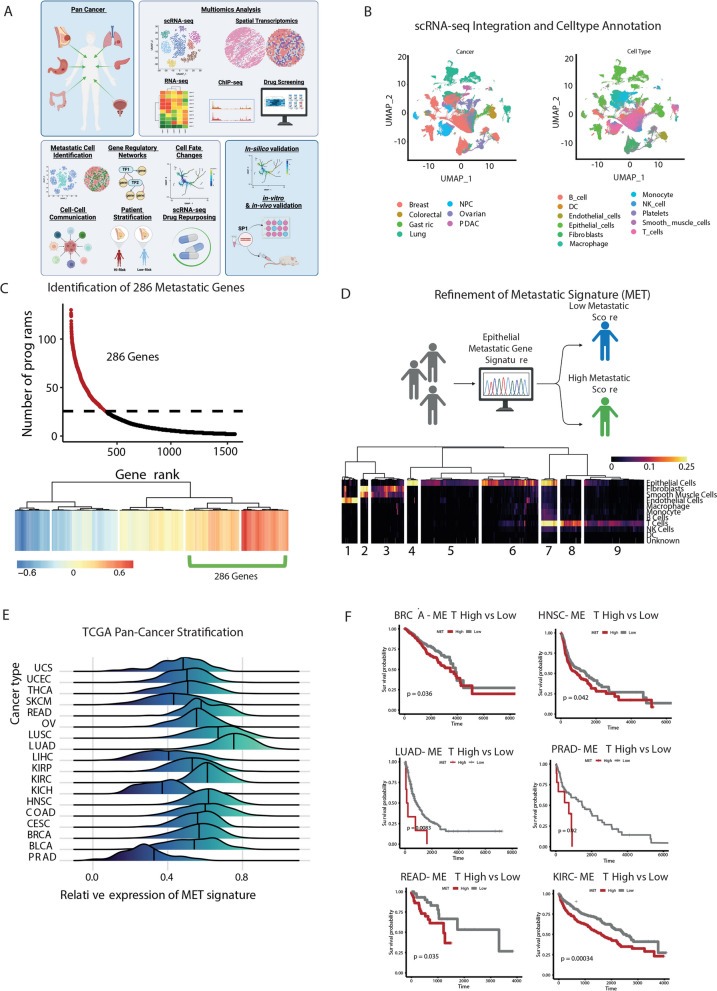
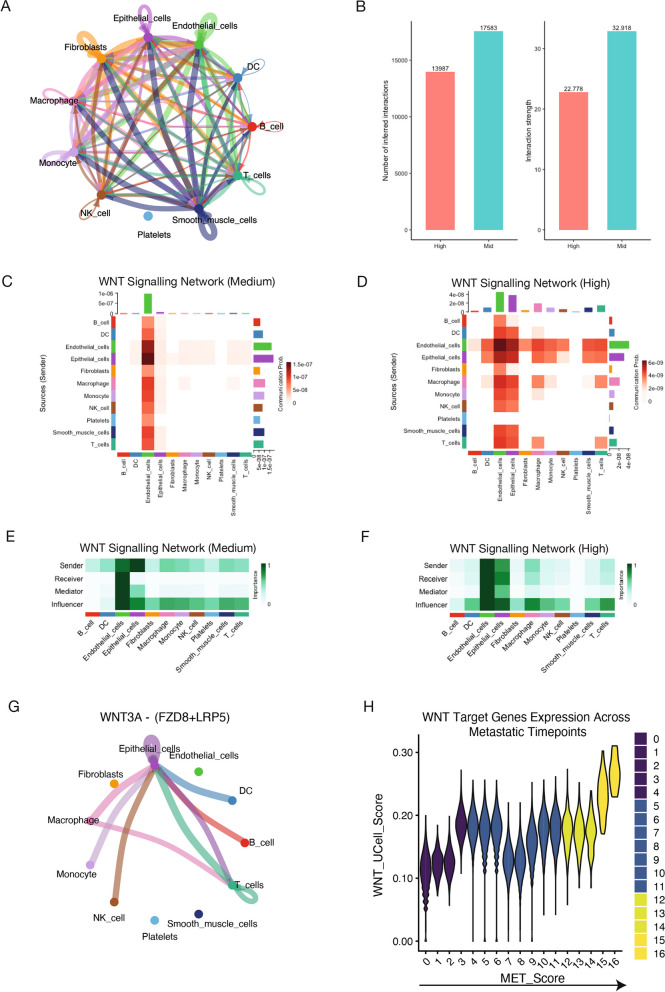
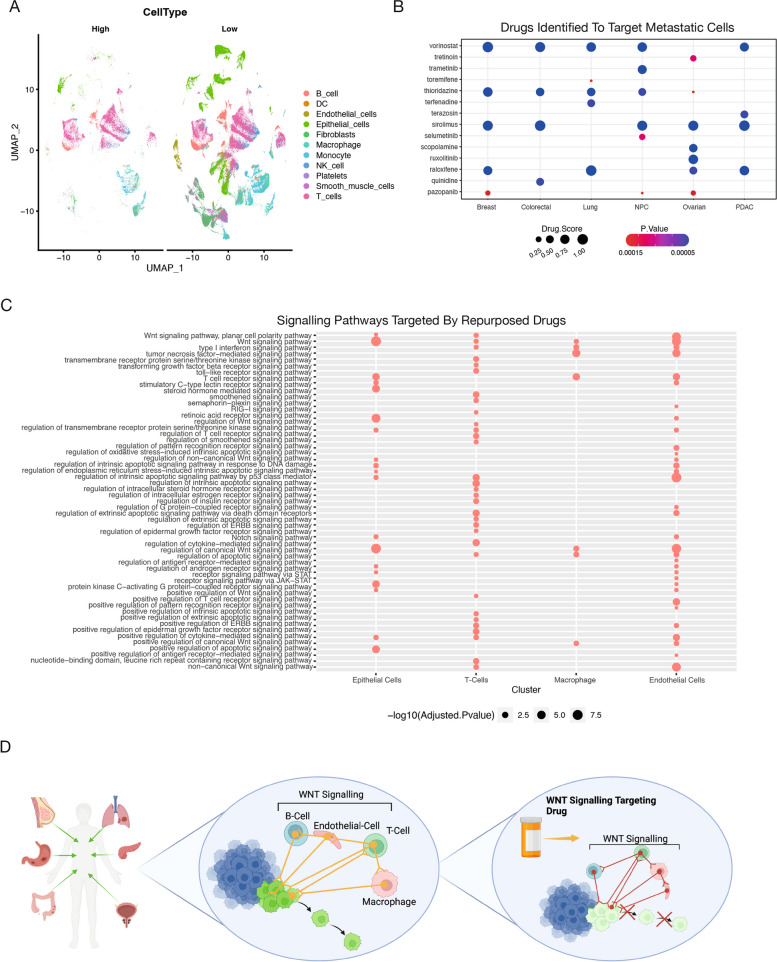
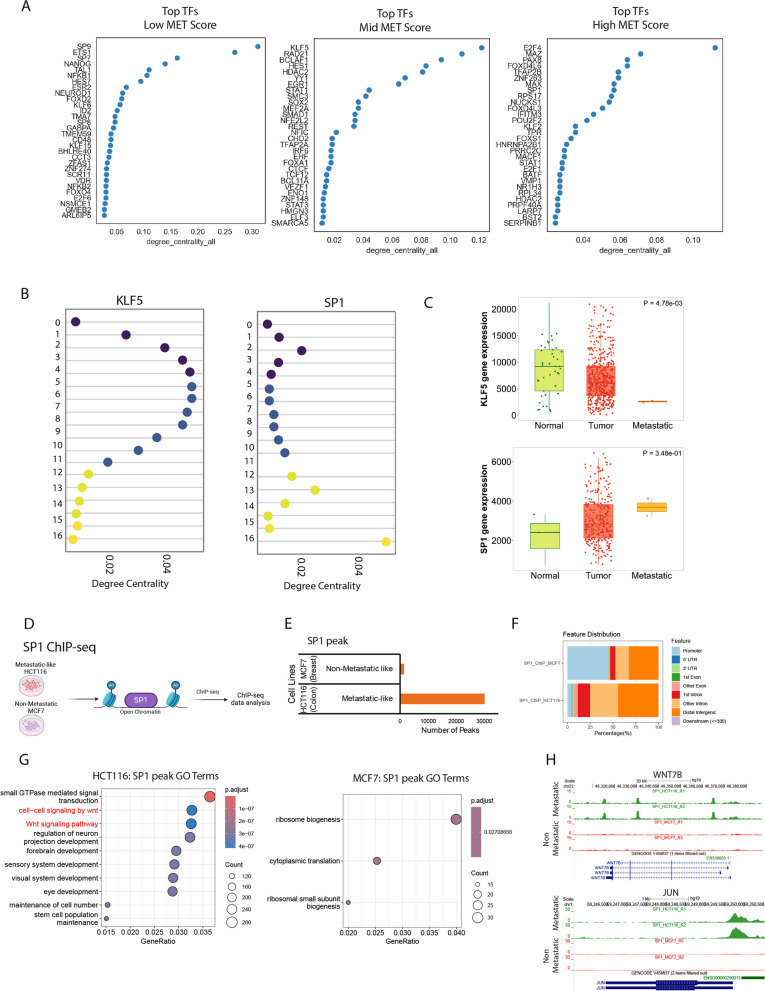
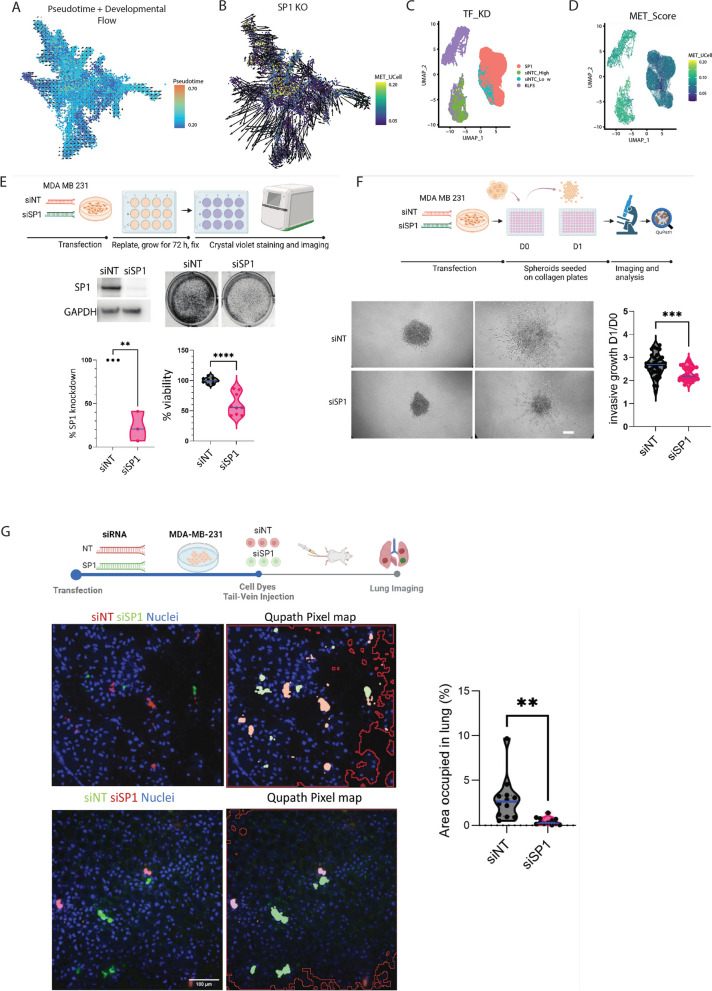
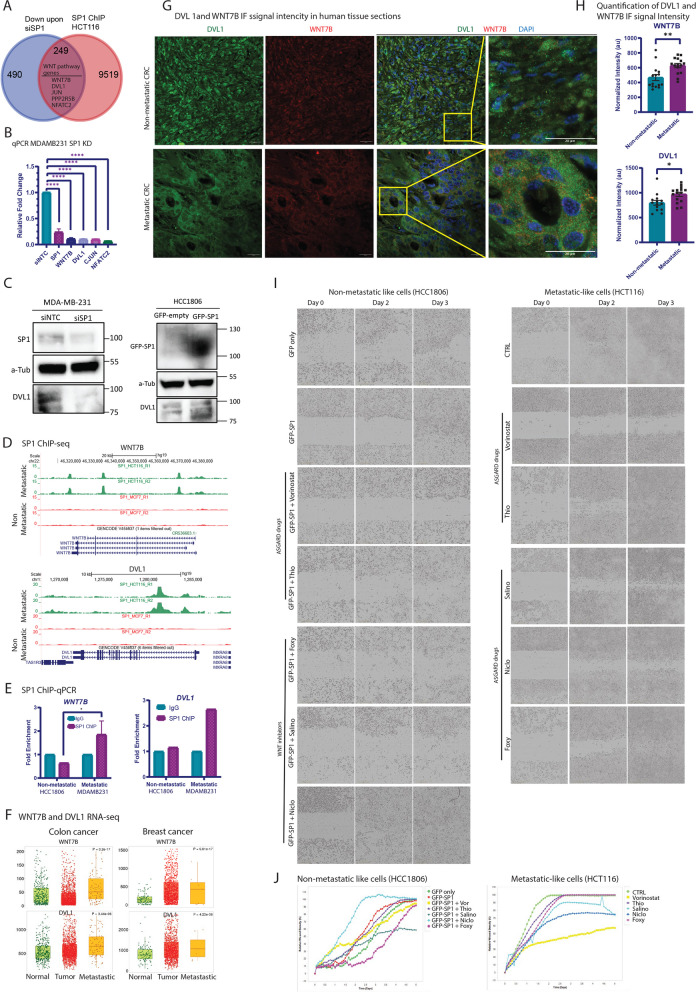
Metastasis remains a leading cause of cancer-related mortality, irrespective of the primary tumour origin. However, the core gene regulatory program governing distinct stages of metastasis across cancers remains poorly understood. We investigate this through single-cell transcriptome analysis encompassing over two hundred patients with metastatic and non-metastatic tumours across six cancer types. Our analysis revealed a prognostic core gene signature that provides insights into the intricate cellular dynamics and gene regulatory networks driving metastasis progression at the pan-cancer and single-cell level. Notably, the dissection of transcription factor networks active across different stages of metastasis, combined with functional perturbation, identified SP1 and KLF5 as key regulators, acting as drivers and suppressors of metastasis, respectively, at critical steps of this transition across multiple cancer types. Through in vivo and in vitro loss of function of SP1 in cancer cells, we revealed its role in driving cancer cell survival, invasive growth, and metastatic colonisation. Furthermore, tumour cells and the microenvironment increasingly engage in communication through WNT signalling as metastasis progresses, driven by SP1. Further validating these observations, a drug repurposing analysis identified distinct FDA-approved drugs with anti-metastasis properties, including inhibitors of WNT signalling across various cancers.

Keywords: Cancer; Gene regulation; Metastasis; Single-cell heterogeneity; Transcription Factors.


Conflict of interest statement

Declarations. Ethics approval and consent to participate: Not applicable. Competing interests: The authors declare no competing interests.

Figures

Fig. 1
Fig. 1
Defining the core transcriptional landscape driving pan-cancer metastasis. A Graphical overview of the study, highlighting the cancer types examined, the multi-omics data utilised, the in-silico analysis methods employed, and the validation approaches for in silico findings. B UMAP projection of pan-cancer single-cell RNA-seq (scRNA-seq) data, annotated by cancer types and cell types. C The top panel shows the number of programs associated with the expression of metastatic gene lists, while the bottom panel presents the clustering analysis of genes frequently associated with 25 or more programs across all samples, ranked by their association with the number of archetypes. D The top panel illustrates the aim to define a refined epithelial cell type–specific signature from 286 genes, and the bottom panel displays the cell type specificity scores of each metastatic gene across different cell types, with clusters annotated to highlight cluster-specific expression of the signature. E Metastatic scoring of each TCGA pan-cancer patient, stratifying them into high and low metastatic potential groups. F Kaplan–Meier survival plot of patients stratified by metastatic potential genes in the TCGA pan-cancer cohort
Fig. 2
Fig. 2
A refined metastatic signature uncovers the pan-cancer molecular landscape of metastatic cells. A UMAP projection of cells scored for metastatic potential from low to high using UCell. B Differential gene expression (DEG) analysis comparing cells with low versus high metastatic scores. C Gene Ontology (GO) terms associated with genes exhibiting higher expression in high metastatic potential cells. D Spatial transcriptomics plots illustrating tumour regions (indicated by black dashed lines) with metastatic scoring based on a 177-gene signature using UCell. (E) Expression patterns of the metastatic signature across stromal, tumour body, and invasive edge regions in spatial transcriptomics data. F GO terms enriched in genes with significantly higher expression in invasive edge clusters compared to the tumour body
Fig. 3
Fig. 3
Simulated cell fate mapping reveals metastatic cellular dynamics from low to high metastatic potential across cancers. (A) Force-directed graph of pan-cancer single-cell RNA-seq (scRNA-seq) data, with cells coloured based on their metastatic scores. (B) Metastatic transition matrix illustrating cellular dynamics transitioning from low to high metastatic potential. (C) Identification of genes driving cell fate progression in epithelial (blue) and fibroblast (yellow) lineages during the transition from low to high metastatic potential. (D) Expression levels of CTHRC1 and ANO3 in primary breast cancer compared to metastatic sites, as measured by RNA-sequencing (RNA-seq)
Fig. 4
Fig. 4
Refined metastatic signature can recapitulate the cascade of tumour migration. A Monocle 2 trajectory analysis of paired patient-derived xenograft (PDX) pancreatic ductal adenocarcinoma (PDAC) and liver metastasis cells, with cells coloured by site, pseudotime, and metastatic score using UCell. B Monocle 2 trajectory analysis of paired breast cancer and lymph node metastasis cells, similarly, coloured by site, pseudotime, and metastatic score using UCell. C Differential gene expression along pseudotime for the PDX PDAC and liver metastasis pair, quality of fitting is calculated using McFadden's Pseudo R2 D Differential gene expression along pseudotime for the breast cancer and lymph node metastasis pair, quality of fitting is calculated using McFadden's Pseudo R2 (E) Spatial transcriptomic profiling of a breast cancer patient, scored for metastatic potential using UCell. F Trajectory analysis of the breast cancer spatial transcriptomics data, highlighting genes that drive the observed cellular trajectories
Fig. 5
Fig. 5
Identification of WNT signalling as a key driver of communication networks in metastatic cells. A Total cell–cell interactions across different cell types in samples with high metastatic potential. B Comparison of the number of interactions between metastatic high and metastatic medium scored cells. C WNT signalling interactions among cell types in metastatic medium scored cells. D WNT signalling interactions among cell types in metastatic high scored cells. E Communication networks mediated by WNT signalling in metastatic medium scored cells. F Communication networks mediated by WNT signalling in metastatic high scored cells. G Top ligand interactions driving WNT signalling in metastatic high cells. (H) UCell scoring of WNT target genes across metastatic timepoints, highlighting gradual increases in expression and the implication of WNT signalling in metastatic cells
Fig. 6
Fig. 6
In silico drug repurposing analysis reveals FDA-approved drugs targeting metastatic cells. A UMAP projection of low and high metastatic cohorts, coloured by distinct cell types. B Drug repurposing strategy aimed at targeting metastatic cells. C Gene Ontology (GO) term analysis of cell type–specific genes targeted by the top three FDA-approved drugs. D Schematic illustrating the targeting of WNT signalling to disrupt cell–cell communication networks that drive metastatic progression
Fig. 7
Fig. 7
Reconstructing low to high metastatic regulatory networks conserved across cancers. A Transcription factors (TFs) within the gene regulatory network (GRN) associated with different metastatic stages. B Network dynamics of TFs across metastatic stages, coloured by MET_Score stage. C Expression levels of KLF5 and SP1 in normal, tumour, and metastatic samples, as measured by RNA sequencing (RNA-seq). D Genome browser tracks of SP1 ChIP-seq data, highlighting WNT target genes bound by SP1. D Schematic overview of the SP1 ChIP-seq data analysis. The SP1 ChIP-seq data were derived from ENCODE database for metastatic-like HCT116 and non-metastatic-like MCF7 cells and analysed using standard ChIP-seq analysis pipeline. E The barplot shows number of peaks detected for SP1 bound regions in HCT116 and MCF7 cells. F The barplot shows annotation of SP1 bound genes at promoter and non-promoter regions of the genome. G The dotplot represents top enriched pathways of SP1 bound genes in HCT116 and MCF7 cells. The top enriched pathways were derived using hallmark gene signatures from Molecular Signatures Database (MSigDB). H) The browser tracks show SP1 binding signal at hallmark WNT pathway genes
Fig. 8
Fig. 8
SP1 and KLF5 have opposing roles in the metastasis program. A Pseudotime calculation of cells, showing overlap with metastatic scoring and the transition from low to high metastatic potential cells. B In silico perturbation of SP1 alters the metastatic transition trajectory. C UMAP projections of MB231 (high metastatic) and HCC1806 (low metastatic) cells, coloured by transcription factor knockdown (TF KD) and non-targeting control (siNTC) cohorts. D UMAP projection with cells scored from low to high metastatic potential using UCell. E Representative immunoblotting images of SP1 knockdown and non-targeting control (NT) MDA-MB-231 cells (n = 4). F Representative Crystal Violet assay images for viability in SP1 knockdown and non-targeting control (NT) MDA-MB-231 cells (n = 4), with quantification of absorbance at 595 nm (right). G Representative images and quantitation of knockdown and control MDA-MB-231 spheroid growth embedded in Collagen-I at day 0 (D0) and day 1 (D1), scale bar = 50 μm (n = 3). H Schematic of lung colonisation assay using vital dye-stained SP1 knockdown (red) and control MDA-MB-231 cells (green) co-injected into the tail vein of NXG mice. Lungs were imaged 24 h post-injection, displaying representative images with a heatmap analysis using QuPath pixel mapping. Cell nuclei are stained with Hoechst 33,342. Quantitation of the area occupied by fluorescent cells in the lungs (%) for siNT and siSP1 MDA-MB-231 cells is shown (right). Scale bar = 100 μm. The same experiment was repeated with inverted vital dye colours (SP1 knockdown in green and NT controls in red) (n = 2). Violin plots display median (blue) with interquartile ranges. p-values were calculated using unpaired t-tests. All n numbers indicate independent experiments unless otherwise stated
Fig. 9
Fig. 9
Induction of WNT pathway genes by SP1 drives metastatic features. A Venn diagram shows overlap of SP1 bound genes with downregulated genes upon siSP1. The five genes shown inside the venn diagram are WNT pathway genes. B The bar graph shows relative qPCR fold change for the expression of GAPDH, SP1, WNT7B, DVL1, JUNC and NFATC2 upon SP1 knockdown in MDA-MB-231 cells. Each bar indicates the mean of replicate values. Error bar indicates SEM. For statistical analysis, student ‘s t-test is performed (* p < 0.05, *** p < 0.001). Gene expression was normalized to the corresponding expression of each gene upon siNTC control knockdown in MDA-MB-231. C Immunoblotting for SP1 knockdown in MDA-MB-231 (left plot) cells against SP1, a-Tubulin and DVL1. A-Tubulin served as a loading control. siNTC: siRNA for non-targeting control. The right plot showing Immunoblotting for GFP-SP1 overexpression in HCC1806 cells against GFP, a-Tubulin and DVL1. A-Tubulin served as a loading control. siNTC: siRNA for non-targeting control. D The browser tracks show SP1 binding signal at hallmark WNT pathway genes WNT7B and DVL1 in HCT116 and MCF7 cells. E ChIP-qPCR relative fold enrichment for SP1 binding at the promoter sites of WNT7B and DVL1. Each bar indicates the mean of replicate values. Error bar indicates SEM. For statistical analysis, student ‘s ttest is performed (* p < 0.05). IgG is used as a negative antibody control for ChIP. Non-metastatic: HCC1806 cells; metastatic: MDA-MB-231 cells. F The boxplot showing expression of WNT7B and DVL1 in normal, primary and metastatic tumors from colon and breast cancer patients. The expression levels were derived from TNMplot database. G Representative images of Immunofluorescent staining for non-metastatic and metastatic CRC human tissue section. DVL1 in green, WNT7B in red and DAPI in blue. Scale bar indicates 20 microns. Region of interest is marked in dashed yellow rectangle. H) Quantification of immunofluorescent signal intensity for WNT 7B and DVL1. Each bar represents the mean intensity. Error bars indicate SEM. Each dot represents the quantification value for each individual region. For statistical analysis, student ‘s t test was performed (* p < 0.05, ** p < 0.01). I Representative bright field images of incucyte experiment for SP1 overexpressing HCC180 and highly metastatic HCT116 cancer cells with and without treatment with the five selected drugs (vorinostat, Thiaridazine, Niclosamide, Salinomycin and Foxy 5 on Day 0, 2 and 3. J Quantification for the incucyte experiment coupled with all drug treatments shown in (I). Vor: vorinostat, Thio: thioridazine, Salino: salionomycin, Niclo: niclosamide, Foxy: Foxy-5

Similar articles

Cited by

References

    1. Parker AL, Benguigui M, Fornetti J, Goddard E, Lucotti S, Insua-Rodríguez J, et al. Current challenges in metastasis research and future innovation for clinical translation. Clin Exp Metastasis. 2022;39:263–77. - PMC - PubMed
    1. Broggio J, Bannister N. Cancer survival by stage at diagnosis for England. Newport, UK Off Natl Stat 2016.
    1. Chitty JL, Filipe EC, Lucas MC, Herrmann D, Cox TR, Timpson P. Recent advances in understanding the complexities of metastasis. F1000Research 2018; 7: 1169. - PMC - PubMed
    1. Fares J, Fares MY, Khachfe HH, Salhab HA, Fares Y. Molecular principles of metastasis: a hallmark of cancer revisited. Signal Transduct Target Ther. 2020;5:28. - PMC - PubMed
    1. Welch DR, Hurst DR. Defining the Hallmarks of Metastasis. Cancer Res. 2019;79:3011–27. - PMC - PubMed

MeSH terms

Substances

LinkOut - more resources