. 2025 Jan 2;23(1):1.
doi: 10.1186/s12967-024-06014-9.

FOSL1 transcriptionally dictates the Warburg effect and enhances chemoresistance in triple-negative breast cancer

Affiliations

FOSL1 transcriptionally dictates the Warburg effect and enhances chemoresistance in triple-negative breast cancer

Gang Zhao et al. J Transl Med. .

Abstract

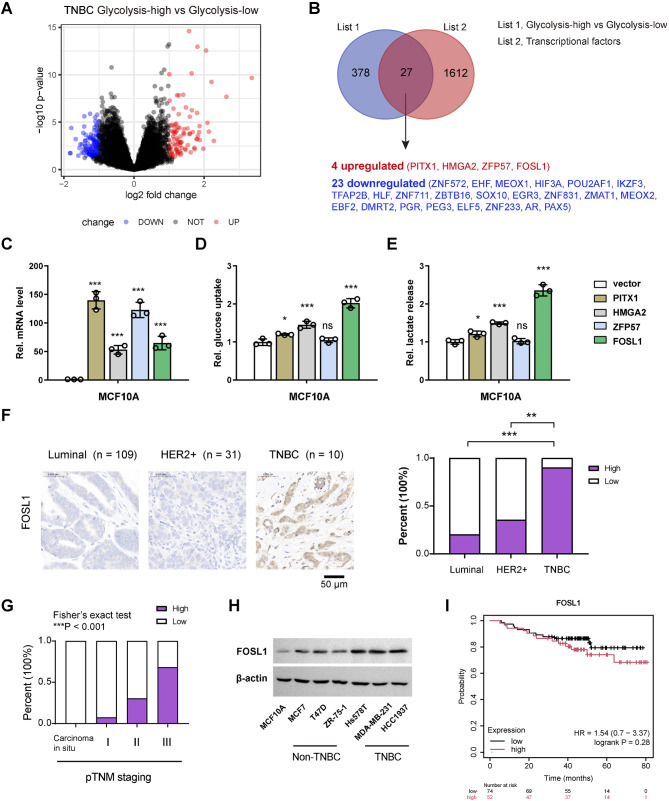
Background: Dysregulated energy metabolism has emerged as a defining hallmark of cancer, particularly evident in triple-negative breast cancer (TNBC). Distinct from other breast cancer subtypes, TNBC exhibits heightened glycolysis and aggressiveness. However, the transcriptional mechanisms of aerobic glycolysis in TNBC remains poorly understood.

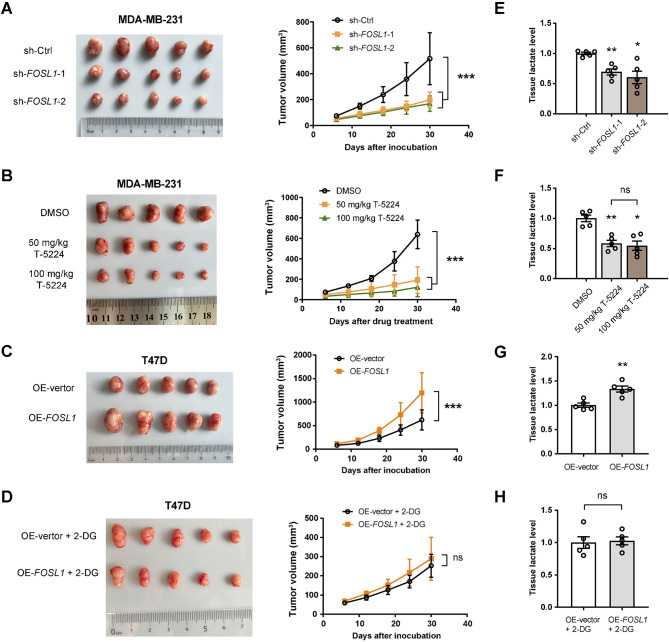
Methods: The Cancer Genome Atlas (TCGA) cohort was utilized to identify genes associated with glycolysis. The role of FOSL1 in glycolysis and tumor growth in TNBC cells was confirmed through both loss-of-function and gain-of-function experiments. The subcutaneous xenograft model was established to evaluate the therapeutic potential of targeting FOSL1 in TNBC. Additionally, chromatin immunoprecipitation and luciferase reporter assays were employed to investigate the transcriptional regulation of glycolytic genes mediated by FOSL1.

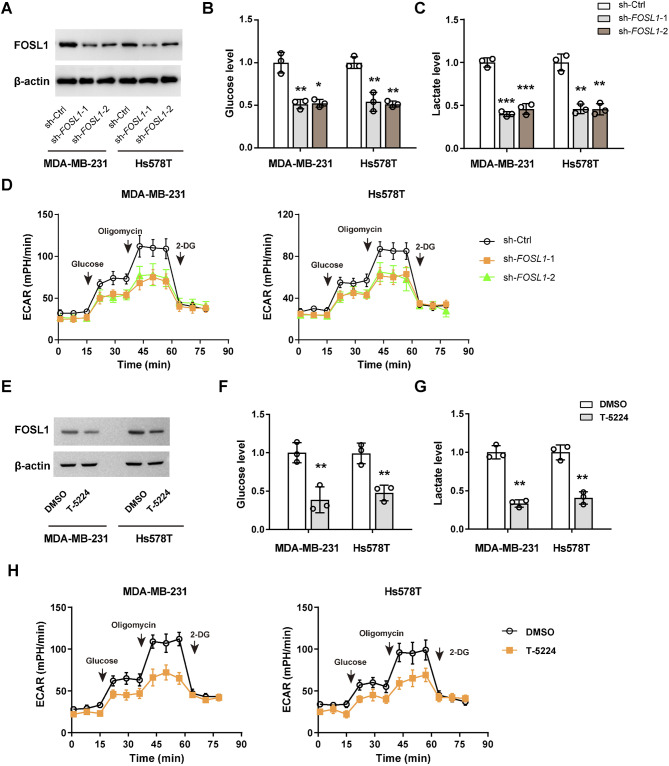
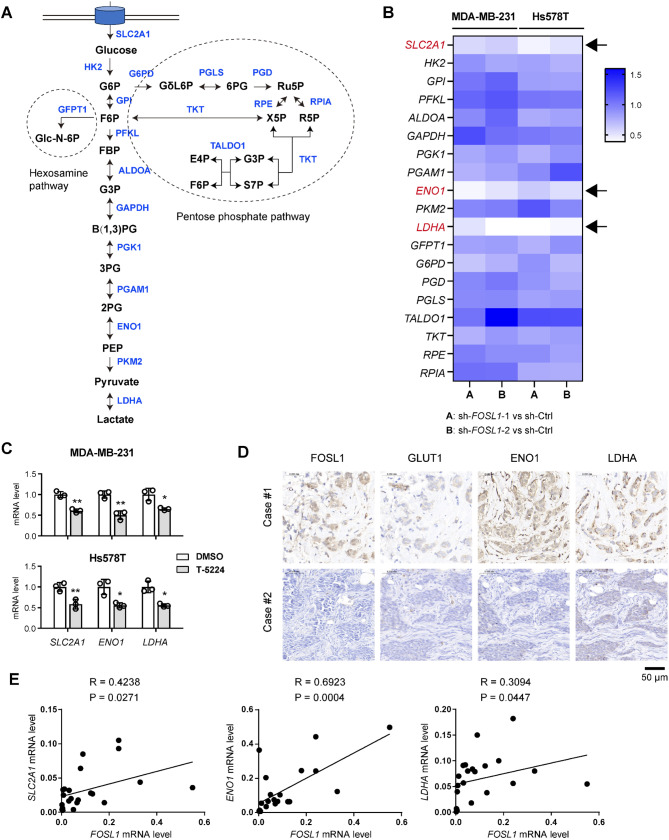
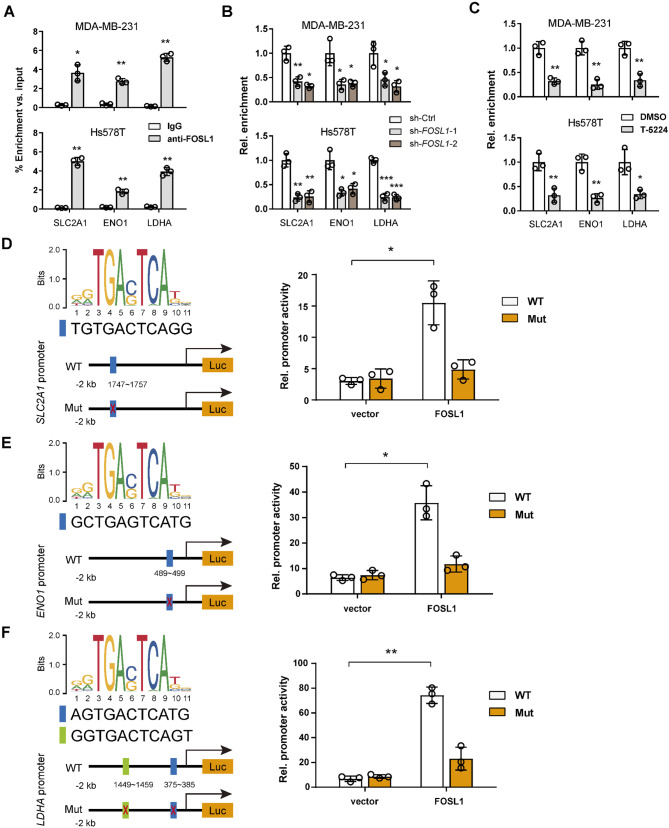
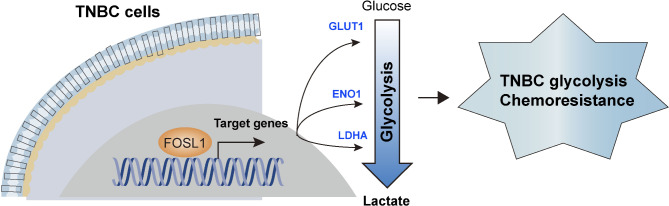
Results: FOSL1 is identified as a pivotal glycolysis-related transcription factor in TNBC. Functional verification shows that FOSL1 enhances the glycolytic metabolism of TNBC cells, as evidenced by glucose uptake, lactate production, and extracellular acidification rates. Notably, FOSL1 promotes tumor growth in TNBC in a glycolysis-dependent manner, as inhibiting glycolysis with 2-Deoxy-D-glucose markedly diminishes the oncogenic effects of FOSL1 in TNBC. Mechanistically, FOSL1 transcriptionally activates the expression of genes such as SLC2A1, ENO1, and LDHA, which further accelerate the glycolytic flux. Moreover, FOSL1 is highly expressed in doxorubicin (DOX)-resistant TNBC cells and clinical samples from cases of progressive disease following neoadjuvant chemotherapy. Targeting FOSL1 proves effective in overcoming chemoresistance in DOX-resistant MDA-MB-231 cells.

Conclusion: In summary, FOSL1 establishes a robust link between aerobic glycolysis and carcinogenesis, positioning it as a promising therapeutic target, especially in the context of TNBC chemotherapy.

Keywords: Drug resistance; Energy metabolism; Gene promoter; Glucose metabolism; Glucose transporter.


Conflict of interest statement

Declarations. Ethics approval and consent to participate: This study received approval from the Research Ethics Committee of The First Hospital of Jilin University. All patients involved in this study signed informed consent. Consent for publication: All authors agree to submit the article for publication. Competing interests: The authors declare that they have no competing interests.

Figures

Fig. 1
Fig. 1
Identification of glycolysis-associated TFs in TNBC. (A) Heatmap of differentially expressed genes related to TNBC glycolysis. (B) Venn diagram showing the 27 glycolysis-related IFs in TNBC. (C) Real-time qPCR analysis of the overexpression efficiency of PITX1, HMGA2, ZFP57, and FOSL1 in MCF-10 A cells. (D, E) The effects of PITX1, HMGA2, ZFP57, and FOSL1 overexpression on the glucose uptake (D) and lactate production (E) of MCF-10 A cells. (F) IHC analysis of FOSL1 expression levels in different breast cancer subtypes. Scale bar, 50 μm. (G) Analysis of FOSL1 immunostaining and the corresponding pTNM staging. (H) Western blotting analysis of FOSL1 protein in different breast cancer cell lines. Scale bar, 50 μm. (I) Kaplan-Meier curve analysis of the prognostic value of FOSL1 in TNBC. *P < 0.05, **P < 0.01, and ***P < 0.001
Fig. 2
Fig. 2
FOSL1 promotes aerobic glycolysis in TNBC cells. (A) Western blotting analysis showing the knockdown efficiency of FOSL1 in MDA-MB-231 and Hs578T cells. (B-D) Measurement of glucose uptake (B), lactate production (C), extracellular acidification rate (D), in sh-Ctrl and sh-FOSL1 MDA-MB-231 and Hs578T cells. (E) Western blotting analysis showing FOSL1 protein expression upon T-5224 treatment in MDA-MB-231 and Hs578T cells. (F-H) Measurement of glucose uptake (F), lactate production (G), extracellular acidification rate (H), in MDA-MB-231 and Hs578T cells upon T-5224 treatment. *P < 0.05, **P < 0.01, and ***P < 0.001
Fig. 3
Fig. 3
FOSL1 promotes TNBC growth in a glycolysis-dependent manner. (A) Xenograft tumor model showing the impact of FOSL1 knockdown on tumor growth, originating from MDA-MB-231 cells (n = 5 per group). (B) The growth curve of MDA-MB-231 tumors following treatment with 50 mg/kg or 100 mg/kg of T-5224 over a period of 30 days (n = 5 per group). (C) Xenograft tumor model showing the impact of FOSL1 overexpression on tumor growth, originating from T47D cells (n = 5 per group). (D) The impact of FOSL1 overexpression on the growth of T47D tumors when treated with 500 mg/kg of 2-DG. (E) Measurement of lactate levels in sh-Ctrl and sh-FOSL1 MDA-MB-231 tumor tissues. (F) Measurement of lactate levels in MDA-MB-231 tumors following treatment with T-5224. (G, H) Measurement of lactate levels in OE-vector and OE-FOSL1 T47D tumor tissues with (G) or without (H) 2-DG treatment. *P < 0.05 and **P < 0.01; ns, not significant
Fig. 4
Fig. 4
FOSL1 regulates the expression of glycolytic genes. (A) A schematic diagram showing the glycolysis pathway, hexosamine pathway, and pentose phosphate pathway. (B) Real-time qPCR analysis of the expression of genes involved in the glycolysis pathway (SLC2A1, HK2, GPI, PFKL, ALDOA, GAPDH, PGK1, PGAM1, ENO1, PKM2, and LDHA), hexosamine pathway (GFPT1), and pentose phosphate pathway (G6PD, PGD, PGLS, TALDO1, TKT, RPE, and RPIA) in sh-Ctrl and sh-FOSL1 MDA-MB-231 and Hs578T cells. (C) Real-time qPCR analysis of SLC2A1, ENO1, and LDHA gene expression in MDA-MB-231 and Hs578T cells following treatment with T-5224. (D) IHC analysis showed the expression correlation between FOSL1 and the glycolytic components (SLC2A1, ENO1, and LDHA). Scale bar, 50 μm. (E) Correlation analysis of FOSL1 expression with SLC2A1, ENO1, and LDHA in 22 TNBC samples. *P < 0.05 and **P < 0.01
Fig. 5
Fig. 5
FOSL1 transcriptionally induces SLC2A1, ENO1, and LDHA gene expression in TNBC cells. (A) ChIP-qPCR validation of the binding relationship between FOSL1 and the promoter regions of the SLC2A1, ENO1, and LDHA genes. Chromatin was immunoprecipitated using an anti-FOSL1 antibody or IgG, and the promoter binding sites of each gene for FOSL1 were amplified by quantitative PCR with specific primers. Normal rabbit IgG served as a negative control, while input samples underwent reverse transcription PCR as a positive control. (B, C) ChIP-qPCR showing that FOSL1 knockdown (B) or T-5224 treatment (C) reduced the recruitment of FOSL1 on the promoter regions of the SLC2A1, ENO1, and LDHA genes. (D-F) The predicted FOSL1-binding sites in the SLC2A1 promoter (D), ENO1 promoter (E), and LDHA promoter (F) were mutated to create mutant promoters, and the relative luciferase activity of WT or mutant promoters was determined in MCF-10 A cells transfected with vector control or FOSL1. *P < 0.05, **P < 0.01, and ***P < 0.001
Fig. 6
Fig. 6
Targeting FOSL1 increases chemotherapy sensitivity. (A) Cell viability test showing the inhibitory effects of DOX and DPP on sh-Ctrl and sh-FOSL1 MDA-MB-231 cells. (B) Cell viability test showing the impact of T-5224 on inhibitory effects of DOX and DPP on MDA-MB-231 cells. (C) Real-time qPCR and Western blotting analysis of FOSL1 mRNA and protein level in MDA-MB-231 DOX-resistant and -sensitive cells. (D) IHC analysis showing the expression levels of FOSL1 between samples classified as stable disease (complete or partial remission) and those categorized as progressive disease. Scale bar, 50 μm. (E) Cell viability test showing the impact of siRNA-mediated FOSL1 knockdown on inhibitory effects of DOX on MDA-MB-231-DR cells. (F) Cell viability test showing the impact of T-5224 on inhibitory effects of DOX on MDA-MB-231-DR cells. (G) Xenograft tumor model showing the impact of DOX and T-5224 on tumor growth, originating from MDA-MB-231-DR cells (n = 5 per group). *P < 0.05, **P < 0.01, and ***P < 0.001
Fig. 7
Fig. 7
Mechanism model. In TNBC, FOSL1 acts as a pivotal transcription factor that orchestrates glycolytic metabolism by transcriptionally activating SLC2A1, ENO1, and LDHA gene expression. This activation amplifies glycolytic flux, thereby fueling rapid tumor proliferation and fostering chemoresistance in TNBC cells

Similar articles

Cited by

References

    1. Derakhshan F, Reis JS. Pathogenesis of Triple-negative breast Cancer. Annual Rev Pathology-Mechanisms Disease. 2022;17:181–204. - PMC - PubMed
    1. Vitaliti A, Roccatani I, Iorio E, et al. AKT-driven epithelial-mesenchymal transition is affected by copper bioavailability in HER2 negative breast cancer cells via a LOXL2-independent mechanism. Cell Oncol. 2023;46:93–115. - PMC - PubMed
    1. Leon-Ferre RA, Goetz MP. Advances in systemic therapies for triple negative breast cancer. Bmj-British Med J 2023;381. - PubMed
    1. Chen CH, Huang YM, Grillet L, et al. Gallium maltolate shows synergism with cisplatin and activates nucleolar stress and ferroptosis in human breast carcinoma cells. Cell Oncol. 2023;46:1127–42. - PubMed
    1. Sharma P. Time to optimize deescalation strategies in Triple-negative breast Cancer? Clin Cancer Res. 2022;28:4840–2. - PubMed

MeSH terms

Substances

LinkOut - more resources