

Soft palate angle and basihyoid depth increase with tongue size and with body condition score in horses
- PMID: 39748477
- PMCID: PMC12135754
- DOI: 10.1111/evj.14445
Soft palate angle and basihyoid depth increase with tongue size and with body condition score in horses
Abstract
Background: Obesity has been associated with human obstructive sleep apnoea and canine brachycephalic obstructive airway syndrome. The effect of body condition score (BCS) on structures of the oropharynx, nasopharynx and upper airway of the horse has not been investigated.
Objectives: To investigate the effect of BCS on tongue measurements, soft palate angle and basihyoid depth in horses.
Study design: Retrospective, analytical, cross-sectional.
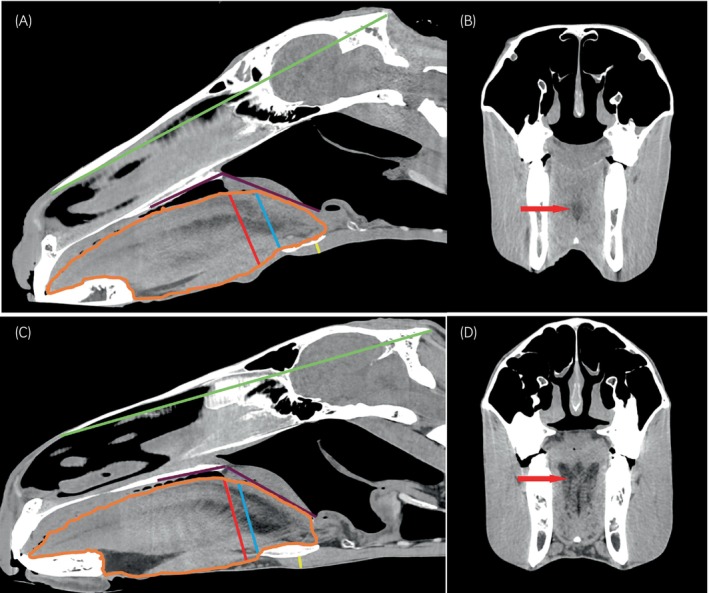
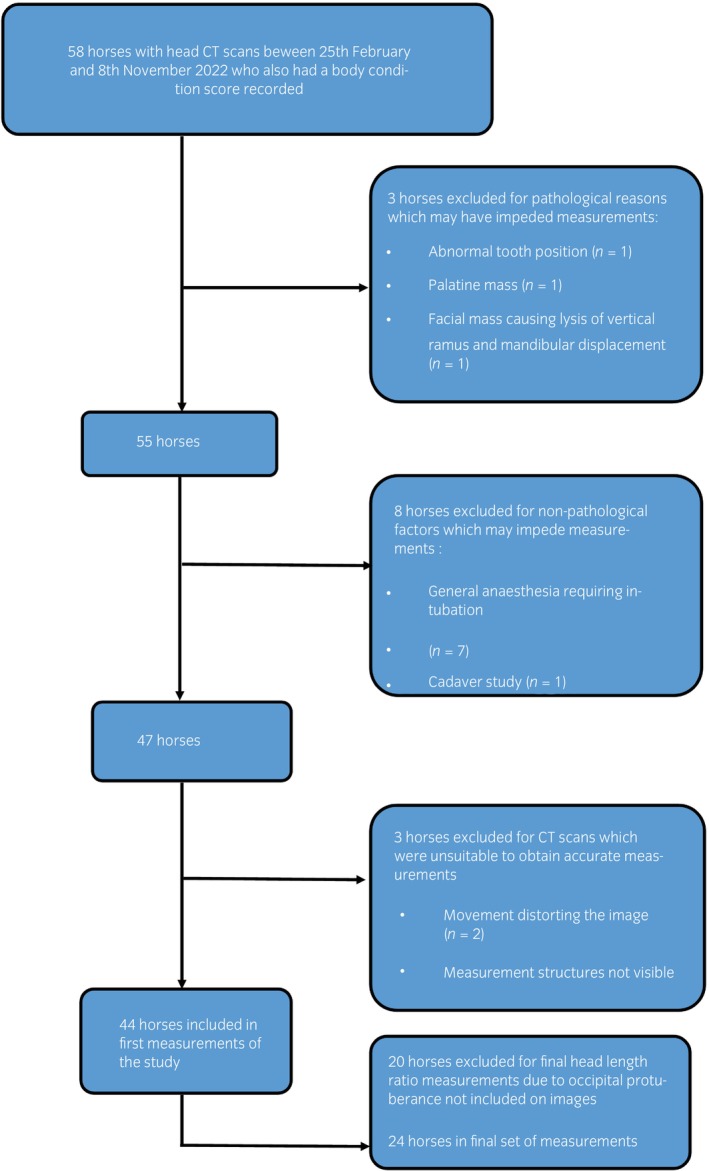
Methods: Computed tomographic (CT) images of the head of 58 horses were assessed. DICOM viewing software was used to measure head length, basihyoid-skin depth, soft palate angle (SPA), midline tongue area, dorsoventral height (DVH) of the tongue in two locations and head angle. BCS were assigned during CT examinations. Associations between measurements were tested and following initial calculations, further associations with tongue measurements as a ratio of head length were assessed.
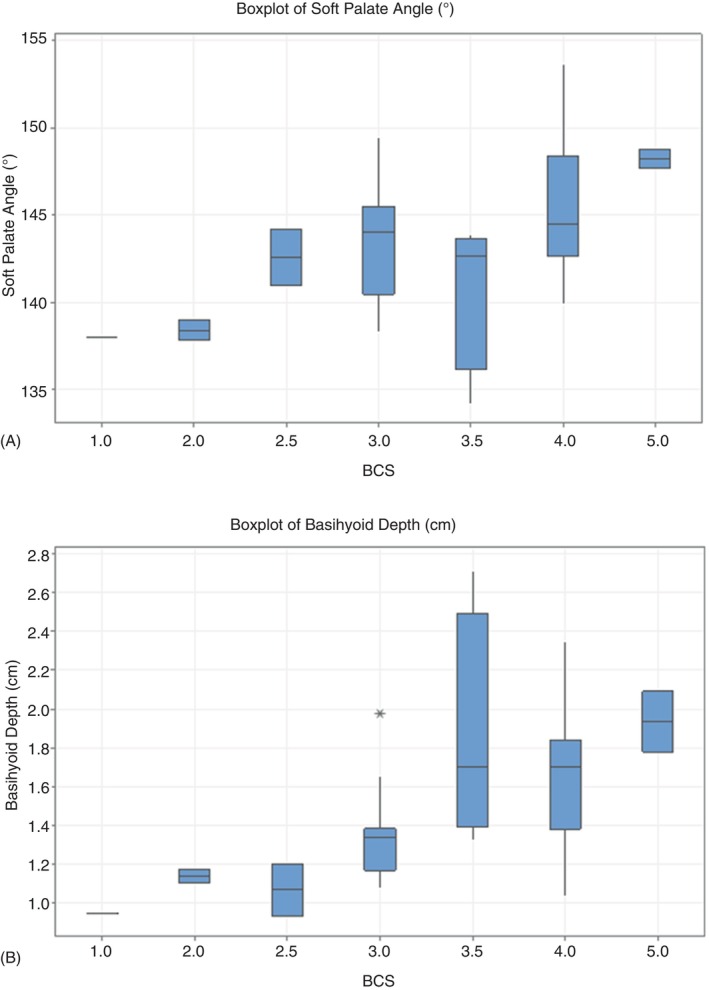
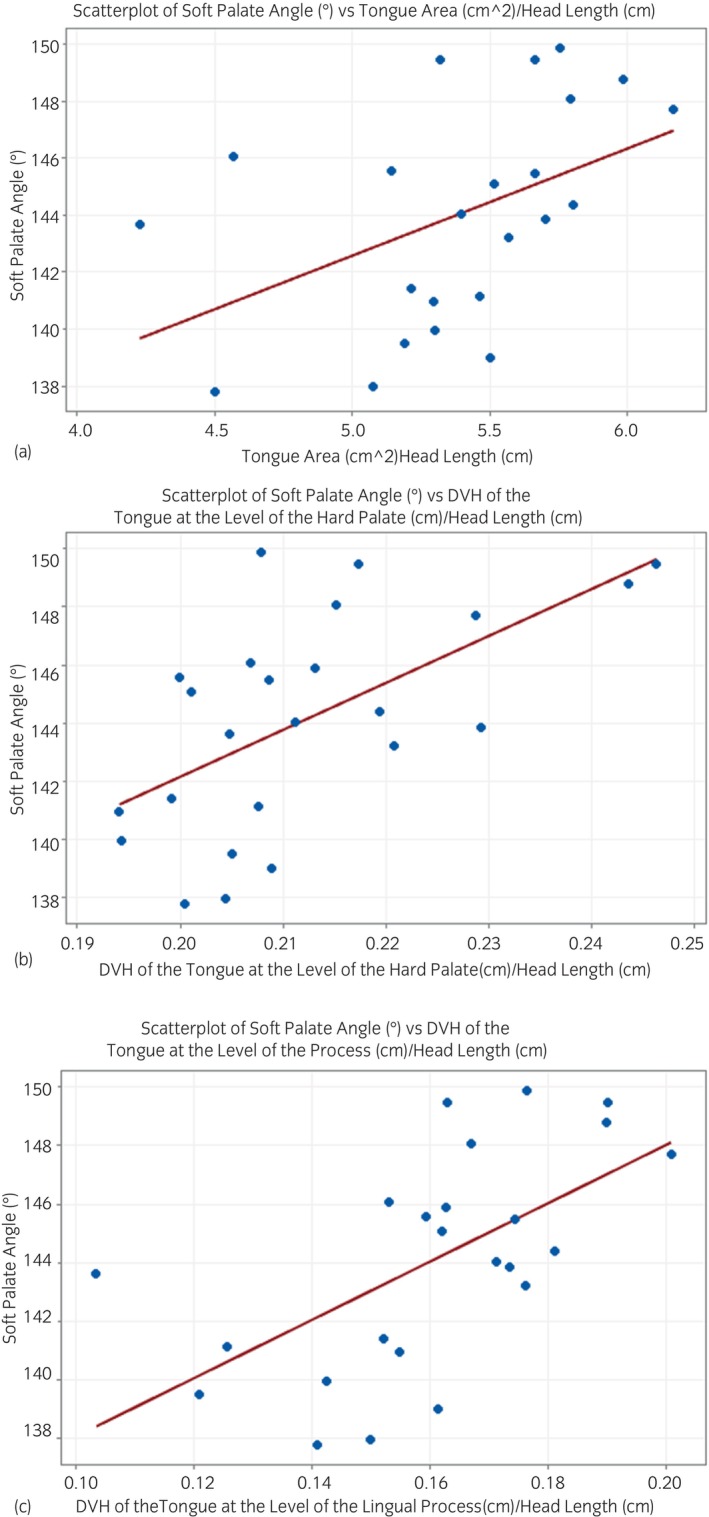
Results: For initial measurements, 44 horses met the inclusion criteria. Addition of head length ratios to tongue measurements resulted in 24 of 44 horses meeting the inclusion criteria for the second set of calculations. Increased BCS led to an increased mean SPA (mean difference = 2.56 ; p = 0.02) and increased median basihyoid depth (mean difference = 0.246 cm; p = 0.006). Following adjustments made for the effect of head length on tongue measures, significant correlation was identified between SPA and tongue area (Spearman's r = 0.544; p = 0.007); SPA and DVH of the tongue at the level of the hard palate (Spearman's r = 0.562; p = 0.004) and SPA and DVH of the tongue at the lingual process of the basihyoid bone (Spearman's r = 0.690; p < 0.001). No significant correlation was identified between variables and sex.
Main limitations: The sample size was small and the effect of breed on measures was not studied. Measurements were acquired on a single sagittal CT plane. The investigator collecting CT measures was not blinded to BCS. All horses were sedated for the CT procedure which may have affected measures obtained.
Conclusions: Increased BCS increases SPA and basihyoid bone depth. Increases in tongue size measurements increase SPA. Results from this study warrant further investigation into the clinical significance of the effects of BCS on the upper airways of the horse.
Keywords: basihyoid; body condition score; horse; obesity; soft palate; tongue.
© 2025 The Author(s). Equine Veterinary Journal published by John Wiley & Sons Ltd on behalf of EVJ Ltd.
Conflict of interest statement
The authors declare no conflicts of interest.
Figures
References
-
- Robin CA, Ireland JL, Wylie CE, Collins SN, Verheyen KLP, Newton JR. Prevalence of and risk factors for equine obesity in Great Britain based on owner‐reported body condition scores. Equine Vet J. 2015;47:196–201. - PubMed
-
- Treiber KH, Kronfeld DS, Hess TM, Byrd BM, Splan RK, Staniar WB. Evaluation of genetic and metabolic predispositions and nutritional risk factors for pasture‐associated laminitis in ponies. J Am Vet Med Assoc. 2006;228:1538–1545. - PubMed
-
- Schook M, Sessions‐Bresnahan D, Murphy B, Kennedy E, Reedy S, Fitzgerald B. Obesity is associated with altered metabolic and reproductive activity in the mare: effects of metformin on insulin sensitivity and reproductive cyclicity. Reprod Fertil Dev. 2006;18:609–617. - PubMed
-
- Rendle D, Mcgregor Argo C, Bowen M, Carslake H, German A, Harris P, et al. Equine obesity: current perspectives. UK‐Vet Equine. 2018;2:1–19. 10.12968/ukve.2018.2.S2.3 - DOI
MeSH terms
LinkOut - more resources
Full Text Sources
Miscellaneous
