. 2024 Dec 19:15:1499785.
doi: 10.3389/fpls.2024.1499785. eCollection 2024.

Revisiting the emerging pathosystem of rice sheath blight: deciphering the Rhizoctonia solani virulence, host range, and rice genotype-based resistance

Affiliations

Revisiting the emerging pathosystem of rice sheath blight: deciphering the Rhizoctonia solani virulence, host range, and rice genotype-based resistance

Zeinab A Kalboush et al. Front Plant Sci. .

Abstract

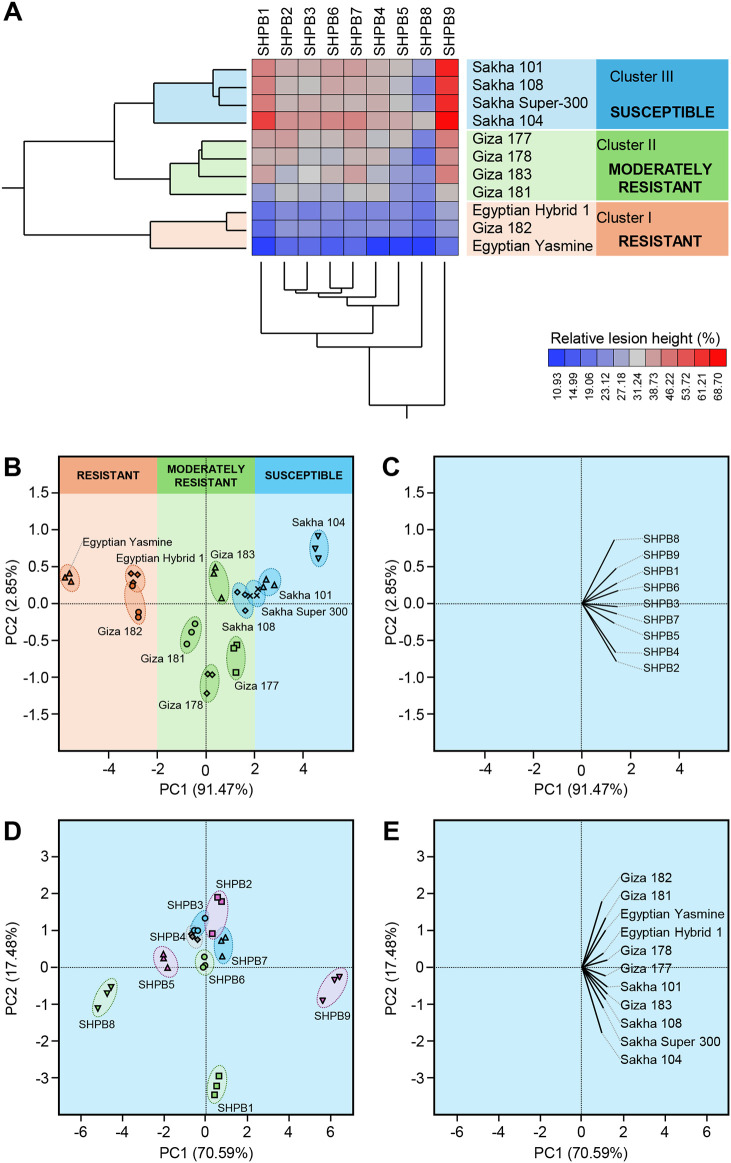
Sheath blight, caused by Rhizoctonia solani AG1 IA, is a challenging disease of rice worldwide. In the current study, nine R. solani isolates, within the anastomosis group AG-1 IA, were isolated, characterized based on their macroscopic and microscopic features, as well as their ability to produce cell wall degrading enzymes (CWDEs), and further molecularly identified via ITS sequencing. Although all isolates were pathogenic and produced typical sheath blight symptoms the susceptible rice cultivar, Sakha 101, R. solani AG1 IA -isolate SHBP9 was the most aggressive isolate. The virulence of isolate SHBP9 was correlated with its overproduction of CWDEs, where it had the highest pectinase, amylase, and cellulase activity in vitro. R. solani AG1 IA -isolate SHBP9 was able to infect 12 common rice-associated weeds from the family Poaceae, as well as over 25 economic crops from different families, except chickpea (Cicer arietinum) from Fabaceae, Rocket (Eruca sativa) from Brassicaceae, and the four crops from Solanaceae. Additionally, rice genotype-based resistance was evaluated using 11 rice genotypes for their response to R. solani isolates, morphological traits, yield components, and using 12 SSR markers linked to sheath blight resistance. Briefly, the tested 11 rice genotypes were divided into three groups; Cluster "I" included only two resistant genotypes (Egyptian Yasmine and Giza 182), Cluster "II" included four moderately resistant genotypes (Egyptian hybrid 1, Giza 178, 181, and 183), whereas Cluster "III" included five susceptible (Sakha 104, 101, 108, Super 300 and Giza 177). Correspondingly, only surface-mycelium growth was microscopically noticed on the resistant cultivar Egyptian Yasmine, as well as the moderately resistant Egyptian hybrid 1, however, on the susceptible Sakha 104, the observed mycelium was branched, shrunk, and formed sclerotia. Accordingly, Indica and Indica/Japonica rice genotypes showed more resistance to R. solani than Japonica genotypes. These findings provide insights into its pathogenicity mechanisms and identify potential targets for disease control which ultimately contributes to the development of sustainable eco-friendly disease management strategies. Moreover, our findings might pave the way for developing resistant rice varieties by using more reliable resistance sources of non-host plants, as well as, rice genotype-based resistance as a genetic resource.

Keywords: SSR marker; cell wall; host range; rhizoctonia; rice genotype; sheath blight; weeds.


Conflict of interest statement

The authors declare that the research was conducted in the absence of any commercial or financial relationships that could be construed as a potential conflict of interest.

Figures

Figure 1
Figure 1
The macroscopic and microscopic features, pathogenicity, and molecular identification of the phytopathogenic fungus Rhizoctonia solani, the causal agent of sheath blight disease on rice. (A) The growth and macroscopic features of the nine isolates of R. solani on potato dextrose agar (PDA) media after 10 days of incubation at 26 ± 2°C. (B) Microscopic characteristics and mycelium features of the nine isolates of R. solani. (C) The relative lesion height (%) of nine isolates of R. solani on susceptible rice cultivar Sakha 101 under greenhouse conditions. Bars denote the means ± standard deviations (means ± SD) of five biological replicates. Different letters signify statistically significant differences among isolates using the Tukey HSD test (p< 0.05). (D, E) The evolutionary analysis of only R. solani AG1 IA isolates SHBP 1-9 by themselves and in comparison with other 40 R. solani strains/isolates from different anastomosis groups (AGs) retrieved from the recent available data in National Center for Biotechnology Information (NCBI) GenBank (https://www.ncbi.nlm.nih.gov/). The evolutionary history was inferred using the Maximum Likelihood method and the Tamura-Nei model. The tree with the highest log likelihood ( (-1242.36 and -6738.22, respectively) is shown. The percentage of trees in which the associated taxa clustered together is shown next to the branches. The proportion of sites where at least 1 unambiguous base is present in at least 1 sequence for each descendent clade is shown next to each internal node in the tree. Analysis in panel D involved 9 nucleotide sequences with a total of 608 positions in the final dataset, whereas analysis in panel E involved 49 nucleotide sequences with a total of 694 positions in the final dataset. There were Evolutionary analyses were conducted in MEGA11.
Figure 2
Figure 2
In vitro production of cell wall degradation enzymes (CWDEs) by the phytopathogenic fungus Rhizoctonia solani, the causal agent of sheath blight disease on rice. (A) In-situ visualization of CWDEs production of the nine isolates of R. solani growing on a minimal inductive medium supplemented with plant-derived polysaccharides (e.g., pectin, starch, or carboxymethyl cellulose [CMC]) for 7 days at 26 ± 2°C. Congo red solution (0.3%) was used to visualize the degradation of pectin and CMC as a halo zone, whereas iodine solution was used for the degradation of starch. (B-D) Fungal linear growth (cm) of nine isolates of R. solani growing on a minimal inductive medium supplemented with pectin, starch, or CMC, respectively. (E-G) Relative gene expression of pectate lyase B (RsPLB), putative pectate lyase C (RsPLC), and polysaccharide lyase family 1 protein (RsPSL), respectively, of nine isolates of R. solani growing on inductive pectin-containing medium for 4 days at 26 ± 2°C. Bars represent the average of five biological replicates (n = 5), whereas whiskers represent the standard deviation (means ± SD). Different letters signify statistically significant differences among isolates using the Tukey HSD test (p< 0.05).
Figure 3
Figure 3
Two-way hierarchical cluster analysis (HCA) and Principal component analysis (PCA) of relative lesion height (%) of 11 commercial rice cultivars after the infection with individual Rhizoctonia solani AG1 IA Isolates (SHBP 1-9). (A) HCA-associated eat map and cluster dendrograms of relative lesion height (%) of 11 commercial rice cultivars after the infection with individual R. solani AG1 IA Isolates (SHBP 1-9). The differences in relative lesion height (%) are visualized in the heat map diagram. Isolates are presented in columns and rice cultivars are presented in rows. Isolates and cultivars are organized using two-way hierarchical cluster analysis based on similarities in auto-scaled values and correlations, respectively. Low relative lesion height (%) is colored blue, whereas higher relative lesion height (%) is colored red (see the scale at the right bottom corner of the graph). (B, D) PCA-associated scatter plots of rice cultivars and R. solani isolates, respectively, (C, E) PCA-associated loading plots of rice cultivars and R. solani isolates, respectively.
Figure 4
Figure 4
Symptoms’ development of sheath blight disease induced by Rhizoctonia solani AG1 IA - isolate SHBP9 on 12 common rice-associated weeds from Poaceae under greenhouse conditions.
Figure 5
Figure 5
Symptoms’ development of sheath blight disease and similar symptoms induced by Rhizoctonia solani AG1 IA - isolate SHBP9 on economic crops from different families under greenhouse conditions.
Figure 6
Figure 6
Symptoms’ development of sheath blight disease induced by Rhizoctonia solani AG1 IA - isolate SHBP9 on eleven rice genotypes under greenhouse conditions.
Figure 7
Figure 7
Sheath blight disease assessment of 11 rice genotypes at 30 days post inoculation (dpi) with Rhizoctonia solani under greenhouse conditions. (A) Relative lesion height (%), (B) Disease score, (C) percent disease index, and (D) sheath lesion area (cm2). Bars represent the average of three biological replicates (n = 3), whereas whiskers represent the standard deviation (means ± SD). Different letters signify statistically significant differences among rice cultivars using the Tukey HSD test (p< 0.05).
Figure 8
Figure 8
Performance and morphological traits of 11 rice genotypes with or without the infection with Rhizoctonia solani AG1 IA – isolate SHBP9 under greenhouse conditions. (A) plant height (cm), (B) number of tillers per plant, (C) stem diameter (mm), and (D) Flag leaf area (cm2). Bars represent the average of three biological replicates (n = 3), whereas whiskers represent the standard deviation (means ± SD). Different letters signify statistically significant differences among cultivars using the Tukey HSD test (p Infection × Genotype< 0.05).
Figure 9
Figure 9
Yield components of 11 rice genotypes with or without the infection with Rhizoctonia solani AG1 IA – isolate SHBP9 under greenhouse conditions. (A) Panicle length (cm), (B) Panicle weight (g), (C) 1000-grain weight (g), and (D) number of discolored grains. Bars represent the average of three biological replicates (n = 3), whereas whiskers represent the standard deviation (means ± SD). Different letters signify statistically significant differences among cultivars using the Tukey HSD test (p Infection × Genotype< 0.05).
Figure 10
Figure 10
Light microscopy analysis of the behavior and development of the mycelium of Rhizoctonia solani AG1 IA – isolate SHBP9 on the surface of infected sheaths of 11 rice genotypes with different degrees of susceptibility. (A) Typical mycelium of R. solani on the sheath surface of Giza 177 rice cultivar with flat mycelium growth and distribution with more branches, (B) Giza 178 cv increases the mycelium growth in the sheath surface and clamped with trichome, (C) Giza 181 more mycelium branching and formed to mycelium cushion, (D) Egyptian hybrid 1 only mycelium grows on the surface without branching, (E) Giza 182 only mycelium grows on the surface without branching, (F) Giza 183 more mycelium branching, (G) Egyptian Yasmine with aerial mycelium growth no branch, (H) Sakha 101 branching mycelium penetrated the stem and branched inside, then the mycelium shrank, (I, J) Sakha 104 converted to mycelium cushion and formed sclerotia, (K) Sakha 108 branching mycelium penetrated the stem and branched inside, then the mycelium shrank, (L) Sakha super 300 branching mycelium penetrated the stem and branched inside, then the mycelium shrank. Arrows indicate the mycelium branching.
Figure 11
Figure 11
Diversity Analysis of 11 rice genotypes with different degrees of susceptibility based on 12 SSR Markers. (A) Representative gel images and banding patterns of 12 SSR markers (RM202, RM224, RM16, RM279, RM426, RM6971, RM518, RM570, RM178, RM251, RM335, and RM257) linked to sheath blight resistance in rice. Lane M represents the standard DNA ladder, whereas lanes 1–11 represent rice genotypes (Giza177, Giza178, Egyptian Hybrid 1, Giza181, Giza182, Giza183, Egyptian Yasmine, Sakha101, Sakha104, Sakha108, and Sakha Super 300, respectively). (B) Dendrogram derived from UPGMA cluster analysis of 11 rice genotypes.

Similar articles

References

    1. Ahvenniemi P., Wolf M., Lehtonen M. J., Wilson P., German-Kinnari M., Valkonen J. P. (2009). Evolutionary diversification indicated by compensatory base changes in ITS2 secondary structures in a complex fungal species, Rhizoctonia solani . J. Mol. Evol. 69, 150–163. doi: 10.1007/s00239-009-9260-3 - DOI - PubMed
    1. Ajayi-Oyetunde O. O., Bradley C. A. (2018). Rhizoctonia solani: taxonomy, population biology and management of Rhizoctonia seedling disease of soybean. Plant Pathol. 67, 3–17. doi: 10.1111/ppa.12733 - DOI
    1. Altschul S. F., Madden T. L., Schäffer A. A., Zhang J., Zhang Z., Miller W., et al. . (1997). Gapped BLAST and PSI-BLAST: a new generation of protein database search programs. Nucleic Acids Res. 25, 3389–3402. doi: 10.1093/nar/25.17.3389 - DOI - PMC - PubMed
    1. Anand P., Alwin A., Vennison S. J., Sankar S. G., Gilwax Prabhu D. I., Vasan P. T., et al. . (2010). Isolation and characterization of bacteria from the gut of Bombyx mori that degrade cellulose, xylan, pectin and starch and their impact on digestion. J. Insect Sci. 10, 107. doi: 10.1673/031.010.10701 - DOI - PMC - PubMed
    1. Atallah O. O., Hassanin A., Yassin S. M., Aloufi A. S., Almanzalawi E. A., Abdelkhalek A., et al. . (2024). Pathological characterization and management of Lasiodiplodia theobromae, a hemi-biotroph with an interkingdom host range. Plant Dis. 108, 3243–3257. doi: 10.1094/PDIS-03-24-0713-RE - DOI - PubMed

LinkOut - more resources