

Comparing newly developed SNP barcode panels with microsatellites to explore population genetics of malaria parasites in the Peruvian Amazon
- PMID: 39748949
- PMCID: PMC11693692
- DOI: 10.3389/fgene.2024.1488109
Comparing newly developed SNP barcode panels with microsatellites to explore population genetics of malaria parasites in the Peruvian Amazon
Abstract
Introduction: Malaria molecular surveillance (MMS) can provide insights into transmission dynamics, guiding national control programs. We previously designed AmpliSeq assays for MMS, which include different traits of interest (resistance markers and pfhrp2/3 deletions), and SNP barcodes to provide population genetics estimates of Plasmodium vivax and Plasmodium falciparum parasites in the Peruvian Amazon. The present study compares the genetic resolution of the barcodes in the AmpliSeq assays with widely used microsatellite (MS) panels to investigate population genetics of Amazonian malaria parasites.
Methods: We analyzed 51 P. vivax and 80 P. falciparum samples from three distinct areas in the Loreto region of the Peruvian Amazon: Nueva Jerusalén (NJ), Mazan (MZ), and Santa Emilia (SE). Population genetics estimates and costs were compared using the SNP barcodes (P. vivax: 40 SNPs and P. falciparum: 28 SNPs) and MS panels (P. vivax: 16 MS and P. falciparum: 7 MS).
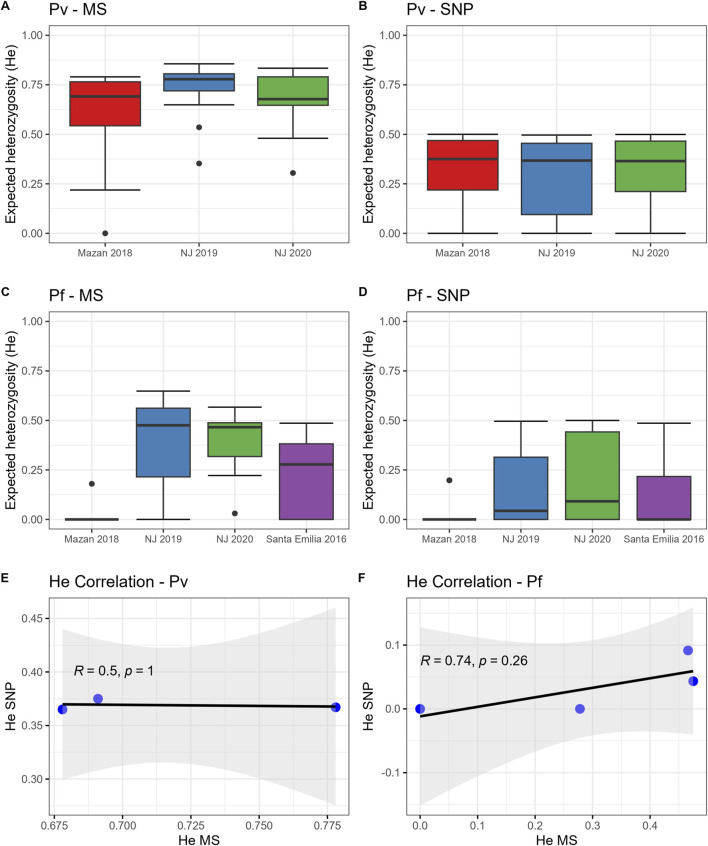
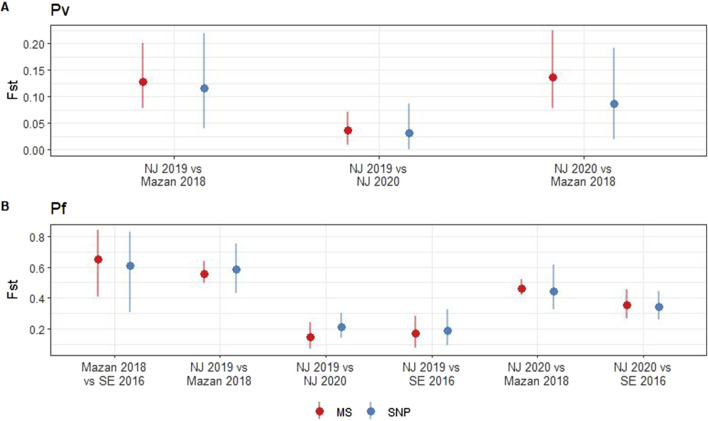
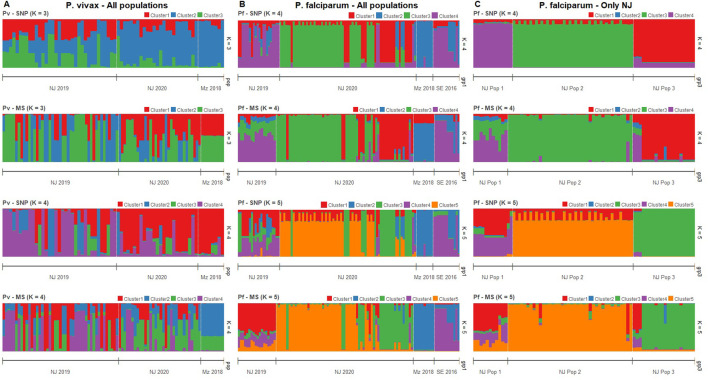
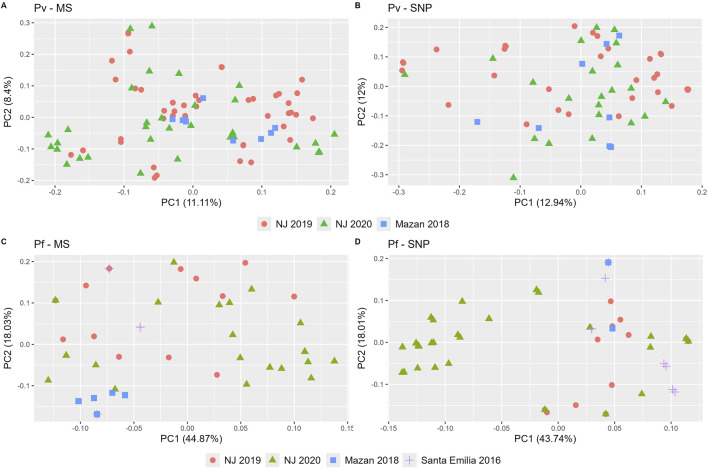
Results: The P. vivax genetic diversity (expected heterozygosity, He) trends were similar for both markers: He MS = 0.68-0.78 (p > 0.05) and He SNP = 0.36-0.38 (p > 0.05). P. vivax pairwise genetic differentiation (fixation index, FST) was also comparable: FST-MS = 0.04-0.14 and FST-SNP = 0.03-0.12 (pairwise p > 0.05). In addition, P. falciparum genetic diversity trends (He MS = 0-0.48, p < 0.05; He SNP = 0-0.09, p < 0.05) and pairwise FST comparisons (FST-MS = 0.14-0.65, FST-SNP = 0.19-0.61, pairwise p > 0.05) were concordant between both panels. For P. vivax, no geographic clustering was observed with any panel, whereas for P. falciparum, similar population structure clustering was observed with both markers, assigning most parasites from NJ to a distinct subpopulation from MZ and SE. We found significant differences in detecting polyclonal infections: for P. vivax, MS identified a higher proportion of polyclonal infections than SNP (69% vs. 33%, p = 3.3 × 10⁻⁵), while for P. falciparum, SNP and MS detected similar rates (46% vs. 31%, p = 0.21). The AmpliSeq assay had a higher estimated per-sample cost compared to MS ($183 vs. $27-49).
Discussion: The SNP barcodes in the AmpliSeq assays offered comparable results to MS for investigating population genetics in P. vivax and P. falciparum populations, despite some discrepancies in determining polyclonality. Given both panels have their respective advantages and limitations, the choice between both should be guided by research objectives, costs, and resource availability.
Keywords: AmpliSeq; NGS; SNP; malaria molecular surveillance; microsatellites; population genetics; population structure.
Copyright © 2024 Cabrera-Sosa, Safarpour, Kattenberg, Ramirez, Vinetz, Rosanas-Urgell, Gamboa and Delgado-Ratto.
Conflict of interest statement
The authors declare that the research was conducted in the absence of any commercial or financial relationships that could be construed as a potential conflict of interest.
Figures
Update of
-
Comparing newly developed SNP barcode panels with microsatellites to explore population genetics of malaria parasites in the Peruvian Amazon.bioRxiv [Preprint]. 2024 Sep 9:2024.09.09.611954. doi: 10.1101/2024.09.09.611954. bioRxiv. 2024. Update in: Front Genet. 2024 Dec 19;15:1488109. doi: 10.3389/fgene.2024.1488109. PMID: 39314390 Free PMC article. Updated. Preprint.
Similar articles
-
Comparing newly developed SNP barcode panels with microsatellites to explore population genetics of malaria parasites in the Peruvian Amazon.bioRxiv [Preprint]. 2024 Sep 9:2024.09.09.611954. doi: 10.1101/2024.09.09.611954. bioRxiv. 2024. Update in: Front Genet. 2024 Dec 19;15:1488109. doi: 10.3389/fgene.2024.1488109. PMID: 39314390 Free PMC article. Updated. Preprint.
-
Genomic surveillance of malaria parasites in an indigenous community in the Peruvian Amazon.Sci Rep. 2024 Jul 15;14(1):16291. doi: 10.1038/s41598-024-66925-x. Sci Rep. 2024. PMID: 39009685 Free PMC article.
-
Genomic surveillance of malaria parasites in an indigenous community in the Peruvian Amazon.Res Sq [Preprint]. 2024 Feb 29:rs.3.rs-3979991. doi: 10.21203/rs.3.rs-3979991/v1. Res Sq. 2024. Update in: Sci Rep. 2024 Jul 15;14(1):16291. doi: 10.1038/s41598-024-66925-x. PMID: 38464169 Free PMC article. Updated. Preprint.
-
SNP barcodes provide higher resolution than microsatellite markers to measure Plasmodium vivax population genetics.Malar J. 2020 Oct 20;19(1):375. doi: 10.1186/s12936-020-03440-0. Malar J. 2020. PMID: 33081815 Free PMC article.
-
Uncovering the transmission dynamics of Plasmodium vivax using population genetics.Pathog Glob Health. 2015 May;109(3):142-52. doi: 10.1179/2047773215Y.0000000012. Epub 2015 Apr 18. Pathog Glob Health. 2015. PMID: 25891915 Free PMC article. Review.
References
-
- Anderson T. J., Haubold B., Williams J. T., Estrada-Franco J. G., Richardson L., Mollinedo R., et al. (2000). Microsatellite markers reveal a spectrum of population structures in the malaria parasite Plasmodium falciparum . Mol. Biol. Evol. 17 (10), 1467–1482. 10.1093/oxfordjournals.molbev.a026247 - DOI - PubMed
Grants and funding
LinkOut - more resources
Full Text Sources
Miscellaneous