. 2024 Sep 13;10(22):e37713.
doi: 10.1016/j.heliyon.2024.e37713. eCollection 2024 Nov 30.

Cytotoxic and proliferation-inhibitory activity of natural and synthetic fungal tropolone sesquiterpenoids in various cell lines

Affiliations

Cytotoxic and proliferation-inhibitory activity of natural and synthetic fungal tropolone sesquiterpenoids in various cell lines

Timna C Bergmann et al. Heliyon. .

Abstract

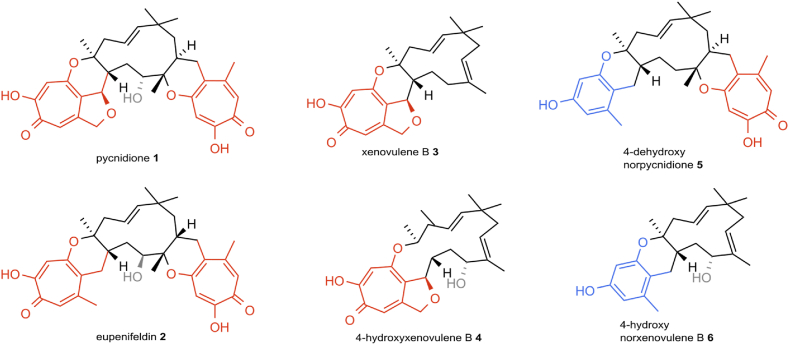
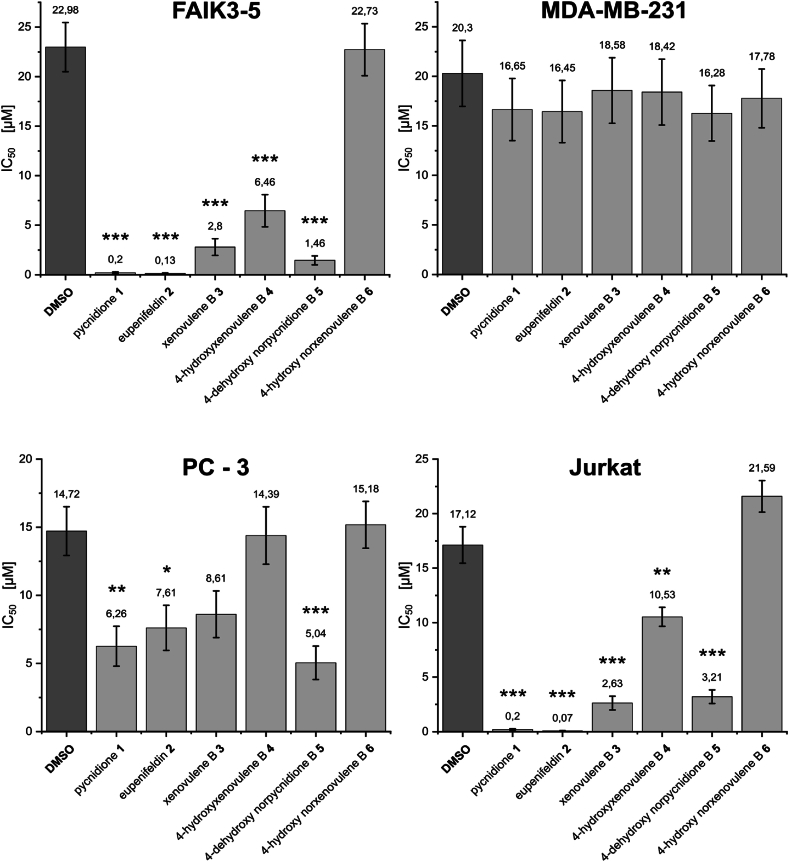
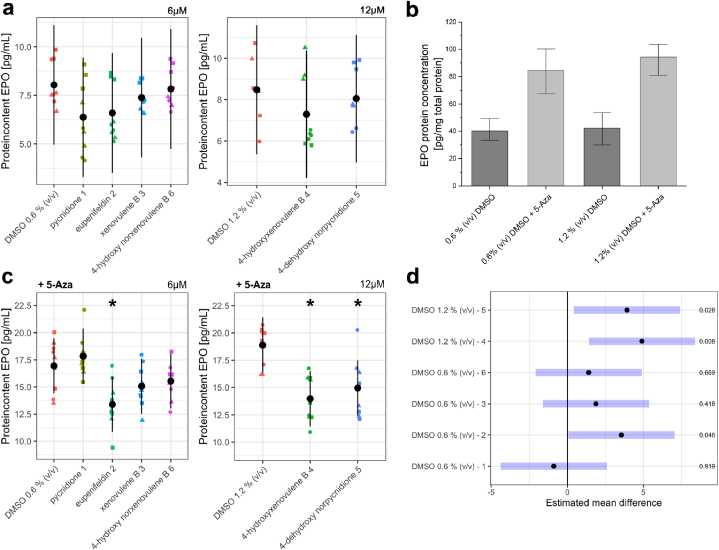
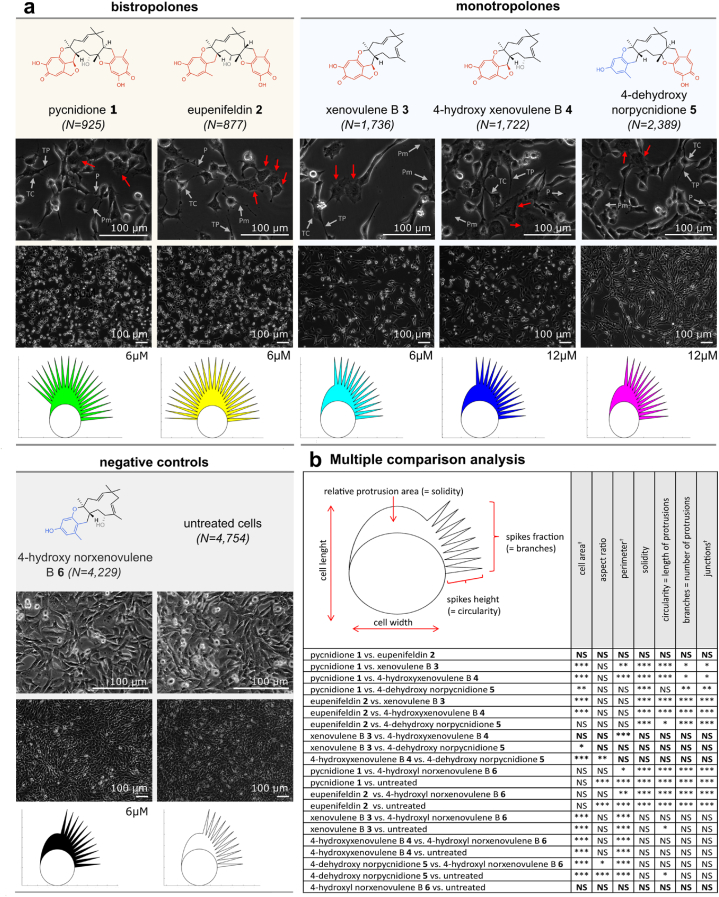
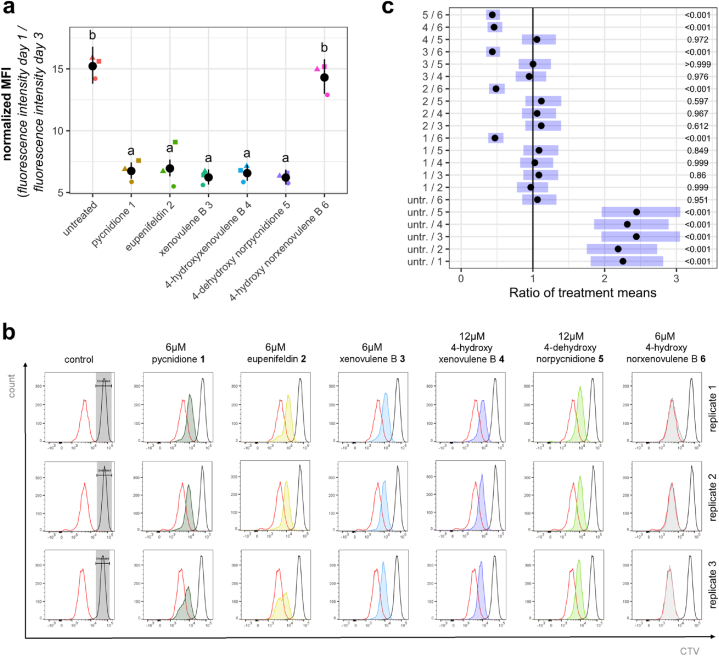
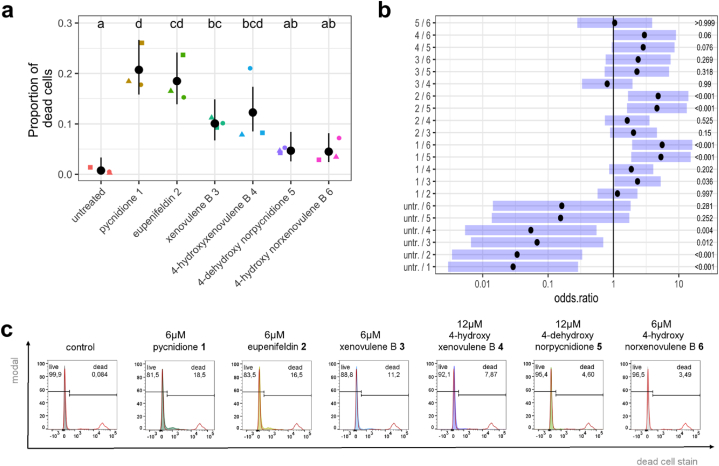
Fungal specialized metabolites are known for their potent biological activities, among which tropolone sesquiterpenoids (TS) stand out for their diverse bioactivities. Here, we report cytotoxic and proliferation inhibitory effects of the recently discovered TS compounds 4-hydroxyxenovulene B and 4-dihydroxy norpycnidione, and the structurally related 4-hydroxy norxenovulene B and xenovulene B. Inhibition of metabolic activity after TS treatment was observed in Jurkat, PC-3 and FAIK3-5 cells, whereas MDA-MB-231 cells were unresponsive to treatment. Structurally similar epolones were shown to induce erythropoietin (EPO). Therefore, FAIK3-5 cells, which can naturally produce EPO, were applied to test the compounds in this regard. While no effect on EPO production in FAIK3-5 cells could be demonstrated, effects on their proliferation, viability, and morphology were observed depending on the presence of tropolone moieties in the molecules. Our study underlines the importance of relevant cell models for bioactivity testing of compounds with unknown mechanisms of action.

Keywords: Bioactivity; Cytotoxicity; Erythropoietin; Proliferation; Synthetic biology; Tropolone sesquiterpenoids.


Conflict of interest statement

The authors declare that they have no known competing financial interests or personal relationships that could have appeared to influence the work reported in this paper.

Figures

Fig. 1
Fig. 1
Stereochemistry of selected tropolone sesquiterpene (TS) compounds (15) and a control compound (6) lacking a tropolone moiety [24]. TS compounds share a typical chemical structure, with a conserved 11-membered humulene-derived macropcyclic core structure connected to the pendent tropolone moieties via one or two dihydropyran rings. Key features are highlighted in red (= polyketide derived tropolones), blue (= benzopyranyl moiety) and grey (C-10 hydroxylation).
Fig. 2
Fig. 2
IC50 of the tropolone sesquiterpenoids (TS) pycnidione (1), eupenifeldin (2), xenovulene B (3), 4-hydroxyxenovulene B (4), 4-dehydroxy norpycnidione (5) and tropolone-lacking compound 4-hydroxy norxenovulene B (6) and their respective DMSO vehicle controls in murine FAIK3-5 cells and the cancer cell lines MDA-MB-231, PC-3 and Jurkat. Numbers above each graph bar indicate the calculated mean IC50 of three independent experiments (N = 3), with error bars corresponding to the calculated standard errors. Pairwise mean comparisons were calculated to show statistically significant differences between calculated IC50 of DMSO vehicle controls and TS compounds treated samples (see also Supplementary Fig. S 1b). Significances range from 0.05 to 0.01 (∗), <0.01-0.001 (∗∗) to <0.001 (∗∗∗). Further details on modelling and IC50 derivation are given in the statistical Supplementary statS1.
Fig. 3
Fig. 3
Erythropoietin (EPO) content of FAIK3-5 samples treated with the tropolone sesquiterpenoids (TS) pycnidione (1), eupenifeldin (2), xenovulene B (3), 4-hydroxyxenovulene B (4), 4-dehydroxy norpycnidione (5) and tropolone-lacking compound 4-hydroxy norxenovulene B (6) and their respective vehicle controls (DMSO 0.6 % (v/v), DMSO 1.2 % (v/v)). (a) EPO protein concentrations measured in three biological replicates (● = 1,▲ = 2, ■ = 3) of FAIK3-5 cells treated with 6 μM of TS compounds 1, 2, 3, tropolone-moiety lacking compound 6 and their respective DMSO vehicle control (0.6 % (v/v)) or 12 μM of TS compounds 4, 5, and their respective DMSO vehicle control (1.2 % (v/v)) without pre-treatment of 5-Azacytidine (5-Aza). Black dots are indicating the model based least square means and their pointwise 95 % confidence intervals (black bars). (b) Measurement of basic EPO protein content in FAIK3-5 DMSO vehicle controls (0.6 % (v/v) and 1.2 % (v/v) with and without 5-Aza treatment for 6 days. Error bars indicate the standard deviation of mean EPO concentrations. (c) EPO protein concentrations measured in three biological replicates (● = 1,▲ = 2, ■ = 3) of FAIK3-5 cells treated with 6 μM of TS compounds 1, 2, 3, tropolone-moiety lacking compound 6 and their respective DMSO vehicle control (0.6 % (v/v)), or 12 μM of TS compounds 4, 5, and their respective DMSO vehicle control (1.2 % (v/v)) with pre-treatment of 5-Azacytidine (+5-Aza). Black dots are indicating the model based least square means and their pointwise 95 % confidence intervals (black bars). Treatments marked with are statistically significantly different from their respective vehicle controls. (d) Pairwise mean comparisons showed statistically significant differences in EPO protein concentrations 4-hydroxyxenovulene B (4), 4-dehydroxy norpycnidione (5) and eupenifeldin (2) compared to their respective vehicle controls. Black dots indicate back transformed means of measured EPO concentrations and their 95 % confidence intervals (blue bars). Respective p-values for each calculation are displayed on the right side. The estimated contrasts and corresponding confidence intervals are given in the statistical Supplementary statS2 and statS3.
Fig. 4
Fig. 4
Alterations of cell morphology of FAIK3-5 cells after 24 h of treatment with the TS compounds pycnidione (1), eupenifeldin (2), xenovulene B (3), 4-hydroxyxenovulene B (4), 4-dehydroxy norpycnidione (5), the tropolone-lacking compound 4-hydroxy norxenovulene B 6 and untreated controls. (a) Brightfield images of samples treated for 24 h with compounds 15 and negative controls (compound 6 and untreated cells). Scale bars = 100 μm. Red arrows indicate enlarged and flat cells that were visible to varying degrees in each tropolone-treated sample. All samples treated with TS - compounds (15) show the occurrence of telocytes (TC) with characteristic telopodes (TP) containing of podomers (Pm) and podons (P). TS treated cells and negative controls were additionally visualized in PhenoPlot, in which quantifiable cell features such as cell width and length, relative area of protrusions as well as their proportion and size (spike fraction and spike height) are displayed for each sample condition. (b) Automated cell segmentation was conducted by using the deep-learning algorithm Cellpose [47]. Multiple comparison analysis for analyzed shape descriptors and morphometric parameters (cell area, aspect ratio, perimeter, relative protrusion area as well as length and number of protrusions/branches and branch junctions) were measured on n = 194 to n = 1773 cells per image and a total of n = 16,632 cells from the different test conditions from three independent experiments in Fiji (version 1.53c). Statistical analysis of data was conducted with R (version 4.2.1). All parameters marked with (†) are not depicted in PhenoPlot graphs. Significances range from p > 0.05 (NS), 0.05-0.01 (∗), <0.01-0.001 (∗∗) to <0.001 (∗∗∗). The estimated contrasts and corresponding confidence intervals are given in the statistical Supplementary statS4 and statS5.
Fig. 5
Fig. 5
Proliferation decrease of FAIK3-5 cells after treatment with the positive controls pycnidione (1) and eupenifeldin (2), and with xenovulene B (3), 4-hydroxyxenovulene B (4) and 4-dehydroxy norpycnidione (5) compared to untreated controls and tropolone moiety lacking compound 4-hydroxy norxenovulene B (6). Statistics were calculated based on normalized values of obtained ln-transformed mean fluorescence intensities (MFIs) directly after the CellTrace™ Violet (CTV) staining of the undivided population and 24h post compound treatment. (a) The graphical overview shows ratios of MFI values obtained on day 1 and day 3 of three biological replicates (● = 1, ▲ = 2, ■ = 3) after treatment with compounds 16 and the untreated control sample, as well as their modelled means (black dots) and pointwise 95 % confidence intervals. Treatments marked with the same letter do not differ statistically significantly from each other (α = 0.05). (b) Histograms and obtained fluorescence intensities of CTV stained FAIK3-5 cells show MFI peaks and values of starting intensities of undivided cell populations at d1 (grey background), control peaks of untreated samples at d3 (red) and MFI peaks of the respective compounds used for treatment (dark green = pycnidione (1), yellow = eupenifeldin (2), light blue = xenovulene B (3), dark blue = 4-hydroxyxenovulene B (4), light green = 4-dehydroxy norpycnidione (5), 4 grey = 4-hydroxy norxenovulene B (6)). (c) Pairwise mean comparisons showed statistically significant differences in MFI ratios of day 1/day 3 between all TS compounds treated cells compared to untreated controls and compound 4-hydroxy norxenovulene B (6). Black dots indicate back transformed means of calculated ratios and their 95 % confidence intervals (blue bars). Respective p-values for each calculation are displayed on the right side. The estimated contrasts and corresponding confidence intervals are given in the statistical Supplementary statS7.
Fig. 6
Fig. 6
Cytotoxic effects after treatment with 6 μM of the positive controls pycnidione (1), eupenifeldin (2), and with xenovulene B (3), and 12 μM of 4-hydroxyxenovulene B (4) and 4-dehydroxy norpycnidione (5) on FAIK3-5 cells. As negative controls untreated cells and 6 μM of the tropolone moiety lacking compound 4-hydroxy norxenovulene B (6) were used. Statistical analysis was conducted based on the calculation of the average proportion of dead cells per samples (samples size = 10.000 cells). (a) Proportions of dead cells (black dots) and their pointwise 95 % confidence intervals (error bars) of three biological replicates (● = 1, ▲ = 2, ■ = 3). Treatments marked with the same letter do not differ statistically significantly from each other (α = 0.05). (b) Multiple comparisons of calculated odds ratios (black dots) and simultaneous 95 % confidence intervals (blue bars, details see statistical Supplementary statS9) showing differences of cell survival between samples treated with tropolone moiety containing compounds (15) compared to untreated samples or tropolone-lacking compound 6. P-values for each contrast test of different treatments are displayed on the right side. (c) Representative plot of fluorescent intensities of SYTOX™ AADvanced™ stained FAIK3-5 cells samples. Each plot displays percentages of living and dead populations in an untreated control sample and after treatment with the TS compounds pycnidione (1), eupenifeldin (2), xenovulene B (3) and 4-hydroxyxenovulene B (4) and 4-dehydroxy norpycnidione (5), and tropolone lacking compound 4-hydroxy norxenovulene B (6). Peaks of fluorescence intensities are displayed with the respective living/dead control (red) containing a heat-killed dead cell population.

Similar articles

References

    1. Peláez F. In: Handbook of Industrial Mycology. An Z., editor. M. Dekker; 2005. Biological activities of fungal metabolites; pp. 49–92.
    1. Schueffler A., Anke T. Fungal natural products in research and development. Nat. Prod. Rep. 2014;31:1425–1448. doi: 10.1039/c4np00060a. - DOI - PubMed
    1. Choy K.W., Murugan D., Mustafa M.R. Natural products targeting ER stress pathway for the treatment of cardiovascular diseases. Pharmacol. Res. 2018;132:119–129. doi: 10.1016/j.phrs.2018.04.013. - DOI - PubMed
    1. Langeder J., Grienke U., Chen Y., Kirchmair J., Schmidtke M., Rollinger J.M. Natural products against acute respiratory infections: strategies and lessons learned. J. Ethnopharmacol. 2020;248 doi: 10.1016/j.jep.2019.112298. - DOI - PubMed
    1. Yu S., Liu M., Hu K. Natural products: potential therapeutic agents in multiple sclerosis. Int. Immunopharm. 2019;67:87–97. doi: 10.1016/j.intimp.2018.11.036. - DOI - PubMed

LinkOut - more resources