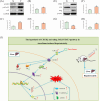
CXCR2 Activated JAK3/STAT3 Signaling Pathway Exacerbating Hepatotoxicity Associated with Tacrolimus
- PMID: 39749191
- PMCID: PMC11693940
- DOI: 10.2147/DDDT.S496195
CXCR2 Activated JAK3/STAT3 Signaling Pathway Exacerbating Hepatotoxicity Associated with Tacrolimus
Abstract
Purpose: Tacrolimus could induce hepatotoxicity during clinical use, and the mechanism was still unclear, which posed new challenge for the prevention and treatment of tacrolimus-induced hepatotoxicity. The aim of this study was to investigate the mechanism of tacrolimus-induced hepatotoxicity and provide reference for drug development target.
Methods: In this study, biochemical analysis, pathological staining, immunofluorescent staining, immunohistochemical staining, transcriptomic analysis, Western blotting was used to investigate the mechanism of tacrolimus-induced hepatotoxicity in gene knockout mice and Wistar rats.
Results: In gene knockout mice, compared to wild-type mice, CXCR2-deficiency alleviated tacrolimus-induced hepatotoxicity (P < 0.05 or P < 0.01). In Wistar rats, compared to control group, CXCL2-CXCR2, JAK3/STAT3 signaling pathway (phosphorylation of JAK3 and STAT3) were up-regulated, the expression of CIS was lowered and the expression of PIM1 was raised, inducing liver pathological change (P < 0.05 or P < 0.01); Inversely, blocking CXCR2 could reverse the expression of p-JAK3/p-STAT3 and tacrolimus-induced hepatotoxicity (P < 0.05 or P < 0.01).
Conclusion: CXCR2 activated JAK3/STAT3 signaling pathway (phosphorylation of JAK3 and STAT3) exacerbating hepatotoxicity associated with tacrolimus, meanwhile the expression of CIS was down-regulated, the expression of PIM1 was up-regulated. Blocking CXCR2 could reverse the expression of p-JAK3/p-STAT3, CIS, PIM1, and tacrolimus-induced hepatotoxicity.
Keywords: CIS; CXCR2; JAK3/STAT3 signaling pathway; PIM1; hepatotoxicity; tacrolimus.
© 2024 Chen et al.
Conflict of interest statement
The authors declare that they have no competing interests.
Figures


Similar articles
-
Targeting CXCR2 ameliorated tacrolimus-induced nephrotoxicity by alleviating overactivation of PI3K/AKT/mTOR pathway and calcium overload.Biomed Pharmacother. 2024 Nov;180:117526. doi: 10.1016/j.biopha.2024.117526. Epub 2024 Oct 7. Biomed Pharmacother. 2024. PMID: 39378682
-
Peficitinib alleviated acute lung injury by blocking glycolysis through JAK3/STAT3 pathway.Int Immunopharmacol. 2024 May 10;132:111931. doi: 10.1016/j.intimp.2024.111931. Epub 2024 Mar 27. Int Immunopharmacol. 2024. PMID: 38547769
-
Regulatory effect of calcineurin inhibitor, tacrolimus, on IL-6/sIL-6R-mediated RANKL expression through JAK2-STAT3-SOCS3 signaling pathway in fibroblast-like synoviocytes.Arthritis Res Ther. 2013 Feb 13;15(1):R26. doi: 10.1186/ar4162. Arthritis Res Ther. 2013. PMID: 23406906 Free PMC article.
-
Hepato-protective effect of rutin via IL-6/STAT3 pathway in CCl4-induced hepatotoxicity in rats.Biol Res. 2015 Jun 11;48(1):30. doi: 10.1186/s40659-015-0022-y. Biol Res. 2015. PMID: 26062544 Free PMC article.
-
Benzoxathiol derivative BOT-4-one suppresses L540 lymphoma cell survival and proliferation via inhibition of JAK3/STAT3 signaling.Exp Mol Med. 2011 May 31;43(5):313-21. doi: 10.3858/emm.2011.43.5.035. Exp Mol Med. 2011. PMID: 21499010 Free PMC article.
Cited by
-
Uncovering mechanism of hepatotoxicity diseases caused by tetrahydrocannabinol based on novel network toxicology and experimental verification.Sci Rep. 2025 Apr 21;15(1):13712. doi: 10.1038/s41598-025-97523-0. Sci Rep. 2025. PMID: 40258948 Free PMC article.
References
-
- Laub MR, Crow SA, Personett HA, Dierkhising R, Boilson B, Razonable R. Effects of clotrimazole troches on tacrolimus dosing in heart transplant recipients. Transpl Infect Dis. 2018;20(6):e12979. - PubMed
-
- Wang D, Chen X, Xu H, Li Z. Population pharmacokinetics and dosing regimen optimization of tacrolimus in Chinese pediatric hematopoietic stem cell transplantation patients. Xenobiotica. 2020;50(2):178–185. - PubMed
MeSH terms
Substances
LinkOut - more resources
Full Text Sources
Medical
Miscellaneous

