. 2024 Dec 19:15:1498528.
doi: 10.3389/fphar.2024.1498528. eCollection 2024.

ABCA1 promote tumor environment heterogeneity via epithelial mesenchymal transition in Huh7 and HepG2 liver cancer cell

Affiliations

ABCA1 promote tumor environment heterogeneity via epithelial mesenchymal transition in Huh7 and HepG2 liver cancer cell

Dinglai Yu et al. Front Pharmacol. .

Abstract

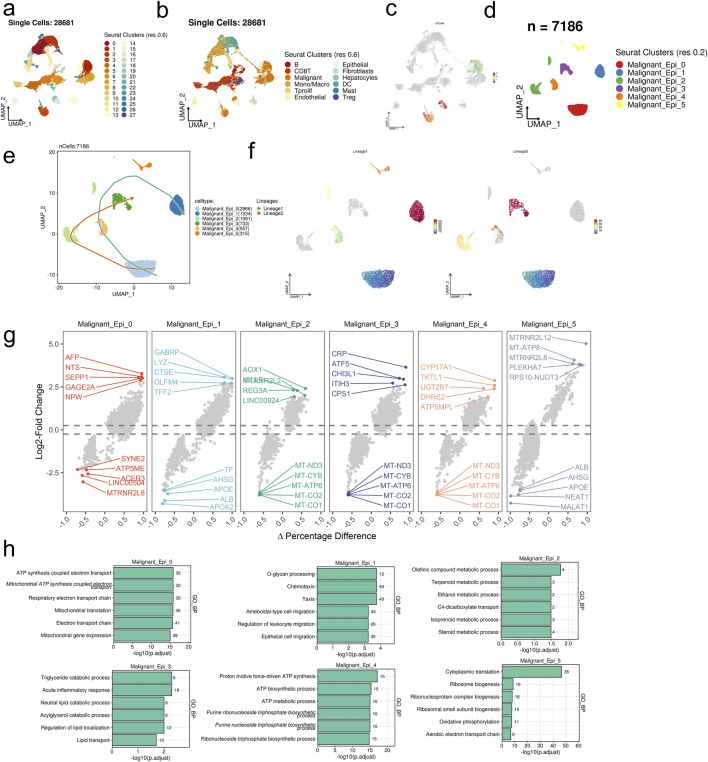
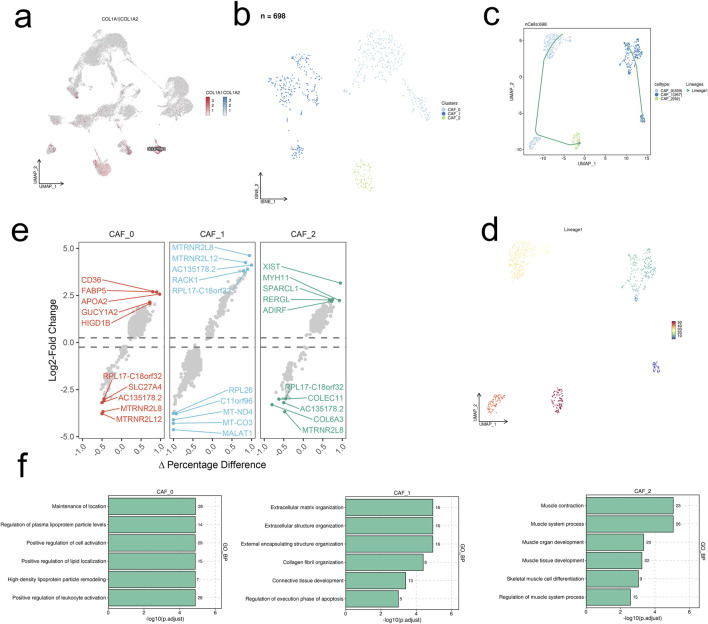
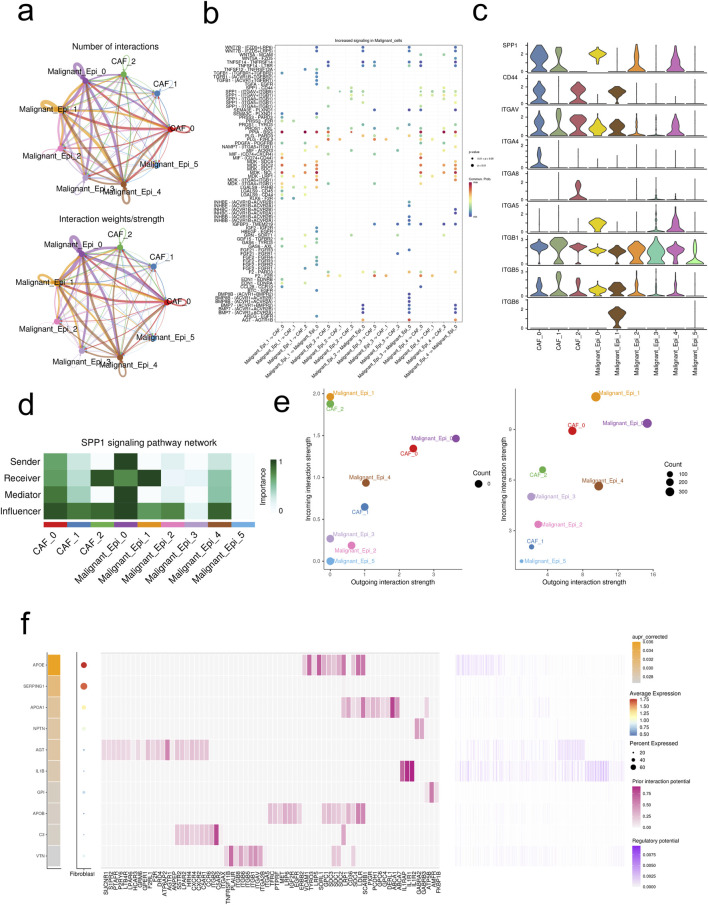
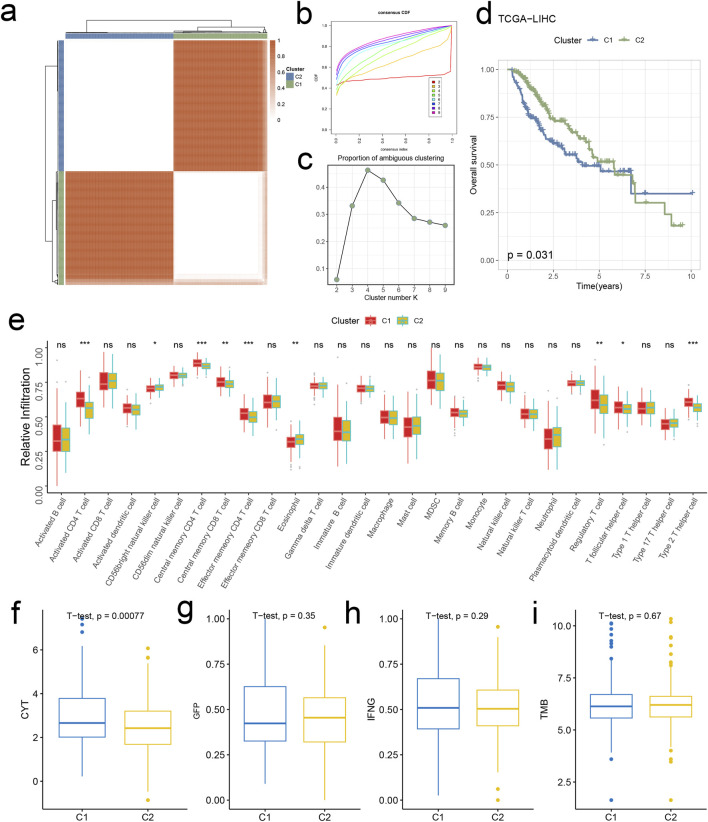
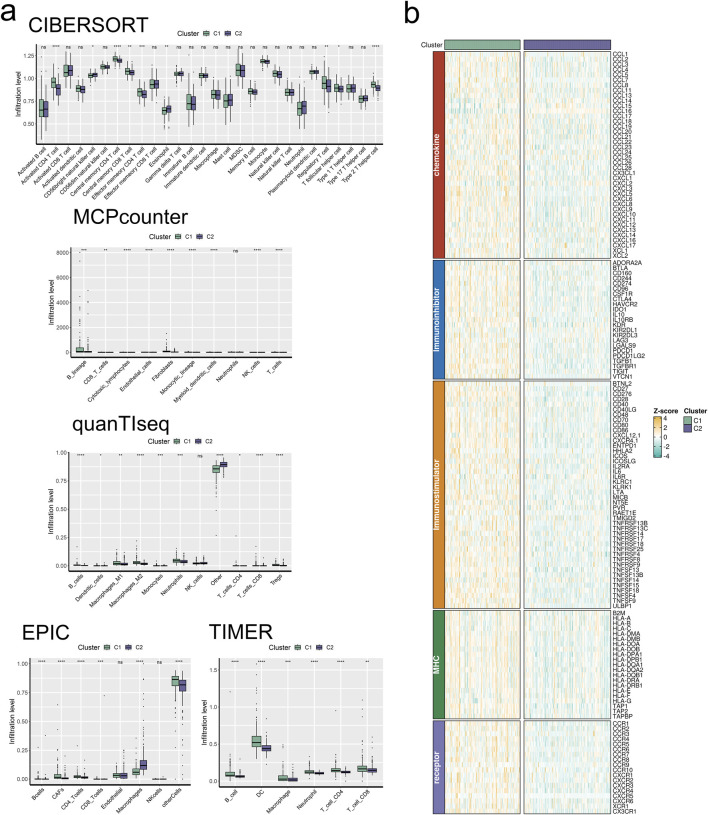
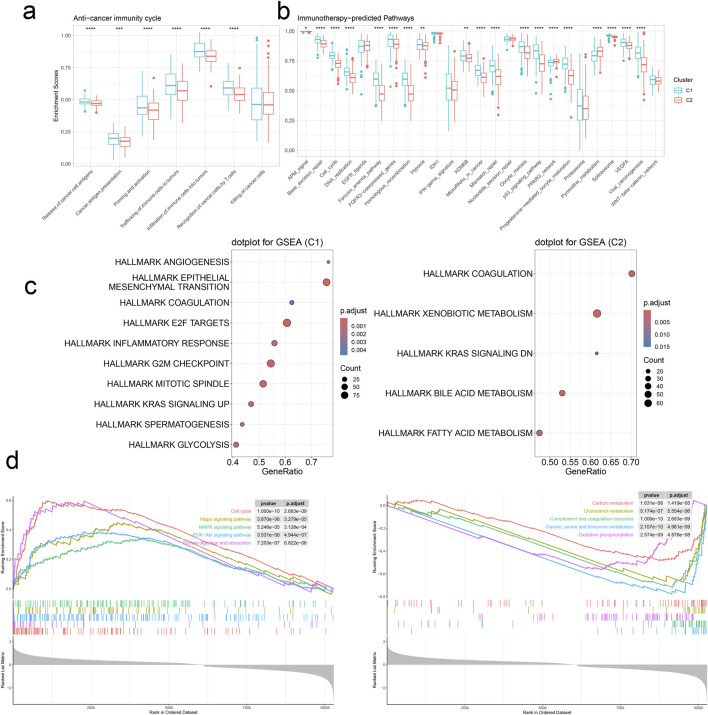
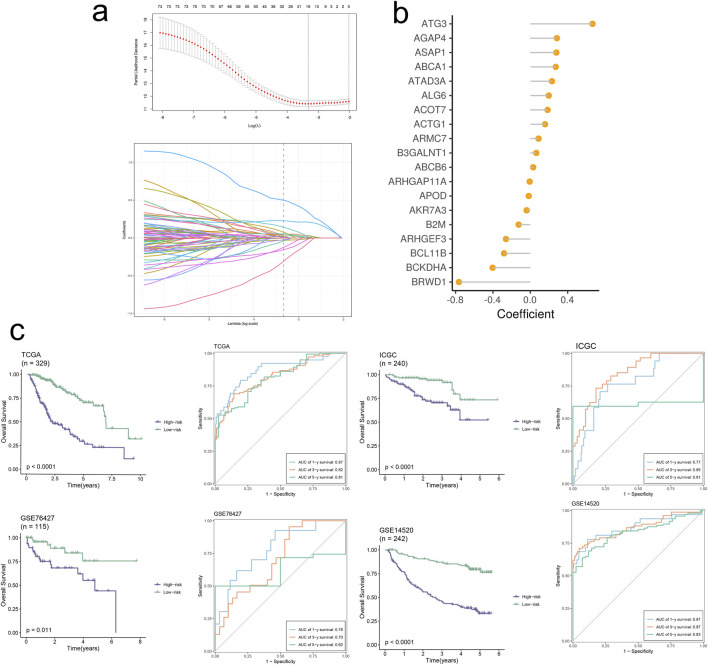
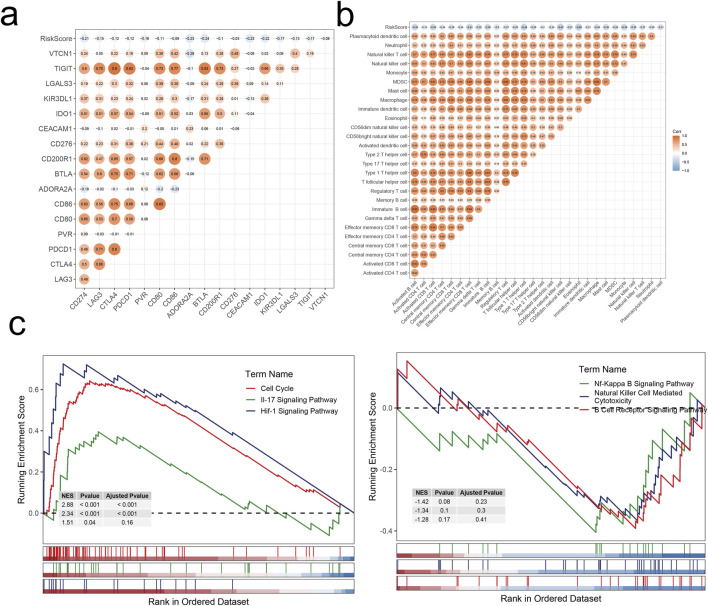
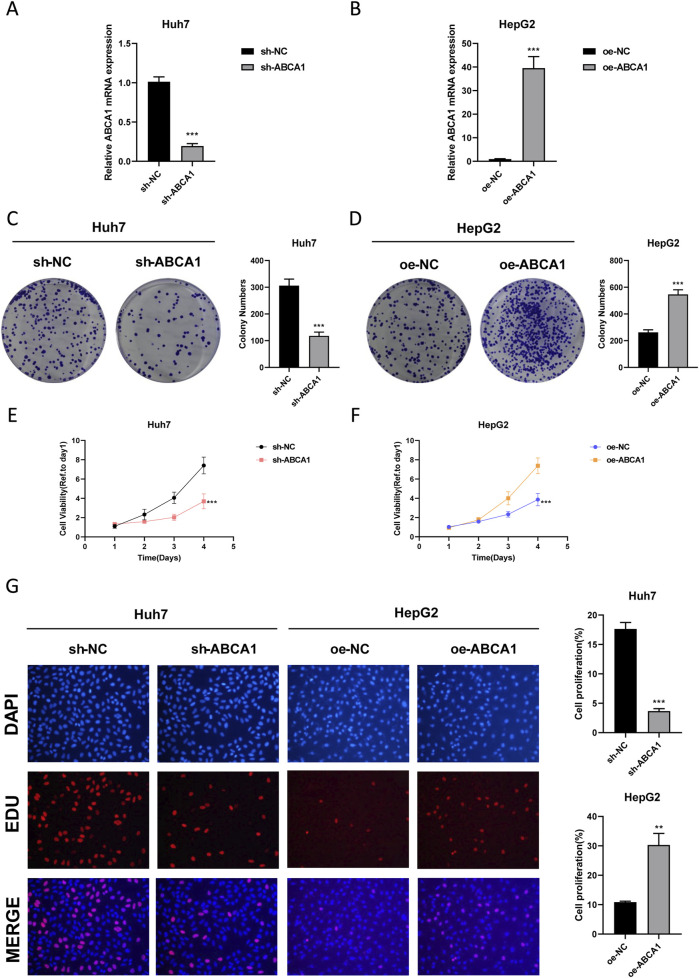
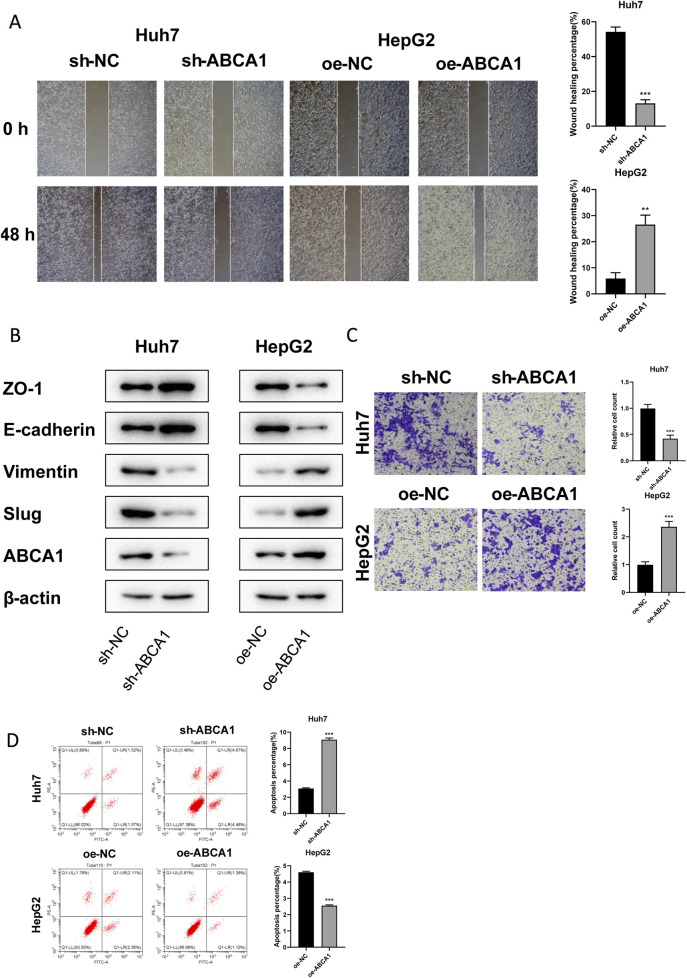
In this study, we delve into the intrinsic mechanisms of cell communication in hepatocellular carcinoma (HCC). Initially, employing single-cell sequencing, we analyze multiple malignant cell subpopulations and cancer-associated fibroblast (CAF) subpopulations, revealing their interplay through receptor-ligand interactions, with a particular focus on SPP1. Subsequently, employing unsupervised clustering analysis, we delineate two clusters, C1 and C2, and compare their infiltration characteristics using various tools and metrics, uncovering heightened cytotoxicity and overall invasion abundance in C1. Furthermore, our gene risk scoring model indicates heightened activity of the immune therapeutic pathway in C1. Lastly, employing a formulated scoring system, we stratify patients into high and low-risk groups, revealing notably poorer outcomes in the high-risk cohort on Kaplan-Meier curves. Risk scores exhibit a negative correlation with model genes and immune cell infiltration scores, indicating poor prognosis in the high-risk group. Further characterization elucidates the regulatory landscape of the high and low-risk groups across various signaling pathways. In addition, we used wet lab experiments to prove that ABCA1 plays a pro-oncogenic role in hepatocellular carcinoma cells by promoting proliferation, invasion, migration, and reducing apoptosis. In summary, these findings provide crucial insights, offering valuable clues and references for understanding HCC pathogenesis and patient prognosis.

Keywords: hepatocellular carcinoma; immune therapeutic pathway; risk stratification; single-cell sequencing; tumor microenvironment.


Conflict of interest statement

The authors declare that the research was conducted in the absence of any commercial or financial relationships that could be construed as a potential conflict of interest.

Figures

FIGURE 1
FIGURE 1
scRNA-seq analysis unravels the heterogeneity of in malignant cells in HCC. (A) 28 clusters were identified in the integrated scRNA-seq dataset. (B) 12 major cell types were annotated. (C) UMAP visualization of the expression levels of EPCAM in the integrated scRNA-seq dataset. (D) Malignant cell subpopulations were identified from the major malignant cell set. (E, F) The predicted developmental trajectories of malignant epithelial cell subsets. (G) The differentially expressed genes of each malignant cell subset. (H) Top six enriched GO_BP terms of each malignant cell subset.
FIGURE 2
FIGURE 2
scRNA-seq analysis unravels the heterogeneity of CAFs in HCC. (A) UMAP visualization of the expression levels of COL1A1 and COL1A2 in the integrated scRNA-seq dataset. (B) UMAP visualization of the 698 CAFs. (C, D) The predicted developmental trajectories of CAF subsets. (E) The differentially expressed genes of each CAF subset. (F) Top six enriched GO_BP terms of each CAF subset.
FIGURE 3
FIGURE 3
Intercellular communications between CAFs and malignant cells. (A) The intercellular interactions between subsets of CAFs and malignant cells. (B) The ligand-receptor pairs between CAFs and malignant cells. (C) Expression profiles of SPP1 signaling pathway in CAFs and malignant cells. (D) The importance of each subset of CAFs and malignant cells in the SPP1 signaling pathway. (E) The incoming/outgoing strength of each subset of CAFs and malignant cells in the SPP1 signaling pathway (left) and the whole signaling pathways (right). (F) Top ligands in the communication network. Ligand-target gene matrix denoting the potential regulatory relationships between ligands and target genes among CAFs and malignant cells. The color intensity represented the regulatory potentials.
FIGURE 4
FIGURE 4
The gene regulatory networks (GRNs) in HCC. (A) UMAP visualization of the five regulons at single-cell level of HCC. (B) Heatmap demonstrated the activity of each regulon in CAFs and malignant cells.
FIGURE 5
FIGURE 5
Signature stratifies HCC TME into two subclusters with distinct prognosis and biological features. (A) The consensus score matrix of all samples when k = 2. A higher consensus score denotes higher similarity. (B) The CDF curves of the consensus matrix for each k (indicated by colors). (C) The PAC score for each k. (D) KM survival curves with log-rank test demonstrate survival discrepancies between two clusters. (E) Relative infiltration abundances of 28 immune cell subsets in two clusters. p values are determined by the Wilcoxon test. ns: non-significant; *p < 0.05; ***p < 0.001. The activities of CYT (F), GFP (G), IFNG (H), and TMB (I) between two clusters.
FIGURE 6
FIGURE 6
Signature stratifies HCC TME into two subclusters with distinct TME landscapes. (A) The infiltration abundance of immune cell subsets evaluated by CIBERSORT, MCP-counter, quanTIseq, EPIC, and TIMER for two clusters. (B) The expression abundances of immunoregulators for two clusters.
FIGURE 7
FIGURE 7
Signature stratifies HCC TME into two subclusters with distinct dysregulated pathways. (A) The activities of anti-cancer immunity between two clusters by GSVA. (B) The activities of immunotherapy-predicted pathways between two clusters by GSVA. *p < 0.05, **p < 0.01, ****p < 0.0001. (C) Upregulated cancer hallmarks in the two clusters by GSEA. (D) Upregulated (left panel) and downregulated (right panel) pathways in C1.
FIGURE 8
FIGURE 8
Signature-based model demonstrates high accuracy and robust performance in predicting prognosis. (A) The selection of prognostic signature genes based on the optimal parameter λ that was obtained in the LASSO regression analysis. (B) Lollipop chart of the coefficients of signature genes. (C) KM curves displayed survival outcomes of patients in two risk groups. Time-dependent ROC curves were drawn to assess survival rate at 1-year, 3-year, and 5-year.
FIGURE 9
FIGURE 9
Correlation analysis and enrichment analysis. (A) Correlations between RiskScore and immune checkpoints. (B) Correlations between RiskScore and infiltration levels of 28 immune cell subsets. (C) Dysregulated pathways in high-risk LIHC patients.
FIGURE 10
FIGURE 10
Efficiency validation of ABCA1 knockdown and overexpression and their impact on cancer cell proliferation. (A) RT-qPCR experiment validating the knockdown efficiency of sh-ABCA1 in Huh7 cell line. (B) RT-qPCR experiment validating the overexpression efficiency of oe-ABCA1 in HepG2 cell line. (C) Colony formation assay reflecting differences in proliferation levels between ABCA1 knockdown group and control group cells. (D) Colony formation assay reflecting differences in proliferation levels between ABCA1 overexpression group and control group cells. (E) CCK8 assay reflecting differences in proliferation levels between ABCA1 knockdown group and control group cells. (F) CCK8 assay reflecting differences in proliferation levels between ABCA1 overexpression group and control group cells. (G) EDU assay reflecting differences in proliferation levels between ABCA1 knockdown group, ABCA1 overexpression group, and control group cells.
FIGURE 11
FIGURE 11
Effects of ABCA1 knockdown and overexpression on cell migration, invasion, and apoptosis capabilities. (A) Wound healing assay validating differences in migration levels between ABCA1 knockdown group, ABCA1 overexpression group, and control group cells. (B) Western blot validating differences in migration-related protein expression levels between ABCA1 knockdown group, ABCA1 overexpression group, and control group cells. (C) Transwell assay validating differences in invasion levels between ABCA1 knockdown group, ABCA1 overexpression group, and control group cells. (D) Flow cytometry validating differences in apoptosis levels between ABCA1 knockdown group, ABCA1 overexpression group, and control group cells.

Similar articles

References

    1. Anwanwan D., Singh S. K., Singh S., Saikam V., Singh R. (2020). Challenges in liver cancer and possible treatment approaches. Biochim. Biophys. Acta Rev. Cancer 1873 (1), 188314. 10.1016/j.bbcan.2019.188314 - DOI - PMC - PubMed
    1. Biffi G., Tuveson D. A. (2021). Diversity and biology of cancer-associated fibroblasts. Physiol. Rev. 101 (1), 147–176. 10.1152/physrev.00048.2019 - DOI - PMC - PubMed
    1. Bruix J., Han K. H., Gores G., Llovet J. M., Mazzaferro V. (2015). Liver cancer: approaching a personalized care. J. Hepatol. 62 (1 Suppl. l), S144–S156. 10.1016/j.jhep.2015.02.007 - DOI - PMC - PubMed
    1. Chen C., Ge C., Liu Z., Li L., Zhao F., Tian H., et al. (2018). ATF3 inhibits the tumorigenesis and progression of hepatocellular carcinoma cells via upregulation of CYR61 expression. J. Exp. Clin. Cancer Res. 37 (1), 263. 10.1186/s13046-018-0919-8 - DOI - PMC - PubMed
    1. Chen D., Liu J., Zang L., Xiao T., Zhang X., Li Z., et al. (2022). Integrated machine learning and bioinformatic analyses constructed a novel stemness-related classifier to predict prognosis and immunotherapy responses for hepatocellular carcinoma patients. Int. J. Biol. Sci. 18 (1), 360–373. 10.7150/ijbs.66913 - DOI - PMC - PubMed

LinkOut - more resources