. 2024 Dec 19:11:1481441.
doi: 10.3389/fmolb.2024.1481441. eCollection 2024.

Circulating biomarkers associated with pediatric sickle cell disease

Affiliations

Circulating biomarkers associated with pediatric sickle cell disease

Cecilia Elorm Lekpor et al. Front Mol Biosci. .

Abstract

Introduction: Sickle cell disease (SCD) is a genetic blood disorder caused by a mutation in the HBB gene, which encodes the beta-globin subunit of hemoglobin. This mutation leads to the production of abnormal hemoglobin S (HbS), causing red blood cells to deform into a sickle shape. These deformed cells can block blood flow, leading to complications like chronic hemolysis, anemia, severe pain episodes, and organ damage. SCD genotypes include HbSS, HbSC (HbC is an abnormal variant of hemoglobin), and HbS/β-thalassemia. Sickle cell trait (SCT), HbAS, represents the carrier state, while other hemoglobin variants include HbCC, HbAC, and the normal HbAA. Over 7.5 million people worldwide live with SCD, with a high mortality rate in sub-Saharan Africa, including Ghana. Despite its prevalence, SCD is underdiagnosed and poorly managed, especially in children. Characterized by intravascular hemolysis, SCD leads to oxidative stress, endothelial activation, and systemic inflammation. Identifying circulating blood biomarkers indicative of organ damage and systemic processes is vital for understanding SCD and improving patient management. However, research on biomarkers in pediatric SCD is limited and few have been identified and validated. This study explores specific circulating biomarkers in pediatric SCD in Ghana (West Africa), hypothesizing that inflammatory and neuronal injury markers in children with SCD could predict disease outcomes.

Methods: Clinical data were collected from 377 children aged 3-8 years with various Hb genotypes, including SCD and SCT, at Korle-Bu Teaching Hospital in Accra, Ghana (2021-2022). A total of 80 age- and sex-matched subjects were identified. A cross-sectional study utilized a multiplexed immunoassay procedure to evaluate serum biomarkers, including cytokines, chemokines, vascular injury markers, systemic inflammation markers, cell-free heme scavengers, brain-derived neurotrophic factor (BDNF), and angiogenic factors.

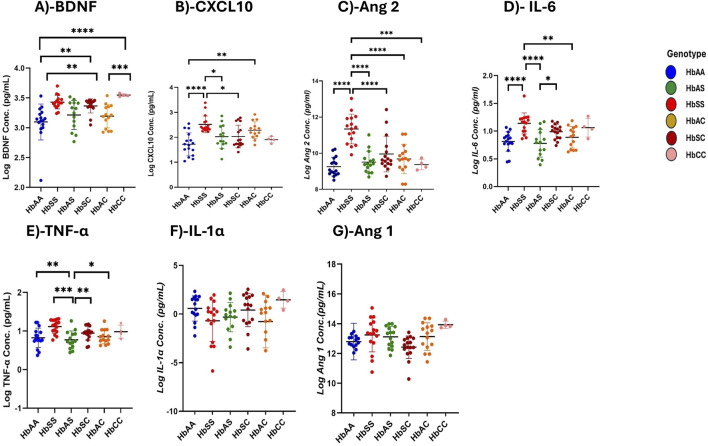
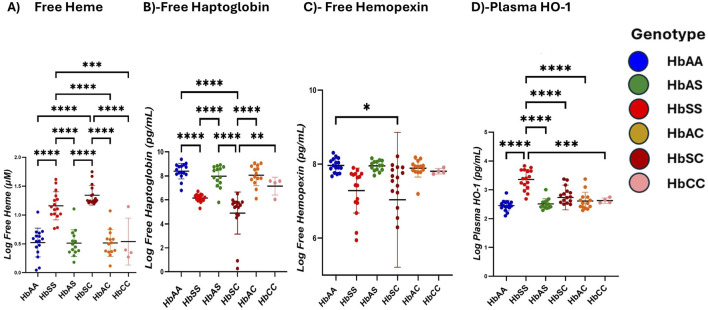
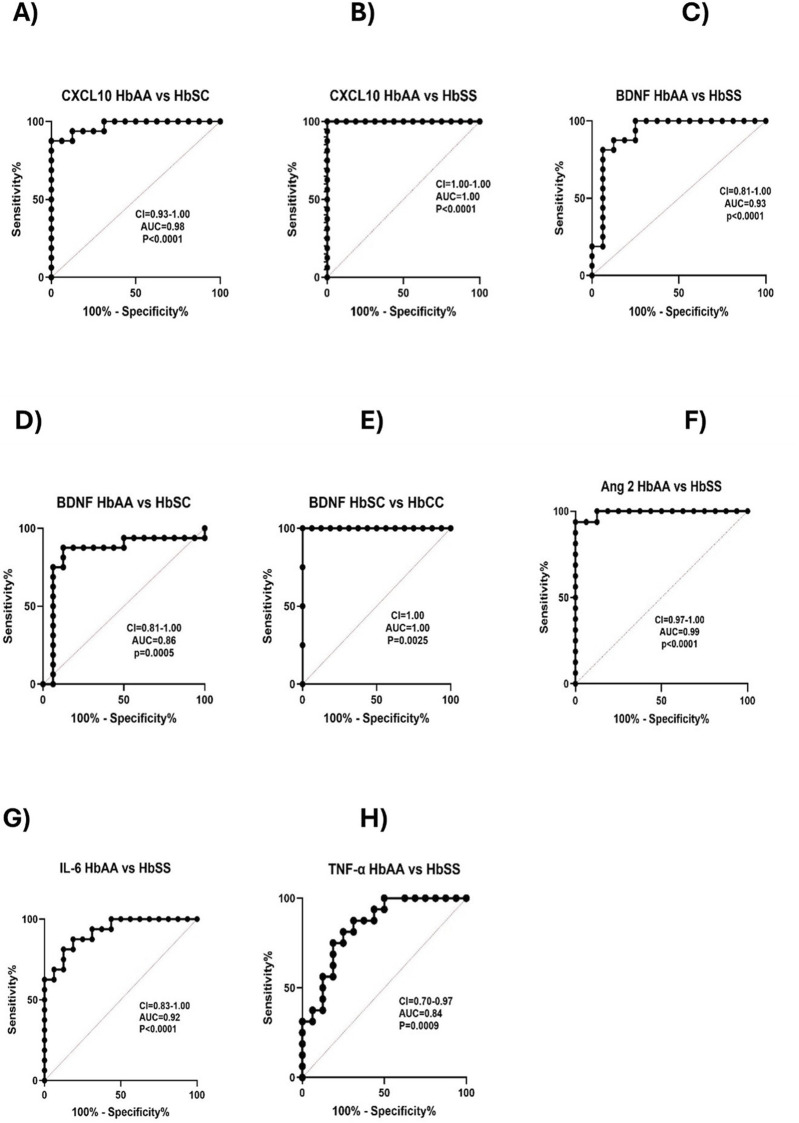
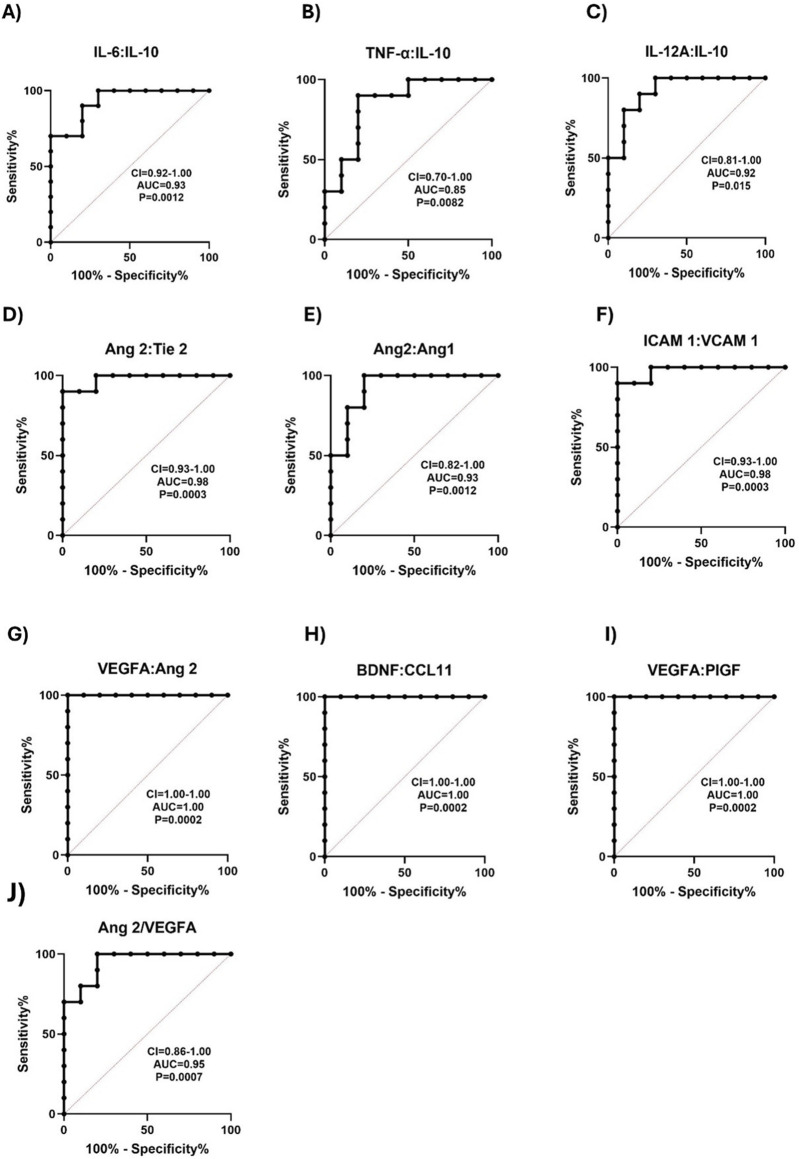
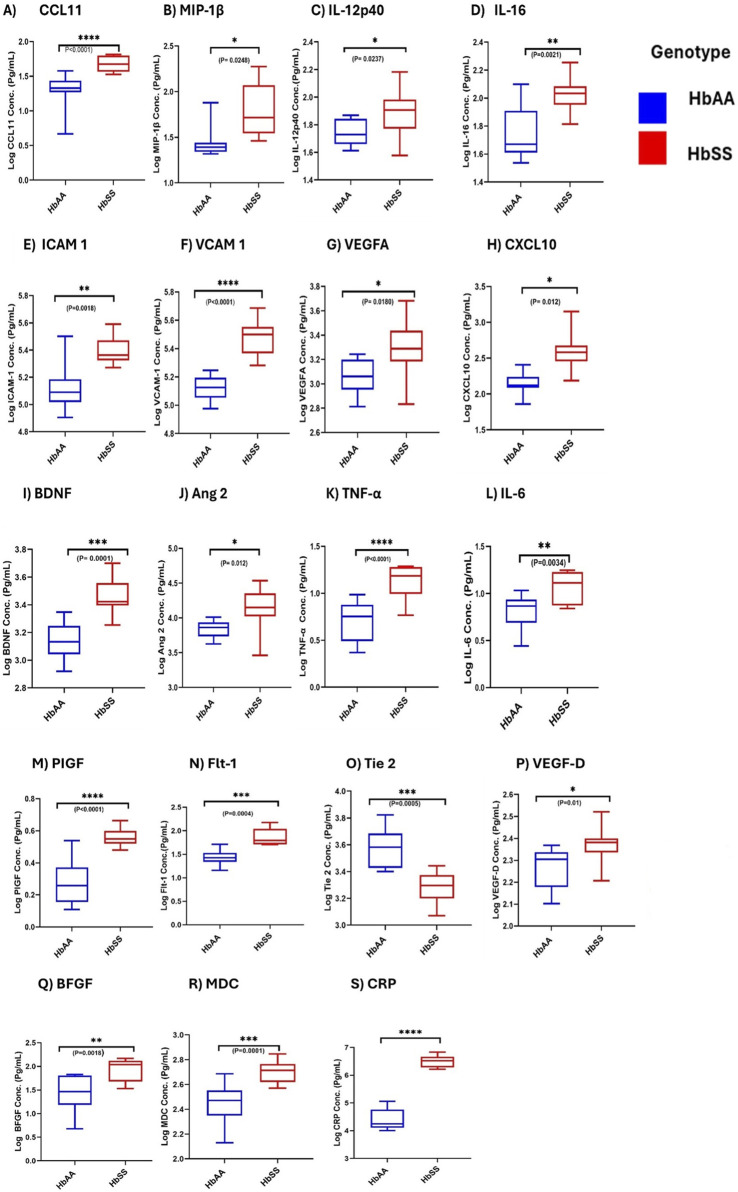
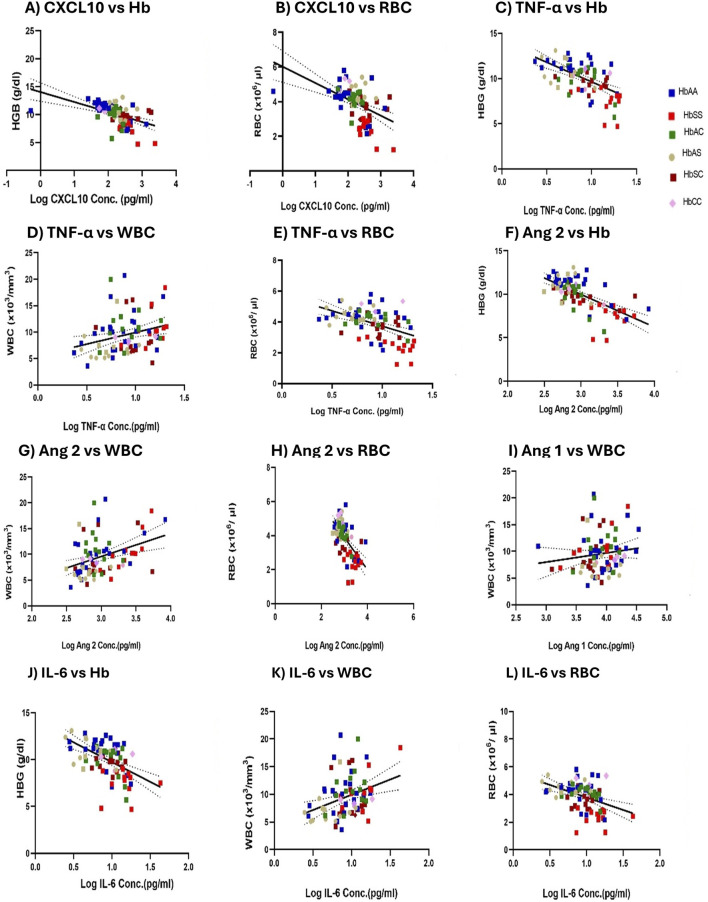
Results: Elevated levels of BDNF, Ang-2, CXCL10, CCL11, TNF-α, IL-6, IL-10, IL12p40, ICAM-1, VCAM-1, Tie-2, and VEGFA were observed in HbSS subjects, correlating with hemoglobin level, leukocyte, and erythrocyte counts. Heme scavengers like HO-1, hemopexin, and haptoglobin also correlated with these parameters. ROC and AUC analyses demonstrated the potential of these biomarkers in predicting SCD outcomes.

Conclusion: These findings suggest that there are significant differences between biomarker expression among the different genotypes examined. We conclude that a predictive algorithm based on these biomarkers could be developed and validated through longitudinal assessment of within-genotype differences and correlation of the data with disease severity or outcomes. With such a tool one can enhance SCD management and improve patient outcomes. This approach may pave the way for personalized interventions and better clinical care for pediatric SCD patients.

Keywords: global health; hemoglobinopathies; inflammation biomarkers; oxidative stress; pediatric hematology.


Conflict of interest statement

The authors declare that the research was conducted in the absence of any commercial or financial relationships that could be construed as a potential conflict of interest.

Figures

FIGURE 1
FIGURE 1
Differential Expression of Inflammatory, Vascular, and Neurotrophic Markers Across Sickle Hemoglobin Genotypes. Multiple comparisons for each inflammatory marker using one-way ANOVA with Turkey’s comparison tests. Scatter plots indicate minimum and maximum mean plasma values observed. The following significant variations were observed across different sickle Hb genotypes: (A) BDNF: HbAA vs. HbSS (p < 0.0001), HbAA vs. HbCC (p < 0.0001), HbSS vs. HbAC (p = 0.0017), HbAC vs. HbCC (p = 0.0005) and HbAA vs. HbSC (p = 0.0069). (B) CXCL10: HbAA vs HbSS (P< 0.0001), HbAA vs HbAC (P = 0.0040) and HbSS vs HbSC (P = 0.0116) and HbSS vs HbAS (P = 0.0142). (C) Ang 2: HbSS vs. HbAA (p < 0.0001), HbSS vs. HbAS (p < 0.0001), HbSS vs. HbAC (p < 0.0001), HbSS vs. HbSC (p < 0.0001) and HbSS vs. HbCC (p = 0.0002). (D) IL-6: HbAA vs. HbSS (p < 0.0001) HbAS vs. HbSS (p < 0.0001), HbSS vs. HbAC (p = 0.0062) and HbAS vs. HbSC (p = 0.0349). (E) TNF-α: HbAA vs. HbSS (p = 0.0011), HbAS vs. HbSS (p = 0.0002) and HbSS vs. HbAC (P0.0017), HbSS vs. HbSC (p = 0.003). (F) Assessment of IL-1α in different sickle Hb genotypes: no significant differences observed. (G) Assessment of Ang 1 in different sickle Hb genotypes: no significant differences observed. Statistical significance are indicated as *p < 0.03–0.01; **p < 0.009–0.001; ***p < 0.0002–0.00019; ****p < 0.0001 ≤ 0.00001.
FIGURE 2
FIGURE 2
Scavenger proteins differ based on different sickle hemoglobin genotypes. Multiple comparison tests between Heme, heme scavengers, and sickle Hb genotypes using a one-way ANOVA test show significant differences in heme and scavenger protein expression across all sickle Hb genotypes. Scatter plots indicate minimum and maximum mean plasma values. The following assessments were made in: (A) Free heme levels (µM) between HbSS vs. HbAA (p < 0.0001), HbSS vs. HbAS (p < 0.0001), HbSS vs. HbAC (p < 0.0001) and HbSS vs. HbCC (p = 0.0002). Also, in HbAA vs. HbSC (p < 0.0001), (HbAS vs. HbSC (p < 0.0001), HbAS vs. HbAC (p < 0.0001), HbAC vs. HbSC (p < 0.0001) and HbSC vs. HbCC (p < 0.0001). (B) Haptoglobin levels (Pg/mL) in all genotypes: HbSS vs. HbAA (p < 0.0001), HbSC vs. HbAA (p < 0.0001), HbAS vs. HBSC (p < 0.0001), HbAC vs. HbAC (p < 0.0001), HbSS vs. HbAC (p = 0.0007) and HbAS vs. HbSS (p = 0.0013). (C) Hemopexin levels (Pg/mL) in HbAA vs. HbSC (p = 0.0416). (D) Plasma HO-1 levels (Pg/mL): HbSS vs. HbAA (p < 0.0001), HbSS vs. HbAS (p < 0.0001), HbSS vs. HbAC (p < 0.0001), HbSS vs. HbSC (p < 0.0001) and HbSS vs. HbCC (p = 0.0005). Statistical significances are indicated as *p < 0.03–0.01; **p < 0.009–0.001; ***p < 0.0002–0.00019; ****p < 0.0001 ≤ 0.00001.
FIGURE 3
FIGURE 3
Assessment of Heme, Heme scavengers, and Inflammatory marker ratios across all sickle Hb genotypes using multiple comparison tests. Log-relative heme-to-biomarker ratios were assessed to evaluate heme levels related to inflammatory markers and scavenger protein-to-biomarker ratios were used to evaluate inflammatory markers relative to scavenger proteins. Mean plasma ratios are represented by scatter plots showing maximum and minimum values. Specific mean plasma differences were observed in the following groups: (A) Heme:Ang 1: HbAA vs. HbSS (−3.310 ± 0.363 vs. −2.828 ± 0.380, p = 0.0037); HbAA vs. HbSC (−3.310 ± 0.363 vs. −2.397 ± 0.342, p < 0.0001); HbSS vs. HbAS (−2.828 ± 0.380 vs. −3.447 ± 0.305, p = 0.0001); HbSS vs. HbSC (−2.397 ± 0.342, p = 0.0131); HbSS vs. HbAC (−342.8 ± 36.4, p = 0.0003); HbSS vs. HbCC (−3.653 ± 0.444, p = 0.0013); HbAS vs. HbSC (−3.447 ± 0.305 vs. −2.397 ± 0.342, p < 0.0001); HbSC vs. HbAC (µ-2.397 ± 0.342 vs-342.8 ± 36.4, p < 0.0001); HbSC vs. HbCC (−3.447 ± 0.305 vs-3.653 ± 0.444, p < 0.0001). (B) Heme:CXCL10: HbAA vs. HbSS (−1.8210 ± 5.879 vs. −1.1680 ± 4.243, p = 0.0127); HbAA vs. HbSC (−1.8210 ± 5.879 vs. −0.4640 ± 7.215, p < 0.0001); HbSS vs. HbSC (−1.1680 ± 4.243 vs. −0.4640 ± 7.215, p = 0.0056), HbSS vs. HbAC (−1.1680 ± 4.243 vs. −1.7690 ± 3.629, p = 0.0372); HbAS vs. HbSC (−2.3160 ± 2.032 vs. −0.4640 ± 7.215, p < 0.0001); HbSC vs. HbAC (−0.4640 ± 7.215 vs. −1.7690 ± 3.629, p < 0.0001); HbSC vs. HbCC (−0.4640 ± 7.215 vs. −1.3640 ± 5.272, p = 0.0434). (C) Heme:Ang 2: HbAA vs. HbSC (−2.2620 ± 3.088 vs. 2.023 ± 210.6, p < 0.0001); HbSS vs. HbSC (−2.2530 ± 2.356 vs. −1.6530 ± 2.574, p < 0.0001); HbAS vs. HbSC (−2.702 ± 3.044 vs. −1.6530 ± 2.574, p < 0.0001); HbSC vs. HbAC (−1.6530 ± 2.574 vs. −2.6780 ± 2.899, p < 0.0001); HbSC vs. HbCC (−1.6530 ± 2.574 vs. −2.2810 ± 3.306, p = 0.0006). (D) Heme:BDNF: HbAA vs. HbSS (−2.5730 ± 3.555 vs. −2.2700 ± 2.503, p = 0.0489); HbAA vs. HbSC (−2.5730 ± 3.555 vs. −2.023 ± 210.6, p < 0.0001); HbSS vs. HbAS (−2.2700 ± 2.503 vs. −2.702 ± 3.044, p = 0.0017); HbSS vs. HbAC (−2.2700 ± 2.503 vs. −2.6780 ± 2.899, p = 0.0036); HbAS vs. HbSC (−2.702 ± 3.044 vs. −2.023 ± 210.6, p < 0.0001); HbSC vs. HbAC (−2.023 ± 210.6 vs. −2.6780 ± 2.899 p < 0.0001); HbSC vs. HbCC (−2.023 ± 210.6 vs. −3.0060 ± 4.114, p < 0.0001). (E) Heme:TNF-α: HbAA vs. HbSS (−0.300 ± 0.414 vs. 0.2208 ± 0.273, p = 0.0334); HbAA vs. HbSC (−0.300 ± 0.414 vs. 0.3986 ± 0.304, p > 0.0001); HbSS vs. HbSC (0.2208 ± 0.273 vs. 0.3986 ± 0.304, p = .00276); HbSS vs. HbAC (0.2208 ± 0.273 vs. −0.3890 ± 0.271, p = 0.0184); HbAS vs. HbSC (−0.3365 ± 0.424 vs. 0.3986 ± 0.304, p < 0.0001); HbSC vs. HbAC (0.3986 ± 0.304 vs-0.3890 ± 0.271, p < 0.0001); HbSC vs. HbCC (0.3986 ± 0.304 vs. µ = −0.4419 ± 0.311, p = 0.0001). (F) Heme:IL-6: HbAA vs. HbSS (−0.3256 ± 0.394 vs. 0.2208 ± 0.273, p = 0.0023); HbAA vs. HbSC (−0.3256 ± 0.394 vs. 0.5846 ± 0.515, p < 0.0001); HbSS vs. HbAS (0.2208 ± 0.273 vs. −0.3365 ± 0.424, p = 0.0028); HbSS vs. HbAC (0.2208 ± 0.273 vs. 0.2208 ± 0.273, p = 0.0008); HbAS vs. HbSC (−0.3365 ± 0.424 vs. 0.5846 ± 0.515, p < 0.0001); HbSC vs. HbAC (0.5846 ± 0.515 vs. 0.2208 ± 0.273, p < 0.0001); HbSC vs. HbCC (0.5846 ± 0.515 vs. −0.5202 ± 0.435, p < 0.0001). (G) CXCL10:HO-1: HbAA vs. HbSS (0.1090 ± 0.467 vs. 1.032 ± 0.480, p < 0.0001); HbAA vs. HbSC (0.1090 ± 0.467 vs. −0.9271 ± 0.421, p < 0.0001); HbSS vs. HbAS (1.032 ± 0.480 vs. −0.3424 ± 0.449, p = 0.0005); HbSS vs. HbAC (1.032 ± 0.480 vs. −0.3271 ± 0.333, p = 0.0003); HbAS vs. HbSC (−0.3424 ± 0.449 vs. −0.9271 ± 0.421, p = 0.0048); HbSC vs. HbAC (−0.9271 ± 0.421 vs. −0.3271 ± 0.333, p = 0.0035). (H) CXCL10:Hp: HbAA vs. HbSS (−6.050 ± 0.622 vs. −3.818 ± 0.502, P= <0.0001); HbAA vs. HbSC (−6.050 ± 0.622 vs. −4.551 ± 1.262, p < 0.0001); HbSS vs. HbAS (−3.818 ± 0.502 vs. −5.806 ± 0.695, p = 0.0006); HbSS vs. HbAC (−3.818 ± 0.502 vs. −5.772 ± 0.927, p = 0.0008); HbAS vs. HbSC (−5.806 ± 0.695 vs. −4.551 ± 1.262, p = 0.0004); HbSC vs. HbAC (−4.551 ± 1.262 vs. −5.772 ± 0.927, p = 0.0006). (I) Ang 2: HO-1: HbAA vs. HbSS (0.332 ± 0.219 vs. 0.052 ± 0.371, p < 0.0001); HbAA vs. HbAS (0.332 ± 0.219 vs. 0.321 ± 0.157, p = 0.0153); HbAA vs. HbSC (0.332 ± 0.219 vs. 0.261 ± 0.547, p = 0.0101); and HbSS vs. HbAC (0.052 ± 0.371 vs. 0.334 ± 0.301, p = 0.0101). (J) Ang 2:Hp: HbAA vs. HbSS (−5.609 ± 0.617 vs. −2.733 ± 0.469, p < 0.0001); HbAA vs. HbSC (−5.609 ± 0.617 vs. −2.901 ± 1.700 p < 0.0001); HbSS vs. HbAS (−2.733 ± 0.469 vs. −5.143 ± 0.946, p < 0.0001); HbSS vs. HbAC (−2.733 ± 0.469 vs. −5.111 ± 1.004, p < 0.0001); HbAS vs. HbSC (−5.143 ± 0.946 vs. −2.901 ± 1.700, p < 0.0001); HbSC vs. HbAC (−2.901 ± 1.700 vs. −5.111 ± 1.004, p < 0.0001). (K) Ang 2:Hpx: HbAA vs. HbSS (−5.180 ± 0.168 vs. −3.874 ± 0.778, p = 0.0061); HbAA vs. HbSC (−5.180 ± 0.168 vs. −4.354 ± 0.977, p = 0.0244); HbSS vs. HbAS (−3.874 ± 0.778 vs. −5.12 ± 0.171, p = 0.0141); HbAS vs. HbSC (−5.12 ± 0.171 vs. −4.354 ± 0.977, p = 0.0493). (L) BDNF:HO-1: HbAA vs. HbSS (0.643 ± 0.399 vs. 0.069 ± 0.359, p = 0.0003); HbSS vs. HbAS (0.069 ± 0.359 vs. 0.706 ± 0.352, p < 0.0001); HbSS vs. HbSC (0.069 ± 0.359 vs. 0.631 ± 0.370, p = 0.0004); HbSS vs. HbAC (0.069 ± 0.359 vs. 0.582 ± 0.339, p = 0.0027); HbSS vs. HbCC (0.069 ± 0.359 vs. 0.920 ± 0.084, p = 0.0009). (M) BDNF:Hp: HbAA vs. HbSS (5.298 ± 0.818 vs. −2.594 ± 1.503, p < 0.0001); HbAA vs. HbSC (−5.298 ± 0.818 vs. −2.594 ± 1.503, p < 0.0001); HbSS vs. HbAS (−2.594 ± 1.503 vs. −4.757 ± 1.048, p = 0.0007); HbSS vs. HbAC (−2.594 ± 1.503 vs. = -4.862 ± 0.905, p = 0.0004); HbAS vs. HbSC (−4.757 ± 1.048 vs. −2.594 ± 1.503, p = 0.0007); HbSC vs. HbAC (−2.594 ± 1.503 vs. −4.862 ± 0.905, p = 0.0004). (N) BDNF:Hpx: HbAA vs. HbSS (−4.870 ± 0.323 vs. −3.857 ± 0.599, p = 0.0163); HbAA vs. HbSC (−4.870 ± 0.323 vs. −3.671 ± 1.742, p = 0.0024); HbAS vs. HbSC (−1.736 ± 0.177 vs. −3.671 ± 1.742, p = 0.0136); HbSC vs. HbAC (−3.671 ± 1.742 vs. −4.697 ± 0.298, p = 0.0200). (O) TNF-α:HO-1: HbAA vs. HbSS (−1.630 ± 0.260 vs. −2.246 ± 0.342, p < 0.0001); HbSS vs. HbAS (−2.246 ± 0.342 vs. −1.736 ± 0.177, p = 0.0004); HbSS vs. HbSC (−2.246 ± 0.342 vs. −1.819 ± 0.392p = 0.0012); HbSS vs. HbAC (−2.246 ± 0.342 vs. −1.759 ± 0.219, p = 0.0007); HbSS vs. HbCC (−2.246 ± 0.342 vs. −1.643 ± 0.094, p = 0.0107). (P) TNF-α:Hp: HbAA vs. HbSS (−7.570 ± 0.610 vs. −5.031 ± 0.345, p < 0.0001); HbAA vs. HbSC (−7.570 ± 0.610 vs. −5.024 ± 2.058, P < p < 0.0001); HbSS vs. HbAS (−5.031 ± 0.345 vs. −7.200 ± 0.830, p < 0.0001); HbSS vs. HbAC (−5.031 ± 0.345 vs. −7.204 ± 0.942, p < 0.0001); HbAS vs. HbSC (−7.200 ± 0.830 vs. −5.024 ± 2.058, p < 0.0001); HbSC vs. HbAC (−5.024 ± 2.058 vs. −7.204 ± 0.942, p < 0.0001); (Q) TNF-α;Hpx: HbAA vs. HbSS (−7.142 ± 0.298 vs. −6.172 ± 0.711, p < 0.042); HbAA vs. HbSC (−7.142 ± 0.298 vs. −6.192 ± 1.843, p < 0.021); HbSS vs. HbAS (−6.172 ± 0.711 vs-7.181 ± 0.160, p < 0.021); HbAS vs. HbSC (−7.181 ± 0.160 vs. −6.192 ± 1.843, p < 0.021). (R) IL-6:HO-1: HbAA vs. HbSS (=−1.604 ± 0.244 vs. −2.421 ± 0.455, p < 0.0001); HbSS vs. HbAS (−2.421 ± 0.455 vs. −1.659 ± 0.297, p < 0.0001); HbSS vs. HbSC (−2.421 ± 0.455 vs. −1.976 ± 0.295, p = 0.0017); HbSS vs. HbAC (−2.421 ± 0.455 vs. −1.707 ± 0.223, p < 0.0001); HbSS vs. HbCC (−2.421 ± 0.455 vs. −1.565 ± 0.097, p < 0.0001); (S) IL-6:Hp: HbAA vs. HbSS (−7.545 ± 0.674 vs. −5.207 ± 0.426, p < 0.0001); HbAA vs. HbSC (−7.545 ± 0.674 vs. −4.828 ± 1.792, p < 0.0001); HbSS vs. HbAC (−5.207 ± 0.426 vs. −7.152 ± 0.963, p = 0.0009); HbAS vs. HbSC (−7.122 ± 0.907 vs. −4.828 ± 1.792, p < 0.0001); HbSC vs. HbAC (−4.828 ± 1.792 vs. −7.152 ± 0.963, p < 0.0001); (T) IL-6:Hpx: HbAA vs. HbSC (−7.117 ± 0.303 vs. −6.278 ± 1, p = 0.035). Statistical significance are indicated as *: p < 0.03–0.01; **: p < 0.009–0.001; ***: p < 0.0002–0.00019; ****: p < 0.0001 ≤ 0.00001.
FIGURE 4
FIGURE 4
Ratios of Circulating Inflammatory Markers Differ Across Different Sickle Hb Genotypes. Assessment of inflammatory marker concentration ratios across different sickle Hb genotypes. Multiple comparisons test was used to evaluate individual biomarker ratios between each Hb genotype. The mean plasma levels of log-transformed relative individual biomarker ratios were analyzed to determine varied interactions between inflammatory markers across the sickle Hb genotypes. The following mean plasma ratios differ significantly across sickle Hb genotypes: (A) CXCL10:Ang 2: HbAA vs. HbSC (−0.441 ± 0.443 vs. −1.189 ± 0.817 p = 0.0461). (B) CXCL10:TNF-α: HbAA vs. HbSC (1.521 ± 0.524 vs. 0.863 ± 0.704, p = 0.0033), HbAS vs. HbSC (1.394 ± 0.391vs 0.863 ± 0.704, p = 0.0414), HbSC vs. HbAC (0.863 ± 0.704 vs. 1.432 ± 0.323, p = 0.0230). (C) CXCL10:BDNF: HbAA vs. HbSC (−0.752 ± 0.704 vs. −1.558 ± 0.603, p = 0.0014), HbSC vs. HbAC (−1.558 ± 0.603 vs. −0.909 ± 0.393, p = 0.0240). (D) Ang 2:Ang 1: HbAA vs. HbSS (−1.048 ± 0.400 vs. −0.5747 ± 0.230, p = 0.0016), HbSS vs. HbAS, (−0.5747 ± 0.230 vs. −1.130 ± 0.224, p = 0.0002), HbSS vs. HbAC (−0.5747 ± 0.230 vs. −0.998 ± 0.256, p = 0.0093), HbSS vs. HbCC (−0.5747 ± 0.230 vs. −1.372 ± 0.116, p = 0.0006), HbAS vs. HbSC (−1.130 ± 0.224 vs. −0.744 ± 0.465, p = 0.023), HbSC vs. HbCC (−0.744 ± 0.465 vs. −1.372 ± 0.116, p = 0.0127). (E) IL-6:BDNF: HbAA vs. HbSC (−2.247 ± 0.397 vs. −2.607 ± 0.372, p = 0.0465). (F) BDNF:Ang 1: HbAA vs. HbSC (−0.737 ± 0.098 vs. −0.375 ± 0.199, p < 0.0001) HbAS vs. HbSC (−0.744 ± 0.069 vs. −0.375 ± 0.199, p < 0.0001) HbSC vs. HbAC (−0.375 ± 0.199 vs. −0.749 ± 0.173, p < 0.0001). (G) Ang 2:BDNF: HbSS vs. HbAS (−0.016 ± 0.214 vs. −0.385 ± 0.246, p = 0.0115) HbSS vs. HbSC (−0.016 ± 0.214 vs. −0.369 ± 0.355, p = 0.0127), HbSS vs. HbCC (−0.016 ± 0.214 vs-0.725 ± 0.089, p = 0.0006). Statistical significances are indicated as *p < 0.03–0.01; **p < 0.009–0.001; ***p < 0.0002–0.00019; ****p < 0.0001 ≤ 0.00001.
FIGURE 5
FIGURE 5
Predictive value of Circulating CXCL10, BDNF, Ang 1, Ang 2, IL-6, and TNF-α across Different Sickle Hb Genotypes. ROC analysis and its AUC were constructed to explore the usefulness of CXCL10, BDNF, Ang 1, Ang 2, IL-6, and TNF-α as potential biomarkers for predicting or as indicators of disease complications based on sickle status. Individual biomarkers independently discriminated between different Hb genotypes. The ROC plot indicated that these markers were good biomarkers: (A) CXCL10 between HbAA vs. HbSC (p < 0.0001, AUC = 0.98). (B) CXCL10: HbAA vs. HbSS (p < 0.0001, AUC = 1). (C) BDNF: HbAA vs. HbSS (p < 0.0001, AUC = 0.93). (D) BDNF: HbAA vs. HbSC (p = 0.0005, AUC = 0.86). (E) BDNF: HbSC vs. HbCC (p = 0.0025, AUC = 1. (F) Ang 2: HbAA vs. HbSS (p < 0.0001, AUC = 0.99). (G) IL-6: HbAA vs. HbSS (p < 0.0001, AUC = 0.92). (H) TNF-α: HbAA vs. HbSS (p = 0.0009, AUC = 0.84). The ROC analysis showed that CXCL10, BDNF, Ang 2, and IL-6 were effective in discriminating between different sickle Hb genotypes, with AUC values ranging from 0.86 to 1.0, indicating strong potential as predictive biomarkers for inflammatory risk and vascular complications in SCD.
FIGURE 6
FIGURE 6
ROC curve for Proinflammatory, Vascular, and Neurotrophic Marker Ratios Distinguishes SCD from Controls. ROC analyses were plotted to explore the diagnostic power of inflammatory mediators, vascular factors, and neurotrophic factors as indicators of SCD complications from healthy controls. The ROC plot indicated that these markers were potential biomarkers for predicting SCD crisis: (A) IL-6:IL-10: HbAA vs. HbSS AUC = 0.93, p = 0.0012. (B) TNF-α:IL-10 HbAA vs. HbSS AUC = 0.85, p = 0.0082. (C) IL-12A:IL-10: HbAA vs. HbSS AUC = 0.92, p = 0.0015. (D) Ang 2: Tie 2: HbAA vs. HbSS AUC = 0.98 p = 0.0003. (E) Ang 2 vs. Ang 1 HbAA vs. HbSS AUC = 0.93, p = 0.0012. (F) ICAM 1: VCAM 1: HbAA vs. HbSC AUC = 0.98, p = 0.0003. (G) VEGFA: Ang 2: HbAA vs. HbSS AUC = 1.00, p = 0.0002. (H) BDNF: CCL11: HbAA vs. HbSS AUC = 1.00, p = 0.0002. (I) VEGFA: PIGF: HbAA vs. HbSS AUC = 1.00, p = 0.0002. (J) Ang 2: VEGFA: AUC = 0.96, p = 0.0007). The AUC for most markers of SCD relative to healthy control individuals was between 0.85–1.00. It shows that these biomarkers were not only sensitive in discriminating between SCD and healthy control but were useful markers in predicting the risk of SCD complications.
FIGURE 7
FIGURE 7
Comparative Analysis of Inflammatory, Angiogenic, and Adhesion Marker Levels in SCD and Healthy Controls. Independent sample t-test assessed the comparisons of individual neuroinflammatory markers between SCD individuals (HbSS) and the control (HbAA). Box and whisper graph plots showing minimum and maximum mean plasma values. Significant increases/decreases were observed in SCD than healthy control in: (A) CCL11: p < 0.0001. (B) MIP-1β: p = 0.0248. (C) IL-12p40:p = 0.0237. (D) IL-16:p = 0.0021. (E) ICAM 1: p = 0.0018. (F) VCAM 1: p < 0.0001. (G) VEGFA: p = 0.018. (H) CXCL10: p = 0.012. (I) BDNF: p = 0.0001. (J) Ang 2: p = 0.012. (K) TNFα:p < 0.0001. (L) IL-6:p = 0.0034. (M) PIGF: p < 0.0001. (N) Fit-1: p = 0.0004. (O) Tie-2: p = 0.0005. (P) VEGF-D: p = 0.0111. (Q) BFGF:p = 0.0018. (R) MDC: p = 0.0001. (S) CRP: p < 0.0001. Statistical significances are indicated as *p < 0.03–0.01; **p < 0.009–0.001; ***p < 0.0002–0.00019; ****p < 0.0001 ≤ 0.00001.
FIGURE 8
FIGURE 8
Mean plasma Inflammatory Marker Concentrations Correlate with Hb levels, WBC, and RBC counts Across sickle cell Genotypes. A two-tailed Pearson correlation with a 95% confidence interval and a linear regression was used for all comparisons and shown as log-transformed. Squares with different colors represent individuals’ HB levels, WBC, and RBC counts correlated with mean plasma concentrations of biomarkers, including a solid line of best fit and a dotted 95% confidence bands. Specific correlations were observed in: (A) CXCL10 vs. Hb: R2 = 0.1780, p < 0.0001, and Y = −1.788*X + 14.04. (B) CXCL10 vs. RBC: R 2 = 0.1620, p = 0.0002 and Y = −0.9413*X + 6.018. (C) TNF-α vs. Hb: R 2 = 0.351, p < 0.0001 and Y = −4.334*X + 13.96. (D) TNF-α vs. WBC: R 2 = 0.1342, p = 0.0008 and Y = 4.412*X + 5.519. (E) TNF-α vs. RBC: R 2 = 0.2586, p < 0.0001 and Y = −1.989*X + 5.714. (F) Ang 2 vs. Hb: R 2 = 0.283, p < 0.0001 and Y = −3.752*X + 21.24. (G) Ang 2 vs. WBC: R 2 = 0.223, p < 0.0001 and Y = 4.464X - 3.815. (H) Ang 2 vs. RBC: R 2 = 0.245, p < 0.0001 and Y = −1.889X + 9.552. (I) Ang 1 vs. WBC: R 2 = 0.1307, p = 0.0001 and Y = 1.710X + 2.857. (J) IL-6 vs. Hb: R 2 = −0.252 p < 0.0001 and Y = −4.211*X + 13.95. (K) IL-6 vs. WBC: R 2 = 0.229, p < 0.0001 and Y = 5.521*X + 4.388. (L) IL-6 vs. RBC: R 2 = −0.1732, p = 0.0001 and Y = −1.809*X + 5.590.
FIGURE 9
FIGURE 9
Principal Component Analysis (PCA) of Inflammatory Marker and Hematological Variables across Sickle Hb Genotypes. PCA was applied to biomarkers (BDNF, Ang 2, CXCL10, IL-6, TNF-α) and CBC (WBC, HCT, Hb, and PLT) variables. A correlation matrix was employed due to the variables being measured in various units and between-group analysis. The dark olive green represents the HbSC group; the crimson represents the HbSS group, the blue-violet represents the HbAC, and the dark orange represents the HbAS group. The blue represents the HbAA group, and the aquamarine represents the HbCC group. (A) Overlapping PCA of Biomarker, Heme, heme scavengers, and CBC among all genotypes. The component 1 and 2 eigenvalue and percentage variance are 24.9% and 69.0% and 5.8% and 16.2%, respectively. (B) PCA of scavengers and CBC among the genotypes: The PC1 and PC2 eigenvalue and percentage variance are 22.5% and 75.2% and 5.7% and 18.9%, respectively. (C) Displays only selected inflammatory profiles (BDNF, Ang1 Ang2, IL-6, CXCL10, TNF-α) and CBC between SCD and healthy controls. Component 1 and 2 eigenvalue and percent variance are 4.85 (57.8%) and 1.0 (12.0%), respectively.

Similar articles

References

    1. Abdulmalik O., Pagare P. P., Huang B., Xu G. G., Ghatge M. S., Xu X., et al. (2020). VZHE-039, a novel antisickling agent that prevents erythrocyte sickling under both hypoxic and anoxic conditions. Sci. Rep. 10 (1), 20277. 10.1038/s41598-020-77171-2 - DOI - PMC - PubMed
    1. Akinsheye I., Klings E. S. (2010). Sickle cell anemia and vascular dysfunction: the nitric oxide connection. J. Cell. physiology 224 (3), 620–625. 10.1002/jcp.22195 - DOI - PubMed
    1. Akwii R. G., Sajib M. S., Zahra F. T., Mikelis C. M. (2019). Role of angiopoietin-2 in vascular physiology and pathophysiology. Cells 8 (5), 471. 10.3390/cells8050471 - DOI - PMC - PubMed
    1. Andrawes N. G., Ismail E. A., Roshdy M. M., Ebeid F. S. E., Eissa D. S., Ibrahim A. M. (2019). Angiopoietin-2 as a marker of retinopathy in children and adolescents with sickle cell disease: relation to subclinical atherosclerosis. J. Pediatr. Hematology/Oncology 41 (5), 361–370. 10.1097/MPH.0000000000001486 - DOI - PubMed
    1. Ansari J., Gavins F. N. (2019). Ischemia-reperfusion injury in sickle cell disease: from basics to therapeutics. Am. J. Pathology 189 (4), 706–718. 10.1016/j.ajpath.2018.12.012 - DOI - PMC - PubMed

LinkOut - more resources