. 2024 Dec 19:15:1493528.
doi: 10.3389/fimmu.2024.1493528. eCollection 2024.

Exploration and validation of a novel reactive oxygen species-related signature for predicting the prognosis and chemotherapy response of patients with bladder cancer

Affiliations

Exploration and validation of a novel reactive oxygen species-related signature for predicting the prognosis and chemotherapy response of patients with bladder cancer

Yulei Li et al. Front Immunol. .

Abstract

Background: Reactive Oxygen Species (ROS), a hallmark of cancer, is related to prognosis, tumor progression, and treatment response. Nevertheless, the correlation of ROS-based molecular signature with clinical outcome and immune cell infiltration has not been thoroughly studied in bladder cancer (BLCA). Accordingly, we aimed to thoroughly examine the role and prognostic value of ROS-related genes in BLCA.

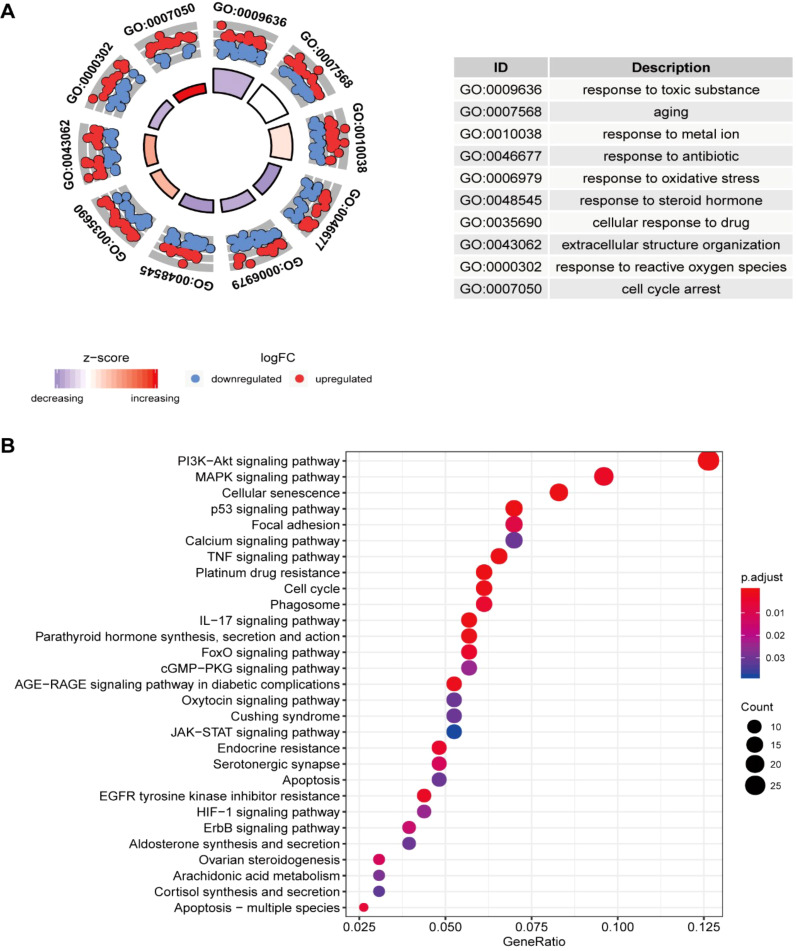
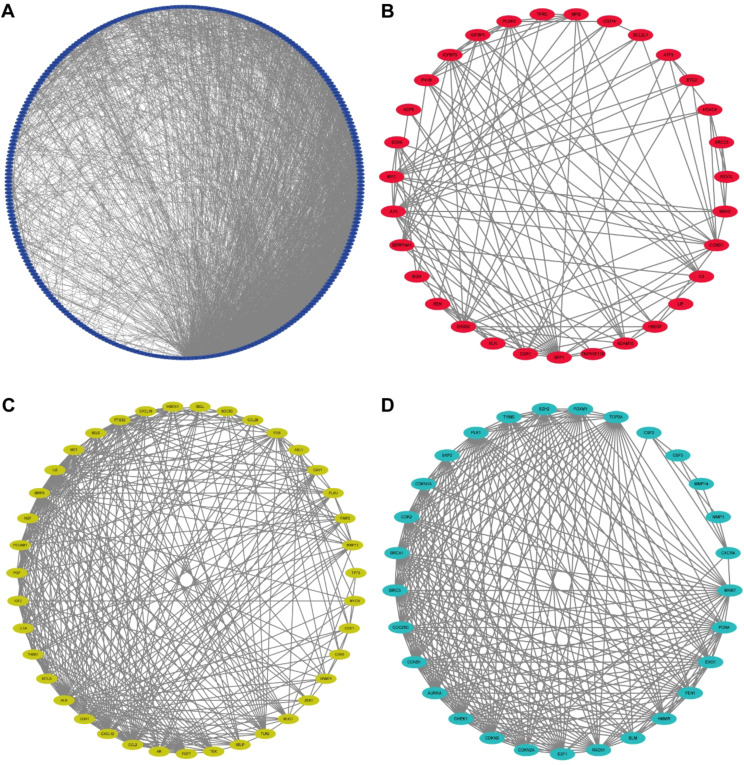
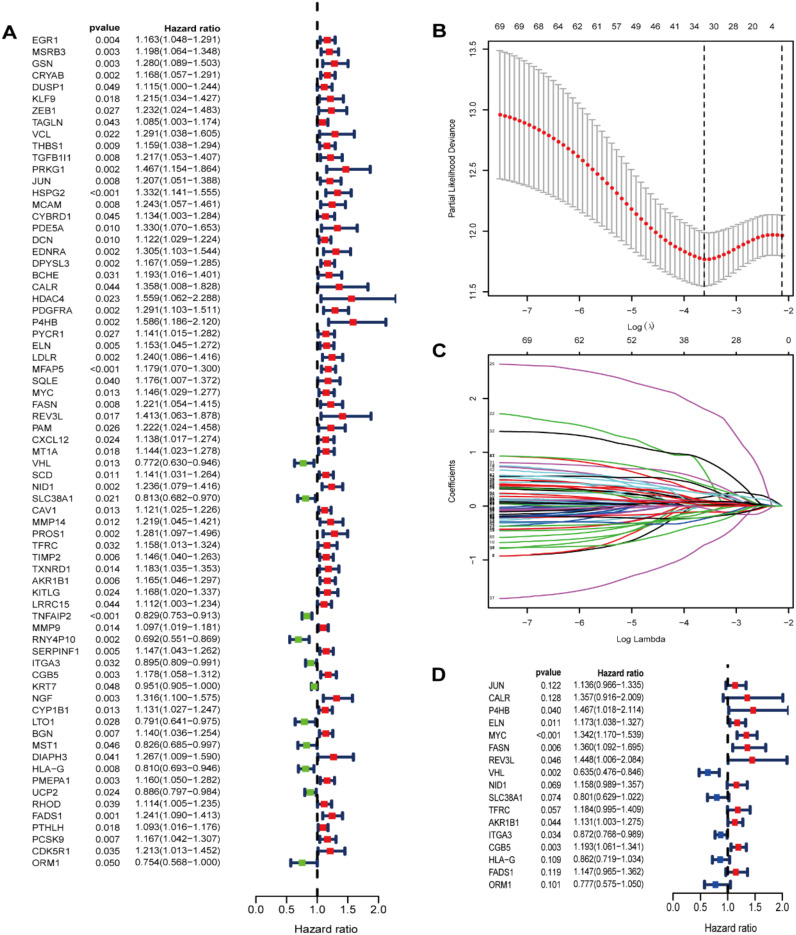
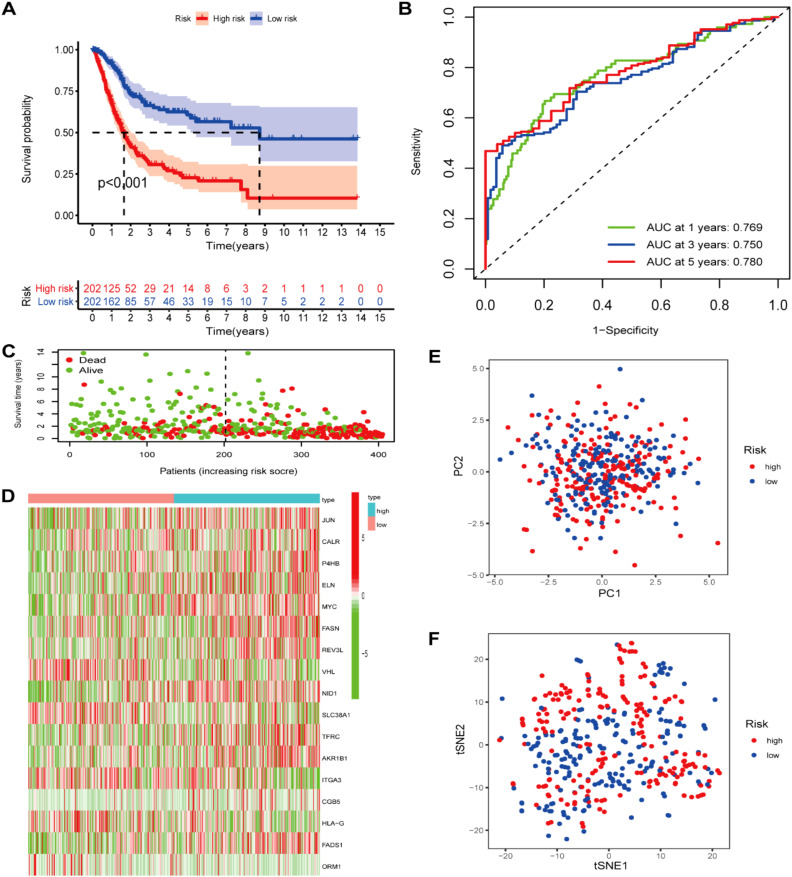
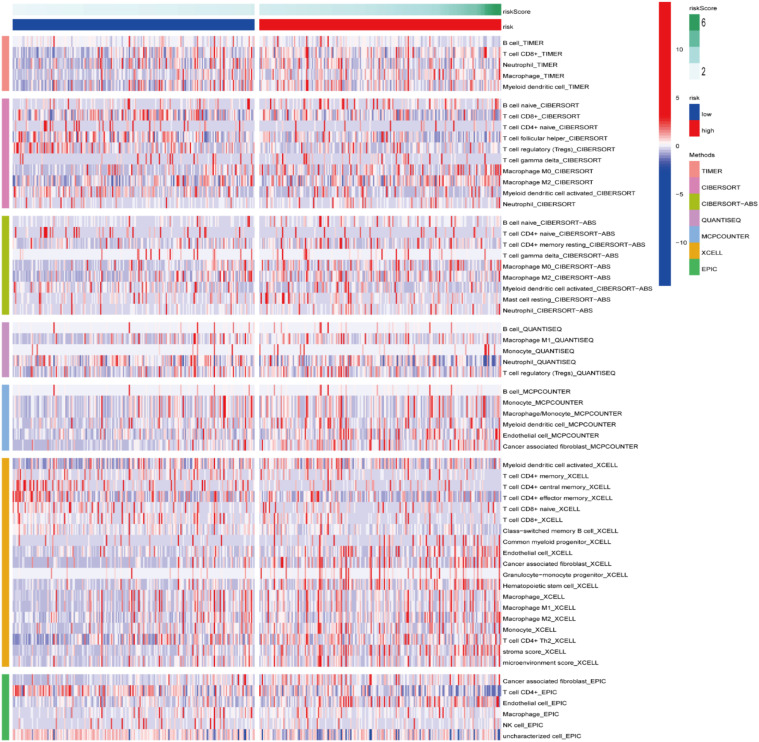
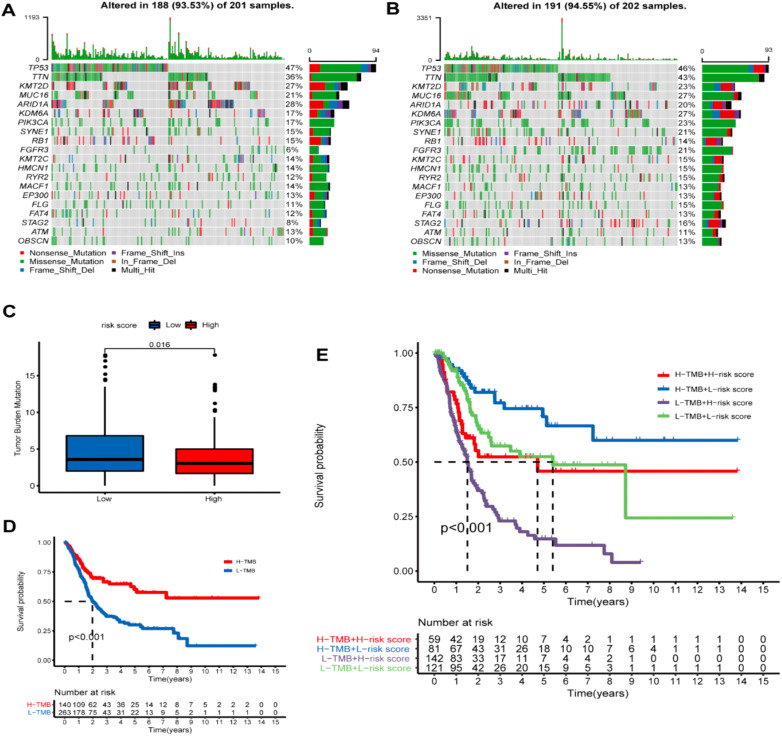
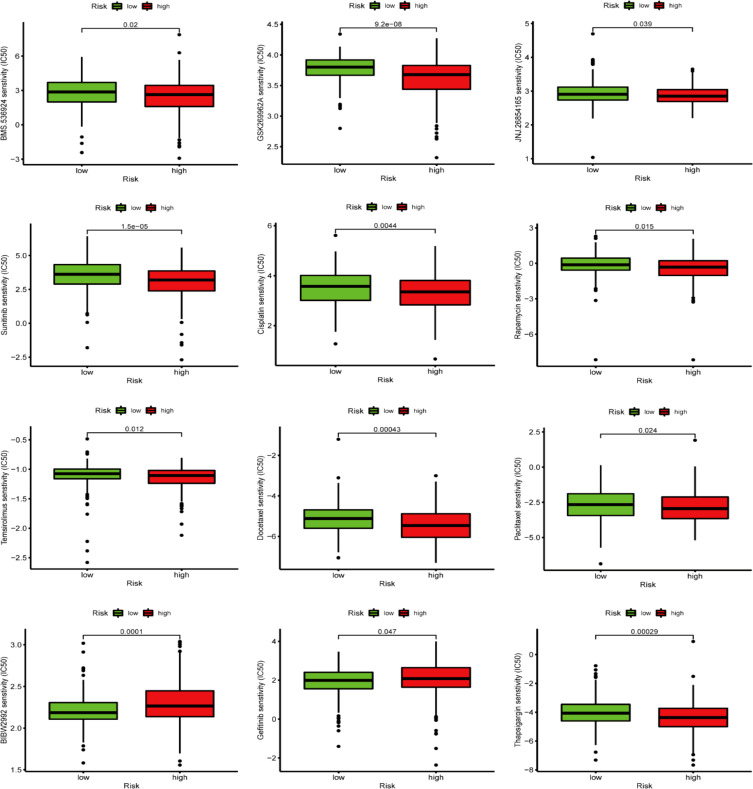
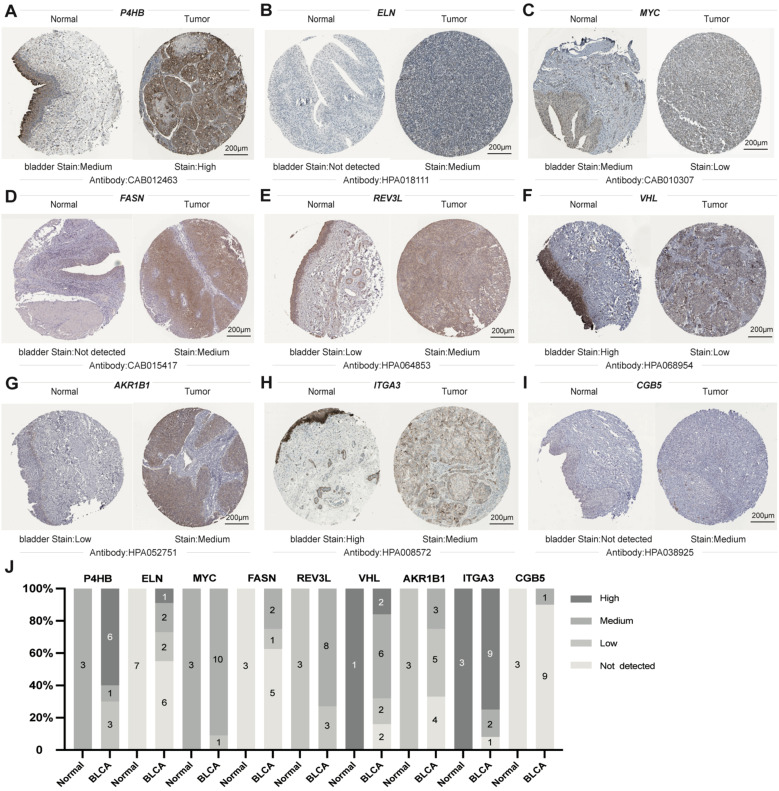
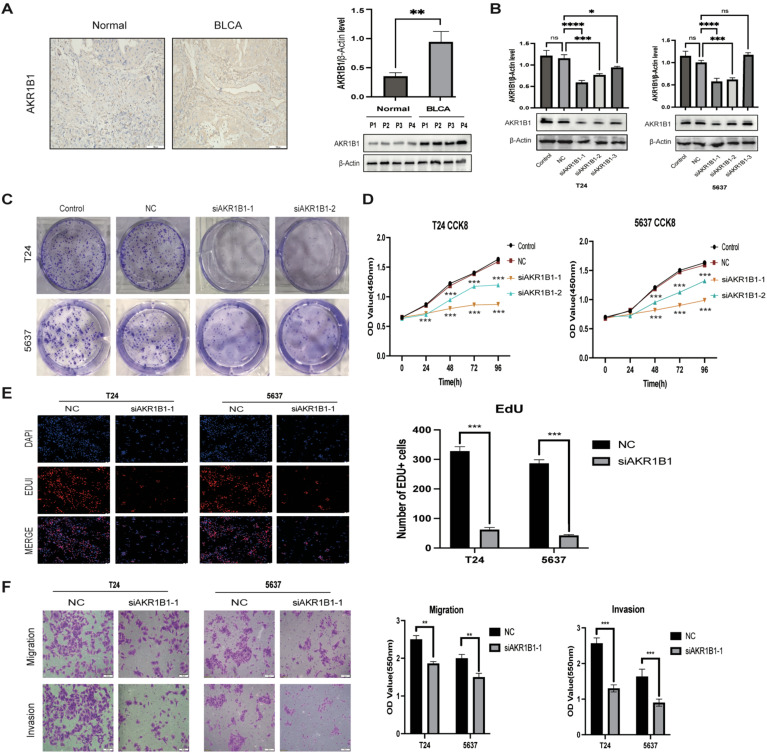
Methods: We obtained RNA sequencing and clinical data from The Cancer Genome Atlas (TCGA) for bladder cancer (BLCA) patients and identified ROS-associated genes using the GeneCards and Molecular Signatures Database (MSigDB). We then analyzed differential gene expression between BLCA and normal tissues and explored the functions of these ROS-related genes through Gene Ontology (GO), Kyoto Encyclopedia of Genes and Genomes (KEGG), and Protein-Protein Interaction (PPI) analysis. Prognostic ROS-related genes were identified using Univariate Cox regression (UCR) and LASSO analyses, which were further refined in a Multivariate Cox Regression (MCR) analysis to develop a Prognostic Signature (PS). This PS was validated in the GSE13507 cohort, assessing its predictive power with Kaplan-Meier survival and time-dependent ROC curves. To forecast BLCA outcomes, we constructed a nomogram integrating the PS with clinical variables. We also investigated the signature's molecular characteristics through Gene Set Enrichment Analysis (GSEA), Immune Cell Infiltration (ICI), and Tumor Mutational Burden (TMB) analyses. The Genomics of Drug Sensitivity in Cancer (GDSC) database was used to predict chemotherapy responses based on the PS. Additionally, we screened for Small-Molecule Drugs (SMDs) targeting ROS-related genes using the CMAP database. Finally, we validated our findings by checking protein levels of the signature genes in the Human Protein Atlas (HPA) and confirmed the role of Aldo-keto reductase family 1 member B1 (AKR1B1) through in vitro experiments.

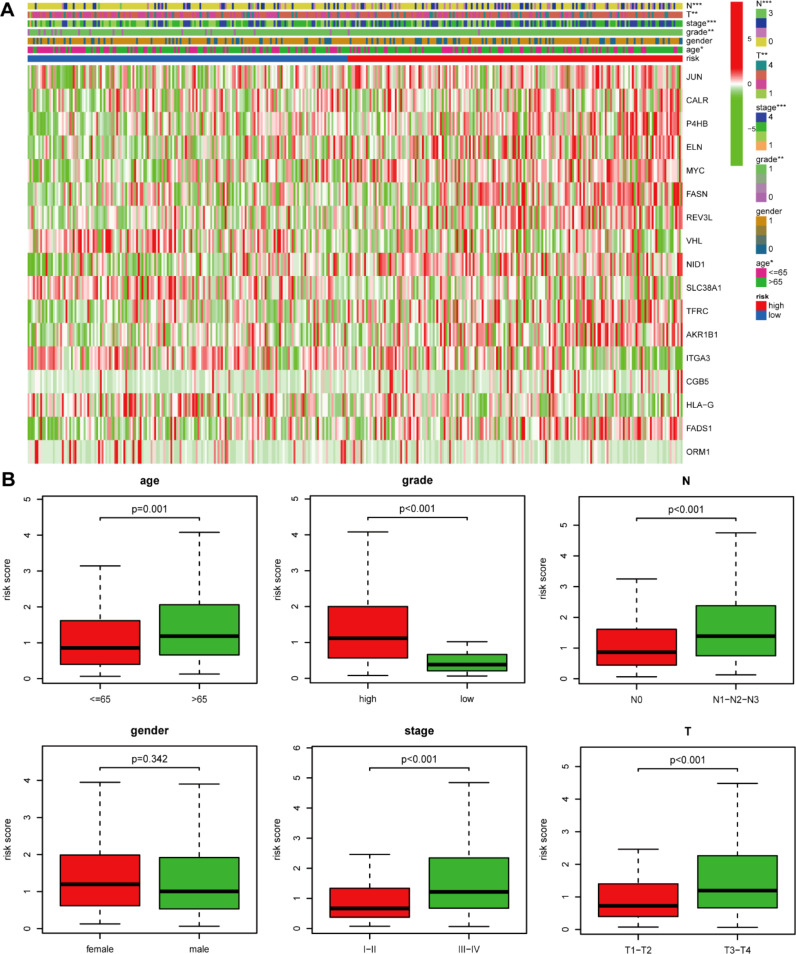
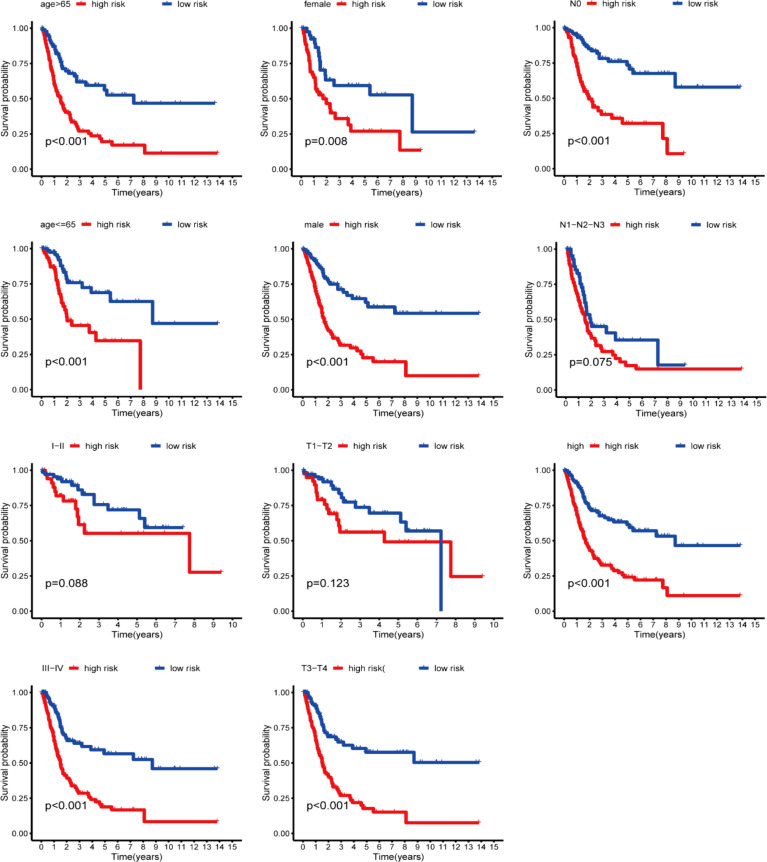
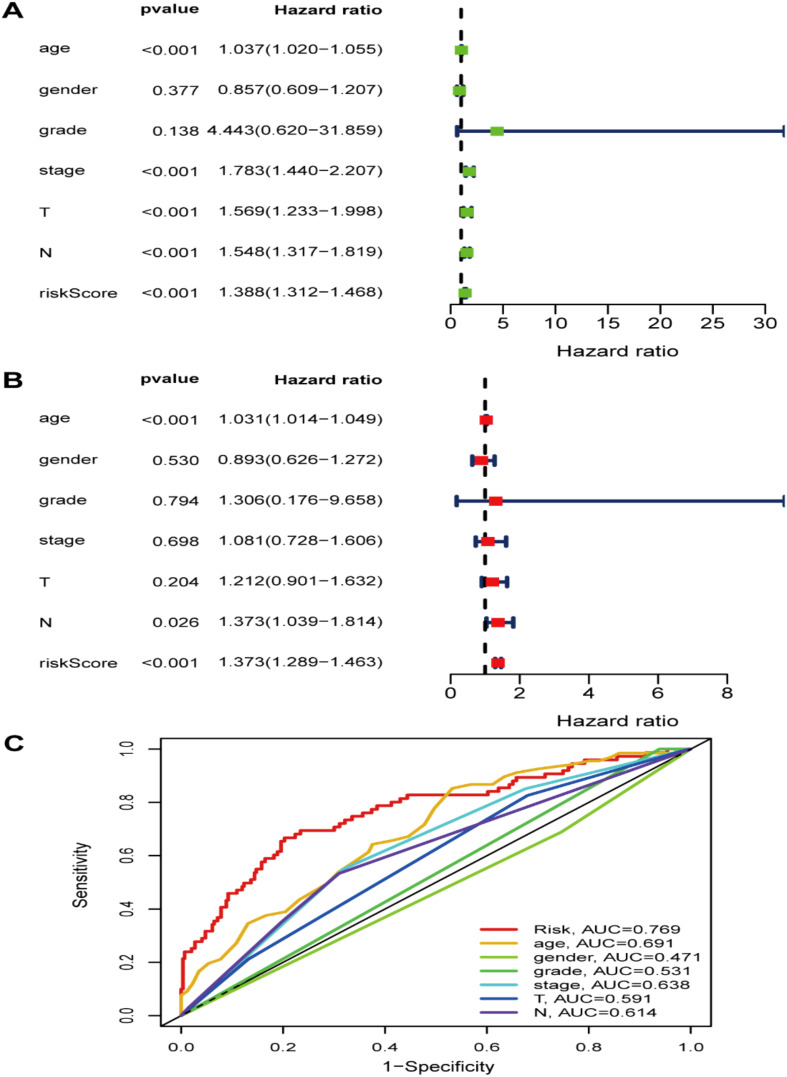
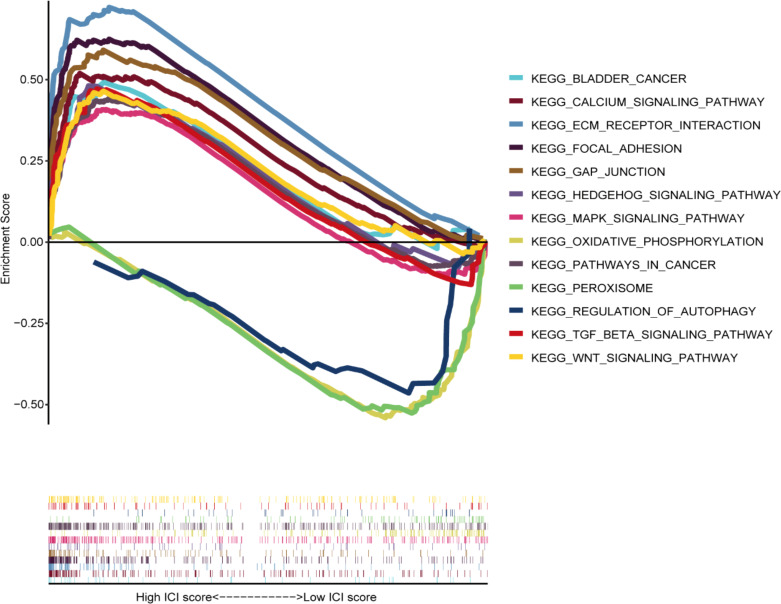
Results: The constructed and validated PS that comprised 17 ROS-related genes exhibited good performance in predicting overall survival (OS), constituting an independent prognostic biomarker in BLCA patients. Additionally, we successfully established a nomogram with superior predictive capacity, as indicated by the calibration plots. The bioinformatics analysis findings showcased the implication of PS in several oncogenic pathways besides tumor ICI regulation. The PS was negatively associated with the TMB. The high-risk group patients had greater chemotherapy sensitivity in comparison to low-risk group patients. Further, 11 candidate SMDs were identified for treating BLCA. The majority of gene expression exhibited a correlation with the protein expression. In addition, the expression of most genes was consistent with protein expression. Furthermore, to test the gene reliability we constructed, AKR1B1, one of the seventeen genes identified, was used for in-depth validation. In vitro experiments indicate that siRNA-mediated AKR1B1 silencing impeded BLCA cell viability, migration, and proliferation.

Conclusions: We identified a PS based on 17 ROS-related genes that represented independent OS prognostic factors and 11 candidate SMDs for BLCA treatment, which may contribute to the development of effective individualized therapies for BLCA.

Keywords: AKR1B1; bladder cancer; chemotherapy response; overall survival; prognostic signature; reactive oxygen species.


Conflict of interest statement

The authors declare that the research was conducted in the absence of any commercial or financial relationships that could be construed as a potential conflict of interest.

Figures

Figure 1
Figure 1
Enrichment analysis of ROS-related differentially expressed genes (DEGs) and PPI. (A) GO and (B) KEGG analyses.
Figure 2
Figure 2
Protein-protein interaction (PPI) network. (A) Protein-protein interaction (PPI) network of differentially expressed ROS-related genes. (B-D) Key models of PPI networks.
Figure 3
Figure 3
Identification of prognostic ROS-related genes in TCGA dataset. (A) Screening prognostic ROS-associated genes through univariate Cox regression analysis; (B) Incorporating the prognostic ROS-associated genes into the LASSO regression analysis; (C)The prognostic ROS-related genes were incorporated into the LASSO regression analysis. (D) Screening prognostic ROS-related genes through multivariate Cox regression analysis.
Figure 4
Figure 4
Prognostic ROS-based signature construction in TCGA dataset. (A) Kaplan-Meier survival analysis of BLCA patients between different groups; (B) Survival status distribution relying on the median risk score; (C)Time-independent ROC analysis of 5-year survival risk scores; (D) Heatmap showing the differences of 17 ROS-related genes between different groups. (E) PCA analysis; (F) t-SNE analysis.
Figure 5
Figure 5
The risk score and clinicopathological factor correlation in the TCGA dataset. (A) The heatmap (*: 0.01<P<0.05; **: 0.001<P<0.01; ***: P<0.001) and (B) Boxplot show the risk score and clinicopathological factor correlation.
Figure 6
Figure 6
Kaplan-Meier curves stratification of OS by gender, age, grade, or N/T/TNM stages between both risk groups.
Figure 7
Figure 7
The risk signature as an independent BLCA prognostic factor in the TCGA dataset. (A) The OS risk score and clinicopathological factor correlations by univariate and (B) multivariate Cox regression analysis. (C) ROC curves of the clinical characteristics and risk score.
Figure 8
Figure 8
The nomogram construction. (A) Nomogram predicting 3‐ or 5‐year OS. (B) Calibration plots predicting 3‐ and (C) 5‐year OS.
Figure 9
Figure 9
Gene set enrichment analysis among different groups.
Figure 10
Figure 10
Immune cell infiltration between both risk groups.
Figure 11
Figure 11
Tumor mutational burden (TMD) analysis. (A) Demonstrating the top 20 mutational genes within the high- and (B) low-risk groups. (C) TMB difference in both risk groups. (D) Kaplan-Meier (K-M) survival analysis of BLCA patients with high or low TMB. (E) K-M curve analysis stratification of OS by TMB and the prognostic signature.
Figure 12
Figure 12
GDSC database-based chemotherapy response prediction.
Figure 13
Figure 13
Sectional images of the differential expression of the above genes from the Human Protein Atlas. (A–I) representative images of P4HB (A), ELN (B), MYC (C), FASN (D), REV3L (E), VHL (F), AKR1B1 (G), ITGA3 (H), and CGB5 (I) protein expression from HPA databases. (J) Genes from HPA databases Statistical Column Stacked Plots of Characterized Protein Expression. Scale bar: 200μm.
Figure 14
Figure 14
(A) IHC representation chart and western blot (WB) showed AKR1B1 expression in normal bladder tissue and BLCA tissue. Scale bar: 100μm. (B) WB detection of AKR1B1 relative expression in control, NC, and siAKR1B1 groups. (C) Colony formation experiment results with AKR1B1 expression. (D) Results of silencing AKR1B1 expression at different time points of CCK-8:24, 48, 72, 96h. (E) Edu assay showing proliferating cells (T24 and 5637); Edu (red) and DAPI (blue) staining. Scale bar: 50μm. (F) Transwell assay results in control, NC, and siAKR1B1 groups. Scale bar: 100μm. *p < 0.05, **p < 0.01, ***p < 0.001, ****p < 0.0001, ns p > 0.05.

Similar articles

References

    1. Sung H, Ferlay J, Siegel RL, Laversanne M, Soerjomataram I, Jemal A, et al. . Global cancer statistics 2020: GLOBOCAN estimates of incidence and mortality worldwide for 36 cancers in 185 countries. CA Cancer J Clin. (2021) 71:209–49. doi: 10.3322/caac.21660 - DOI - PubMed
    1. Jubber I, Ong S, Bukavina L, Black PC, Compérat E, Kamat AM, et al. . Epidemiology of bladder cancer in 2023: A systematic review of risk factors. Eur Urol. (2023) 84:176–90. doi: 10.1016/j.eururo.2023.03.029 - DOI - PubMed
    1. Ren L, Jiang M, Xue D, Wang H, Lu Z, Ding L, et al. . Nitroxoline suppresses metastasis in bladder cancer via EGR1/circNDRG1/miR-520h/smad7/EMT signaling pathway. Int J Biol Sci. (2022) 18:5207–20. doi: 10.7150/ijbs.69373 - DOI - PMC - PubMed
    1. Patel VG, Oh WK, Galsky MD. Treatment of muscle-invasive and advanced bladder cancer in 2020. CA Cancer J Clin. (2020) 70:404–23. doi: 10.3322/caac.21631 - DOI - PubMed
    1. Jiang N, Liao Y, Wang M, Wang Y, Wang K, Guo J, et al. . BUB1 drives the occurrence and development of bladder cancer by mediating the STAT3 signaling pathway. J Exp Clin Cancer Res. (2021) 40:378. doi: 10.1186/s13046-021-02179-z - DOI - PMC - PubMed

Publication types