. 2025 Dec;14(1):2450025.
doi: 10.1080/22221751.2025.2450025. Epub 2025 Jan 13.

Novel digital droplet inverse PCR assay shows that natural clearance of hepatitis B infection is associated with fewer viral integrations

Affiliations

Novel digital droplet inverse PCR assay shows that natural clearance of hepatitis B infection is associated with fewer viral integrations

Dong Li et al. Emerg Microbes Infect. 2025 Dec.

Abstract

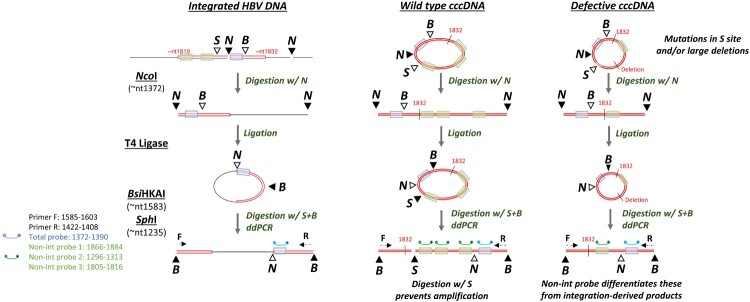
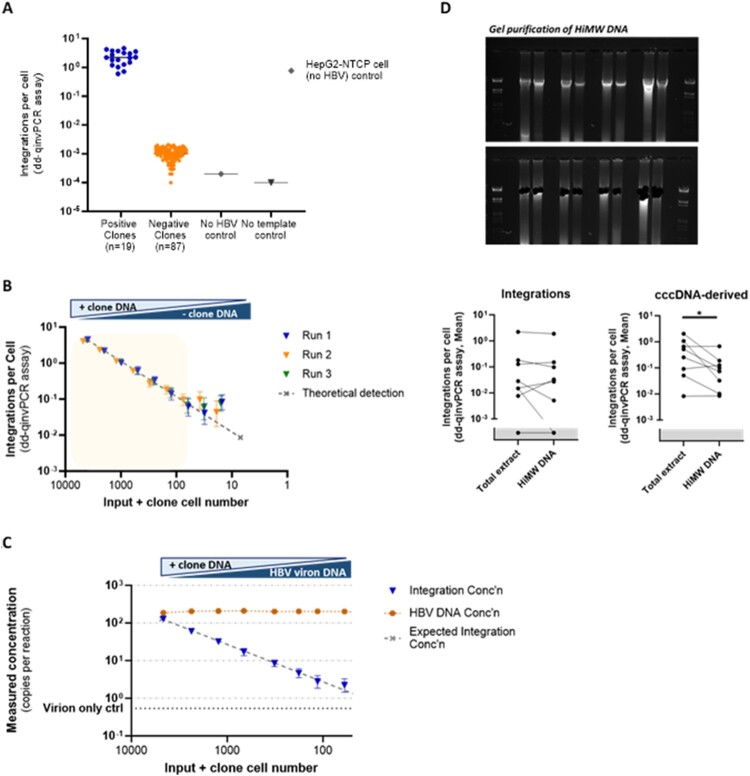
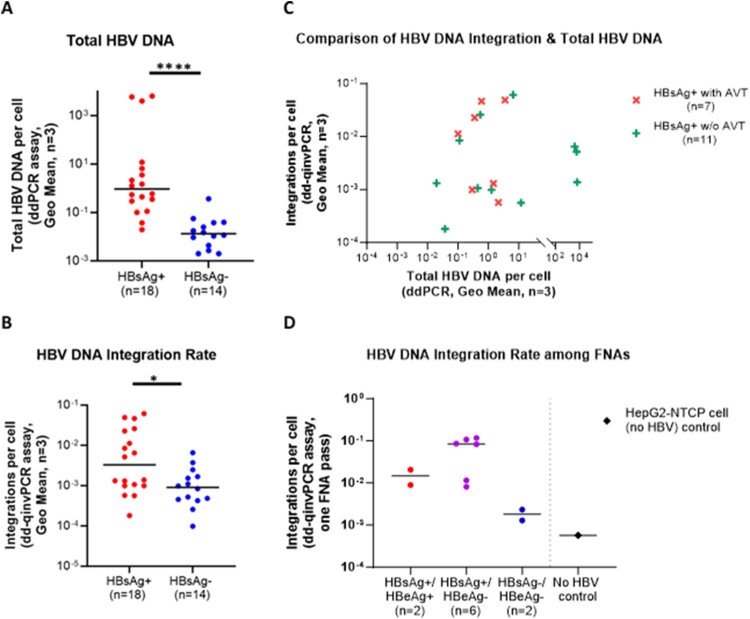
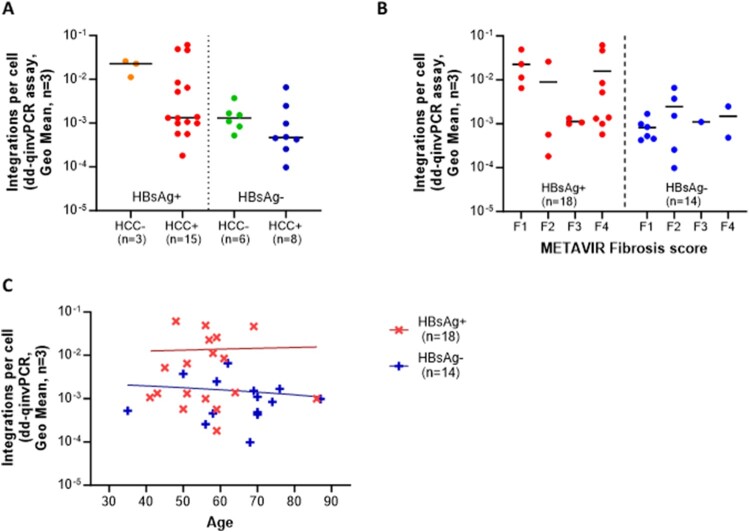
Hepatitis B virus (HBV) DNA integration into the host cell genome is reportedly a major cause of liver cancer, and a source of hepatitis B surface antigen (HBsAg). High HBsAg levels can alter immune responses which therefore contributes to the progression of HBV-related disease. However, to what extent integration leads to the persistent circulating HBsAg is unclear. Here, we aimed to determine if the extent of HBV DNA integration is associated with the persistence of circulating HBsAg in people exposed to HBV. We established a digital droplet quantitative inverse PCR (dd-qinvPCR) method to quantify integrated HBV DNA in patients who had been exposed to HBV (anti-HBc positive and HBeAg-negative). Total DNA extracts from both liver resections (n = 32; 14 HBsAg-negative and 18 HBsAg-positive) and fine-needle aspirates (FNA, n = 10; 2 HBsAg-negative and 8 HBsAg-positive) were analysed. Using defined in vitro samples for assay establishment, we showed that dd-qinvPCR could detect integrations within an input of <80 cells. The frequency of integrated HBV DNA in those who had undergone HBsAg loss (n = 14, mean ± SD of 1.514 × 10⁻³ ± 1.839 × 10⁻³ integrations per cell) was on average 9-fold lower than those with active HBV infection (n = 18, 1.16 × 10⁻² ± 1.76 × 10⁻² integrations per cell; p = 0.0179). In conclusion, we have developed and validated a highly precise, sensitive and quantitative PCR-based method for the quantification of HBV integrations in clinical samples. Natural clearance of HBV is associated with fewer viral integrations. Future studies are needed to determine if dynamics of integrated HBV DNA can inform the development of curative therapies.

Keywords: HBV DNA integration; HBsAg; digital droplet PCR; fine needle aspiration; functional cure.


Conflict of interest statement

No potential conflict of interest was reported by the author(s).

Figures

Figure 1.
Figure 1.
(A) Schematic diagram of dd-qinvPCR assay HBV cccDNA and integrated HBV DNA sequences (red) and cellular sequences (black) during enzymatic processing over the dd-qinvPCR protocol is shown schematically. The key HBV sequence between nt1372-nt1390 (highlighted in blue), nt1296-nt1313, nt1805-nt1816 and nt1866-nt1884 (highlighted in green). For integrated HBV DNA, the 3’ (right-hand) viral-cellular junction is excised by Ncol (N). Right-hand junction undergoes a T4 DNA ligation reaction, allowing DNA circularization. Circularized product is then cleaved by BsiHKAI (B) to form an inverted product, with viral sequences flanking cellular sequences. Finally, inverted products are cleaved by SphI (S) to minimize cccDNA-derived products. For wild-type cccDNA, the S site prevents the inverted HBV DNA amplifiable due to a double-stranded DNA break. A minority of defective cccDNA (contain mutations in S site and/or large deletions, shown as dashed lines) are consequently lack the S site, which allows the inverted HBV DNA amplifiable. The inverted product is then quantified using ddPCR and its forward primer (F) and reverse primer (R). The probe (blue) binds to sequences (highlighted in blue) that exist in both integrated and cccDNA forms; the probes (green) bind to sequences only present in cccDNA form (absent in integrated forms, highlighted in green). RE sites are shown as triangles (solid colouring indicates the reaction at this step); RE digestions during the steps are indicated as arrows; nt: nucleotide. Figure adapted from [21], based on the nucleotide numbering of the HBV DNA sequence outlined in GenBank accession number U95551.1. (B). ddPCR reading use drop-off assay to exclude the products with HBV sequences not expected in integrated DNA. The fluorophore FAM is used to label total probe which binds to the sequences existing in both integrated and cccDNA forms, HEX is used to label non-integrated probes which only bind to the sequences present in cccDNA forms, allowing the simultaneous detection of two different targets in the same reaction. Orange points indicate cccDNA amplicon, and blue points represent HepG2-NTCP Zeo clones. Y-axis represents the FAM signal amplitude (the total HBV DNA probe); X-axis represents the HEX signal amplitude (the cccDNA specific probe).
Figure 2.
Figure 2.
The sensitivity and specificity for dd-qinvPCR assay to quantify integrated HBV DNA. (A) The sensitivity of dd-qinvPCR assay integrated HBV DNA was quantified in DNA extracted from 106 HepG2-NTCP Zeo clones by dd-qinvPCR, these were performed in duplex with reference gene RNaseP (2 copies/cell) for normalization. Inverted DNA that tested positive for integrations among 19 clones (blue points), and significantly above 87 negative clones, uninfected HepG2-NTCP cells (no HBV) and no template control. (B) The linearity of dd-qinvPCR assay was determined by titrating down the positive clone DNA input from 1 μg to 4 nanogram (ng), while DNA from a negative clone was increased to maintain constant DNA input. The integration rates of three repeated runs (triangles in blue, orange and green), the expected integration rate per serial dilution is shown as dashed line, X-axis shows the equivalent input positive clone cell number (C). The specificity of dd-qinvPCR assay for integrated HBV DNA in relation to HBV DNA replicative intermediates DNA from a positive clone was titrated from 1 μg to 4 ng, while supplemented with virion-derived HBV DNA to maintain constant HBV DNA integration rates. dd-qinvPCR was used to quantify the integrated HBV DNA concentration (blue triangles) and total HBV DNA concentration (orange squares). X-axis shows the equivalent input positive clone cell number. The expected concentration (in absolute copies per microliter) assuming 100% detection efficiency is shown as dashed line. False positive signals for integration came up at ratios of 1 copy per ∼300 copies of virion DNA (virion only control in dash line). (D) The specificity of dd-qinvPCR assay by analysing both total and high molecular weight (HiMW) DNA. HiMW DNA was isolated through agarose gel electrophoresis of 1–5 μg of total liver DNA extract. Using dd-qinvPCR assay to quantify the integration rates of HBV DNA in paired total and HiMW preparations of the same DNA extract, there was no significant difference (left, p = 0.349, ratio paired t-test); the HiMW DNA samples showed ∼10 times lower integration rates of cccDNA (right, p = 0.032, ratio paired t-test).
Figure 3.
Figure 3.
Intrahepatic total HBV DNA and integration rates in patients. (A) Quantified total HBV DNA in HBsAg-positive (n = 18) or HBsAg-negative (n = 14, undergone functional cure) by ddPCR, significantly lower integration rates (p < 0.0001) of total HBV DNA were observed in the HBsAg-loss group compared to those with chronic HBV infection. (3) Quantified integration rates using dd-qinvPCR, the integrated HBV DNA in HBsAg loss group (n = 14) was significantly lower (p = 0.0179) than active HBV infection (n = 18). (C) Comparison of intrahepatic copies of integrated HBV DNA per cell and total HBV qPCR among HBsAg-positive patients that under antiviral treatment (n = 7) or those without treatment (n = 11). No significant association was observed between total HBV DNA and the integration rates of integrated HBV DNA in antiviral treatment group (r2 = 0.1083; p = 0.471), or treatment naïve group (r2 = 0.0447; p = 0.533). HBsAg-positive patients under antiviral treatment did not have significantly different integration rates of HBV DNA integrations compared to those not under treatment (1.90 × 10−2 ± 2.13 × 10−2 vs 1.03 × 10−2 ± 1.85 × 10−2, p = 0.479). Integrations per cell and total HBV DNA represent the Geometric Mean of those 3 fragments. (D) Comparison of copies of integrated HBV DNA per cell in patient FNAs among 10 patients underwent FNA, 2 patients are active hepatitis B infection (HBsAg-positive and HBeAg-positive), 6 patients are chronic hepatitis B infection (HBsAg-positive and HBeAg-negative), 2 patients are no active hepatitis B infection (HBsAg-negative and HBeAg-negative). The copies of detected integrated DNA per cell are 5-fold higher (median 0.8431 vs 0.01478) in chronic infection patients (n = 6) than active infection (n = 2). Compared with uninfected HepG2-NTCP cells (no HBV), the integrated HBV DNA in HBsAg-negative patients (n = 2) is detectable and significantly lower (p = 0.0444, Mann–Whitney test) than HBsAg-positive(n = 8) group.
Figure 4.
Figure 4.
Intrahepatic integrated HBV DNA integration rates among patients with different clinical features. (A) Integration vs. HCC no significant difference in integration rate was observed (p = 0.246) between HCC + (n = 23) and HCC− groups (n = 9). (B) Integration vs. fibrosis stage no correlation with fibrosis stage in HBsAg-positive (n = 18) and HBsAg-negative (n = 14) groups. Fibrosis grades were classified using the METAVIR scoring system [49] determined by liver histology: F1 means portal fibrosis without septa, F2 means few septa, F3 means numerous septa without cirrhosis, F4 means cirrhosis. (C) Integration vs. age no significant relationship between age and integration rates were observed by linear regression in HBsAg-positive (n = 18, p = 0.888) or HBsAg-negative (n = 14, p = 0.648) cohorts. Integrations per cell are represented by the geometric mean of 3 liver fragments per patient.

Similar articles

Cited by

References

    1. Global hepatitis report 2024: action for access in low- and middle-income countries. States News Service. 2024.
    1. Lampertico P, Agarwal K, Berg T, et al. . EASL 2017 clinical practice guidelines on the management of hepatitis B virus infection. J Hepatol. 2017;67(2):370–398. doi:10.1016/j.jhep.2017.03.021 - DOI - PubMed
    1. Tu T, Block JM, Wang S, et al. . The lived experience of chronic hepatitis B: a broader view of its impacts and why we need a cure. Viruses. 2020;12(5):515. doi:10.3390/v12050515 - DOI - PMC - PubMed
    1. Cornberg M, Lok ASF, Terrault NA, et al. . Guidance for design and endpoints of clinical trials in chronic hepatitis B—report from the 2019 EASL-AASLD HBV treatment endpoints conference. Hepatology (Baltimore. Md). 2020;71(3):1070–1092. doi:10.1002/hep.31030 - DOI - PubMed
    1. Fattovich G, Olivari N, Pasino M, et al. . Long-term outcome of chronic hepatitis B in Caucasian patients: mortality after 25 years. Gut. 2008;57(1):84–90. doi:10.1136/gut.2007.128496 - DOI - PubMed