. 2025 Jan;31(1):e70011.
doi: 10.1111/gcb.70011.

Human Footprint and Forest Disturbance Reduce Space Use of Brown Bears (Ursus arctos) Across Europe

Affiliations

Human Footprint and Forest Disturbance Reduce Space Use of Brown Bears (Ursus arctos) Across Europe

Anne G Hertel et al. Glob Chang Biol. 2025 Jan.

Abstract

Three-quarters of the planet's land surface has been altered by humans, with consequences for animal ecology, movements and related ecosystem functioning. Species often occupy wide geographical ranges with contrasting human disturbance and environmental conditions, yet, limited data availability across species' ranges has constrained our understanding of how human pressure and resource availability jointly shape intraspecific variation of animal space use. Leveraging a unique dataset of 758 annual GPS movement trajectories from 375 brown bears (Ursus arctos) across the species' range in Europe, we investigated the effects of human pressure (i.e., human footprint index), resource availability and predictability, forest cover and disturbance, and area-based conservation measures on brown bear space use. We quantified space use at different spatiotemporal scales during the growing season (May-September): home range size; representing general space requirements, 10-day long-distance displacement distances, and routine 1-day displacement distances. We found large intraspecific variation in brown bear space use across all scales, which was profoundly affected by human footprint index, vegetation productivity, and recent forest disturbances creating opportunity for resource pulses. Bears occupied smaller home ranges and moved less in more anthropized landscapes and in areas with higher resource availability and predictability. Forest disturbances reduced space use while contiguous forest cover promoted longer daily movements. The amount of strictly protected and roadless areas within bear home ranges was too small to affect space use. Anthropized landscapes may hinder the expansion of small and isolated populations, such as the Apennine and Pyrenean, and obstruct population connectivity, for example between the Dinaric Pindos population and the Alpine or Carpathian population. Our findings call for actions to maintain bear movements across landscapes with high human footprint, for example by maintaining forest integrity, to support viable bear populations and their ecosystem functions.

Keywords: Ursus arctos; GPS telemetry; anthropocene; connectivity; human footprint; intraspecific variation; movement; resource availability.


Conflict of interest statement

The authors declare no conflicts of interest.

Figures
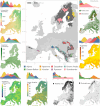
FIGURE 1
FIGURE 1
Within the BearConnect initiative, we compiled GPS movement data from eight of the ten extant brown bear populations in Europe. Using data from the summer growing season (May–September) we estimated individual home ranges (main panel, colored by population) which covered a substantial amount of the current permanent occurrence range of the brown bear in Europe (main panel dark gray, Kaczensky et al. 2021). For each home range we extracted the median temperature seasonality (Bio4 in WorldClim, Fick and Hijmans 2017), median annual vegetation productivity (Copernicus 2020), median vegetation predictability (estimated from MODIS NDVI with equations by Colwell (1974)), median human footprint index (Venter et al. 2016), proportion of roadless (Ibisch et al. 2016) and strictly protected areas (World Database on Protected Areas), median terrain ruggedness index (calculated from a European digital elevation model), and proportion of forest cover and disturbance (Senf and Seidl 2021). Density plots show the distribution of covariates for each population.
FIGURE 2
FIGURE 2
Population and sex‐specific sample sizes (n annual bear tracks) and respective distribution of space use metrics: Home range sizes (km2), 10‐day and 1‐day displacement distances (km), collected for eight European brown bear populations. Boxplots extend from the population and sex‐specific 25th to 75th percentile, with the mean as horizontal line and the data range as whiskers. Male bears generally occupied larger home ranges and moved more than females. All space use metrics were log‐transformed for analyses but Y‐axis labels are given at the km2/km scale to facilitate interpretation.
FIGURE 3
FIGURE 3
Posterior distributions of covariate coefficients on home range size (a), 10‐day long distance displacements (b), and 1‐day routine displacements (c) of brown bears across Europe. Black dots and credible intervals indicate the mean and 89% equal tail intervals of the posterior distribution. Significance was inferred based on 89% equal tail intervals not overlapping 0. Across spatiotemporal scales, we found consistent effects of sex, vegetation productivity, human footprint index, and the proportion of forest disturbances on bear space use. See also Table S5 for all model coefficients.
FIGURE 4
FIGURE 4
Conditional effects (mean and 95% uncertainty interval) of vegetation productivity, the proportion of early successional forest, and human footprint index on home range size, long‐distance displacements, and routine displacements of brown bears across Europe. Conditional effects were estimated by setting all other model covariates to their mean value and using females as reference category. These three covariates significantly affected space use across spatiotemporal scales. Space use decreased with increasing vegetation productivity (a, d, g), with an increasing proportion of recent forest disturbances (i.e., early successional forest) in a bear's home range (b, e, h), and with increasing median human footprint index in the home range (c, f, i). See also Figure S3 for effect sizes of vegetation predictability and temperature seasonality.
FIGURE 5
FIGURE 5
Between‐population differences after accounting for fixed covariates are shown as the posterior distribution of the random intercept for each study population of brown bears in Europe. Continental model intercepts (mean ± CI) are shown in gray and were on average 140 km2 for home range size, 18 km for 10‐day displacements, and 3.4 km for daily displacements. Point estimates for population random intercepts in (a) home range size ranged from 95 to 287 km2, in (b) 10‐day displacements ranged from 13 to 40 km, and (c) in 1‐day displacements ranged from 2.6 to 4.3 km.

References

    1. Abrahms, B. , Carter N. H., Clark‐Wolf T. J., et al. 2023. “Climate Change as a Global Amplifier of Human–Wildlife Conflict.” Nature Climate Change 13, no. 3: 224–234. 10.1038/s41558-023-01608-5. - DOI
    1. Barnosky, A. D. , Hadly E. A., Bascompte J., et al. 2012. “Approaching a State Shift in Earth's Biosphere.” Nature 486, no. 7401: 52–58. 10.1038/nature11018. - DOI - PubMed
    1. Bartley, T. J. , McCann K. S., Bieg C., et al. 2019. “Food Web Rewiring in a Changing World.” Nature Ecology & Evolution 3, no. 3: 345–354. 10.1038/s41559-018-0772-3. - DOI - PubMed
    1. Bartoń, K. A. , Zwijacz‐Kozica T., Zięba F., Sergiel A., and Selva N.. 2019. “Bears Without Borders: Long‐Distance Movement in Human‐Dominated Landscapes.” Global Ecology and Conservation e00541: e00541. 10.1016/j.gecco.2019.e00541. - DOI
    1. Bautista, C. , Revilla E., Berezowska‐Cnota T., Fernández N., Naves J., and Selva N.. 2021. “Spatial Ecology of Conflicts: Unravelling Patterns of Wildlife Damage at Multiple Scales.” Proceedings of the Royal Society B: Biological Sciences 288: 20211394. 10.1098/rspb.2021.1394. - DOI - PMC - PubMed

LinkOut - more resources