

Online-adjusted evolutionary biclustering algorithm to identify significant modules in gene expression data
- PMID: 39749664
- PMCID: PMC11695933
- DOI: 10.1093/bib/bbae681
Online-adjusted evolutionary biclustering algorithm to identify significant modules in gene expression data
Abstract
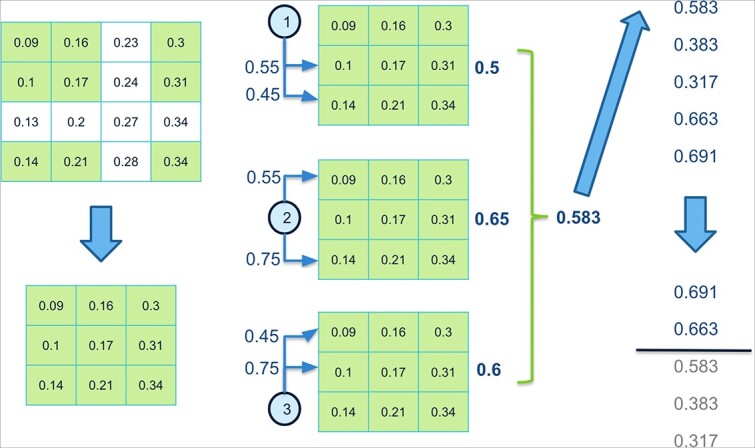
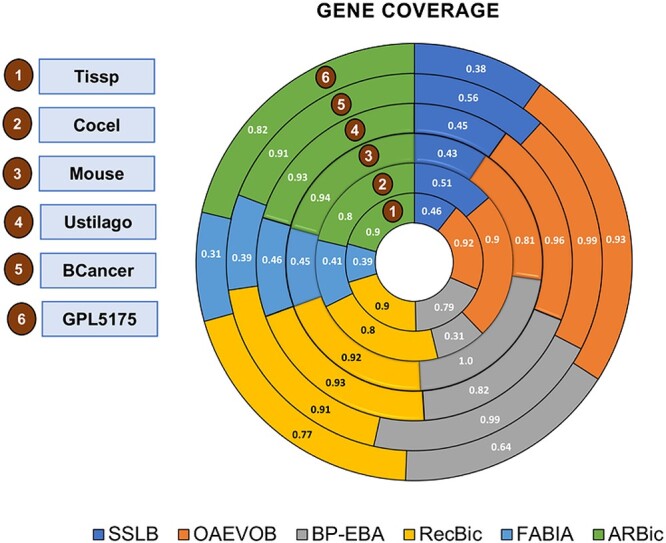
Analyzing gene expression data helps the identification of significant biological relationships in genes. With a growing number of open biological datasets available, it is paramount to use reliable and innovative methods to perform in-depth analyses of biological data and ensure that informed decisions are made based on accurate information. Evolutionary algorithms have been successful in the analysis of biological datasets. However, there is still room for improvement, and further analysis should be conducted. In this work, we propose Online-Adjusted EVOlutionary Biclustering algorithm (OAEVOB), a novel evolutionary-based biclustering algorithm that efficiently handles vast gene expression data. OAEVOB incorporates an online-adjustment feature that efficiently identifies significant groups by updating the mutation probability and crossover parameters. We utilize measurements such as Pearson correlation, distance correlation, biweight midcorrelation, and mutual information to assess the similarity of genes in the biclusters. Algorithms in the specialized literature do not address generalization to diverse gene expression sources. Therefore, to evaluate OAEVOB's performance, we analyzed six gene expression datasets obtained from diverse sequencing data sources, specifically Deoxyribonucleic Acid microarray, Ribonucleic Acid (RNA) sequencing, and single-cell RNA sequencing, which are subject to a thorough examination. OAEVOB identified significant broad gene expression biclusters with correlations greater than $0.5$ across all similarity measurements employed. Additionally, when biclusters are evaluated by functional enrichment analysis, they exhibit biological functions, suggesting that OAEVOB effectively identifies biclusters with specific cancer and tissue-related genes in the analyzed datasets. We compared the OAEVOB's performance with state-of-the-art methods and outperformed them showing robustness to noise, overlapping, sequencing data sources, and gene coverage.
Keywords: RNA-sequencing; biclustering; evolutionary algorithm; gene expression data; single-cell RNA-sequencing.
© The Author(s) 2025. Published by Oxford University Press.
Figures


Similar articles
-
POPBic: Pathway-Based Order Preserving Biclustering Algorithm Towards the Analysis of Gene Expression Data.IEEE/ACM Trans Comput Biol Bioinform. 2021 Nov-Dec;18(6):2659-2670. doi: 10.1109/TCBB.2020.2980816. Epub 2021 Dec 8. IEEE/ACM Trans Comput Biol Bioinform. 2021. PMID: 32175872
-
Parallelized evolutionary learning for detection of biclusters in gene expression data.IEEE/ACM Trans Comput Biol Bioinform. 2012;9(2):560-70. doi: 10.1109/TCBB.2011.53. Epub 2011 Mar 3. IEEE/ACM Trans Comput Biol Bioinform. 2012. PMID: 21383419
-
Integrating biological knowledge based on functional annotations for biclustering of gene expression data.Comput Methods Programs Biomed. 2015 May;119(3):163-80. doi: 10.1016/j.cmpb.2015.02.010. Epub 2015 Mar 18. Comput Methods Programs Biomed. 2015. PMID: 25843807
-
Biclustering data analysis: a comprehensive survey.Brief Bioinform. 2024 May 23;25(4):bbae342. doi: 10.1093/bib/bbae342. Brief Bioinform. 2024. PMID: 39007596 Free PMC article. Review.
-
Biclustering on expression data: A review.J Biomed Inform. 2015 Oct;57:163-80. doi: 10.1016/j.jbi.2015.06.028. Epub 2015 Jul 6. J Biomed Inform. 2015. PMID: 26160444 Review.
References
-
- de Sousa JS, Gomes LDCT, Bezerra GB. et al. .. An immune-evolutionary algorithm for multiple rearrangements of gene expression data. Genet Program Evolvable Mach 2004;5:157–79. 10.1023/B:GENP.0000023686.59617.57. - DOI
-
- Berg JM, Tymoczko JL, Gatto JGJ. et al. .. Biochemistry, 5th edn. New York: W H Freeman, 2002.
MeSH terms
Grants and funding
LinkOut - more resources
Full Text Sources
