. 2025 Feb;66(2):12.
doi: 10.3892/ijo.2025.5718. Epub 2025 Jan 3.

LGR4 promotes proliferation and homing via activation of the NF‑κB signaling pathway in multiple myeloma

Affiliations

LGR4 promotes proliferation and homing via activation of the NF‑κB signaling pathway in multiple myeloma

Nihan He et al. Int J Oncol. 2025 Feb.

Abstract

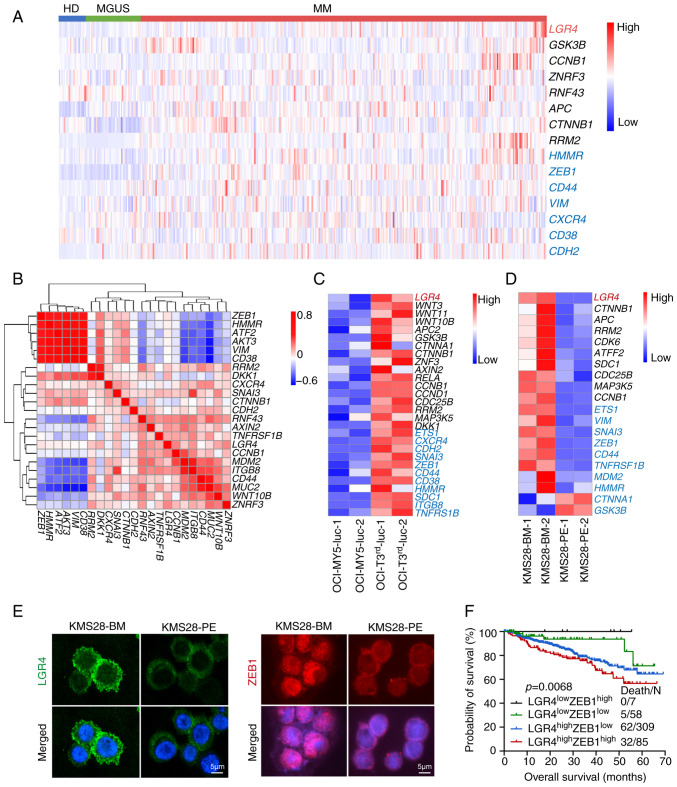
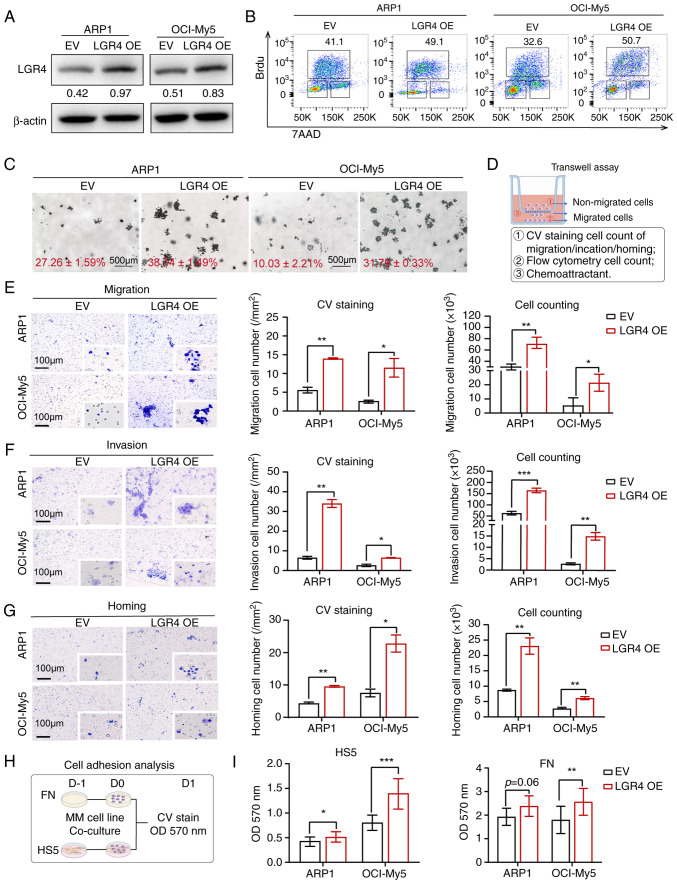
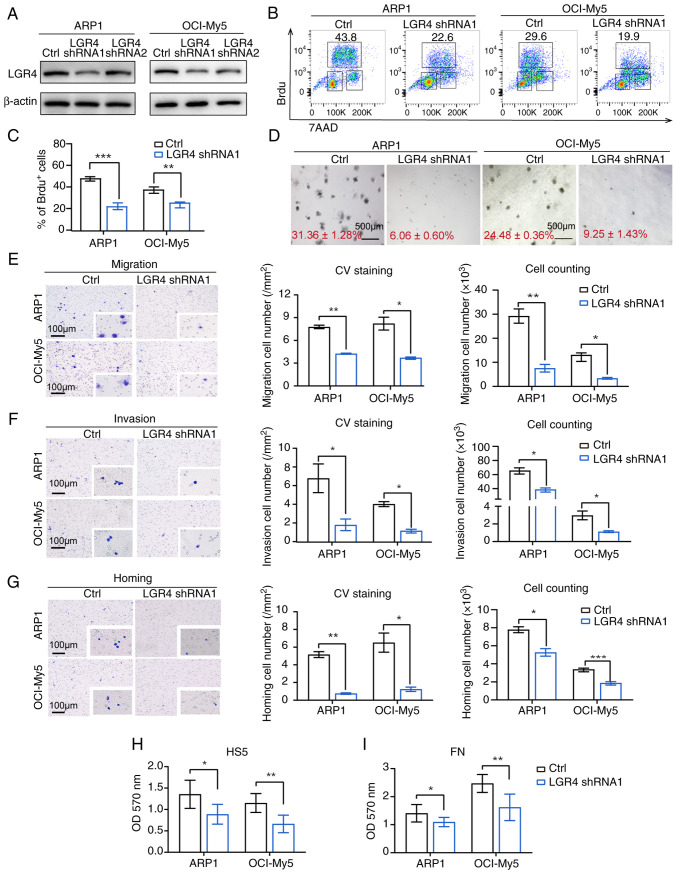
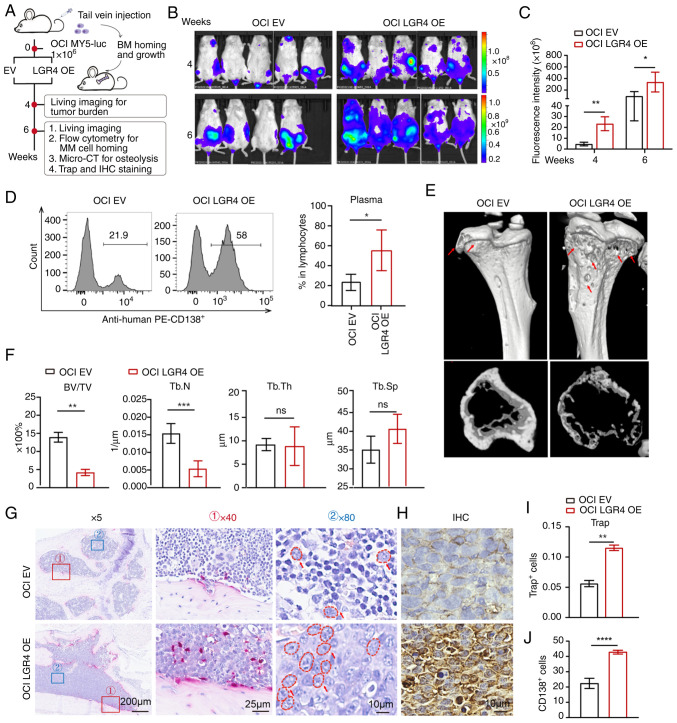
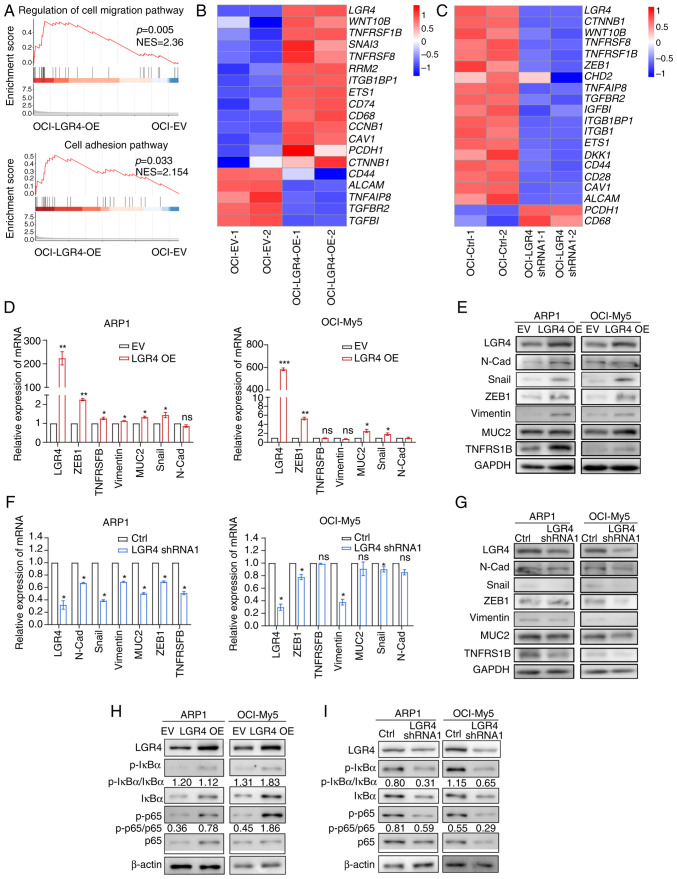
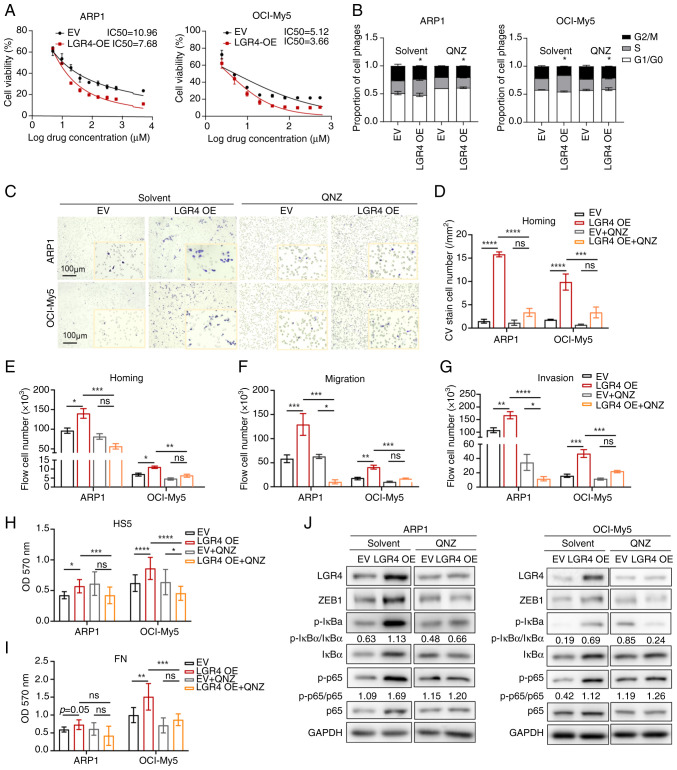
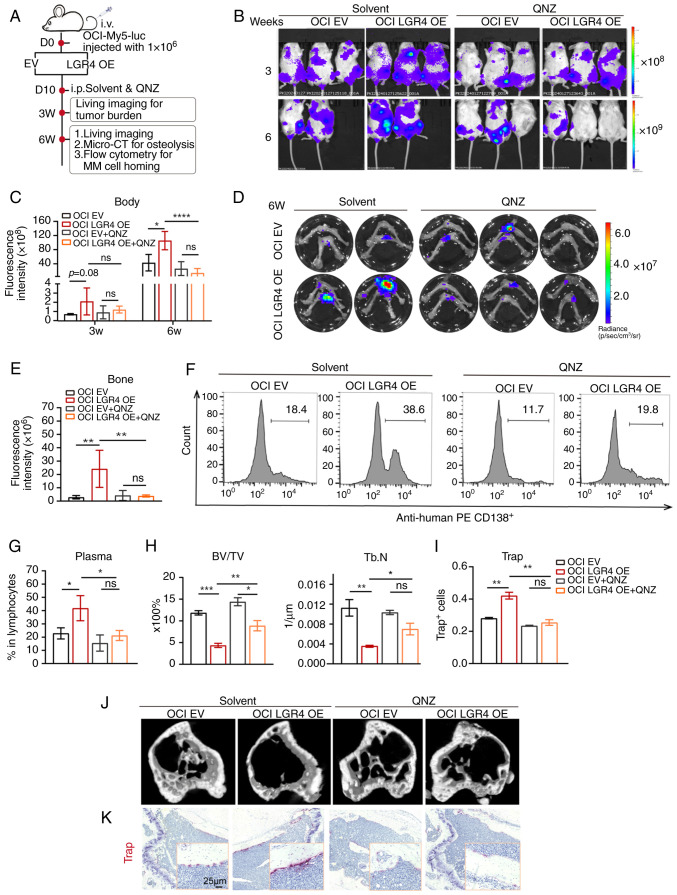
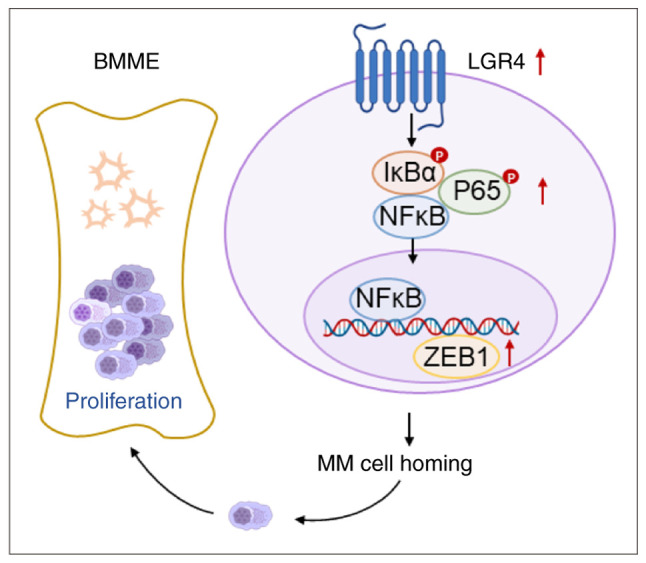
Multiple myeloma (MM) is a plasma cell malignancy characterized by clonal proliferation in the bone marrow (BM). Previously, it was reported that G‑protein‑coupled receptor 4 (LGR4) contributed to early hematopoiesis and was associated with poor prognosis in patients with MM. However, the mechanism of cell homing and migration, which is critical for MM progression, remains unclear. In the present study, cell counting, cell cycle and BrdU assays were performed to evaluate cell proliferation. Transwell assay and Xenograft mouse models were performed to evaluate cell migration and homing ability both in vitro and in vivo. I was found that overexpression of LGR4 promotes MM cell adhesion, migration and homing to BM both in vitro, while exacerbating osteolytic bone destruction in vivo. However, the LGR4 knockdown displayed the opposite effect. Further mechanistic studies demonstrated that LGR4 activated the nuclear factor kappa B (NF‑κB) signaling pathway and migration‑related adhesion molecule, thus promoting MM cell homing. Moreover, inhibiting the NF‑κB pathway was found to suppress MM cell homing. These findings identify LGR4 as a critical regulator of myeloma cell migration, homing and tumorigenesis, offering a potential therapeutic strategy for MM treatment.

Keywords: LGR4; cell homing; multiple myeloma.


Conflict of interest statement

The authors declare that they have no competing interests.

Figures

Figure 1
Figure 1
High expression of LGR4 is associated with cell adhesion and poor prognosis in multiple myeloma. (A) Gene expression heatmap of LGR4 (Red) and Wnt/β-catenin signal related genes (Black), Cell adhesion associated genes (Blue) in CD138+ cells from HD (n=22), MGUS (n=44) and MM (n=351). (B) Pearson's correlation analysis of the relationship between LGR4 and cell adhesion genes. Red for positive, blue for negative. (C) Gene expression heatmap of OCI-My5 and OCI-T3rd-luc with LGR4 (Red), Wnt/β-catenin signal genes (Black), Cell adhesion associated genes (Blue). (D) Gene expression heatmap of KMS28-BM and KMS28-PE with LGR4 (Red), Wnt/β-catenin signal genes (Black), Cell adhesion associated genes (Blue). (E) Representative images of immunofluorescence images of LGR4 and ZEB1 protein expression in KMS28-BM and KMS28-PE. Scale bars, 50 μm. (F) Kaplan-Meier analyses of overall survival in MM patients with LGR4lowZEB1low (n=58), LGR4lowZEB1high (n=7), LGR4highZEB1low (n=309) and LGR4highZEB1high (n=85) from GSE2658. HD, healthy donors; MGUS, monoclonal gammopathy of undetermined significance; MM, multiple myeloma; BM, bone marrow; PE, pleural effusion; ZEB1, Zinc Finger E-Box Binding Homeobox 1.
Figure 2
Figure 2
LGR4 overexpression promotes cell adhesion, migration and homing in MM cells in vitro. (A) Western blots of LGR4-OE in ARP1 and OCI-My5 MM cell lines, compared with EV. (B) Representative flow cytometry dot plots of the number of BrdU-positive cells. (C) Representative images of clonogenic analysis in ARP1-EV, ARP1-LGR4-OE, OCI-EV and OCI-LGR4-OE cells. Scale bars, 500 μm. (D) Schematics of Transwell experiments. (E) Transwell migration assays were conducted with LGR4-OE ARP1 and OCI-My5 cells. The quantification of the number of migratory cells is presented in the column graph. Scale bars, 100 μm. (F) Matrigel invasion assays were conducted with LGR4-OE ARP1 and OCI-My5 cells. The quantification of the number of invasive cells is presented in the column graph. Scale bars, 100 μm. (G) Transwell cell homing assays conducted with LGR4-OE ARP1 and OCI-My5 cells. The quantification of the number of homing cells is presented in the column graph. Scale bars, 100 μm. (H) Schematic of cell adhesion assay. (I) Adhesion assay of LGR4-OE ARP1 and OCI-My5 co-cultured with HS5 cells or FN. Statistical analyses were performed using Student's t-test. *P<0.05, **P<0.01 and ***P<0.001. LGR4-OE, LGR4 overexpression; MM, multiple myeloma; EV, empty vector; FN, fibronectin; CV, crystal violet.
Figure 3
Figure 3
LGR4 knockdown impairs cell proliferation, adhesion, migration and homing in MM cells in vitro. (A) Western blots of LGR4-silencing in ARP1 and OCI-My5, compared with the controls. (B) Representative flow cytometry dot plots for detection of BrdU-positive cells. (C) Statistical analysis of the number of BrdU-positive cells among LGR4-silencing MM cells. (D) Representative images of clonogenic analysis in ARP1-Ctrl, ARP1-LGR4-shRNA1, OCI-Ctrl and OCI-LGR4-shRNA1 cells cultured in RPM1-1640 media. Scale bars, 500 μm. (E) Transwell migration assays were conducted with LGR4-knockdown ARP1 and OCI-My5 cells. The quantification of the number of migratory cells is presented in the column graph. Scale bars, 100 μm. (F) Matrigel invasion assays were conducted with LGR4-knockdown ARP1 and OCI-My5 cells. The quantification of the number of invasive cells is illustrated in the column graph. Scale bars, 100 μm. (G) Cell homing assays were conducted with LGR4-knockdown ARP1 and OCI-My5 cells. Scale bars, 100 μm. (H) The quantification of the number of homing cells is presented in the column graph. (I) Adhesion assay of LGR4-knockdown ARP1 and OCI-My5 co-cultured with HS5 cells or FN. Statistical analyses were performed using Student's t-test. *P<0.05, **P<0.01 and ***P<0.001. MM, multiple myeloma; shRNA, short hairpin RNA.
Figure 4
Figure 4
Overexpression of LGR4 promotes cells' homing to the BM and MM progression in vivo. (A) Schematic of in vivo experiments. (B) Tumor-associated live imaging of NCG mice injected with OCI-Ctrl or OCI-LGR4-OE cells at 4 and 6 weeks (n=5 for each group). (C) Quantification of luminescence intensity in live NCG mice. (D) Flow cytometric analysis images and statistics of the human MM cell proportion in the bone marrow after sacrificing NCG mice. (E) Micro-CT images of tibia derived from NCG mice. (F) Quantification of bone microstructural parameters, namely BV/TV, Tb.N, Tb.Th and Tb.Sp (n=3). (G) TRAP staining for NCG xenografted mice bone marrow section. Scale bars, 200, 25 and 10 μm. (I) The quantification of the number of Trap-positive osteoclast cells is presented in the column graph. (H) Neoplastic CD138-positive plasma cells. Scale bars, 10 μm. (J) The quantification of the number of neoplastic CD138 positive plasma cells is presented in the column graph. Statistical analyses were performed using Student's t-test. *P<0.05, **P<0.01, ***P<0.001 and ****P<0.0001. BM, bone marrow; MM, multiple myeloma; LGR4-OE, LGR4 overexpression; BV/TV, trabecular bone volume fraction; Tb.N, trabecular number; Tb.Th, trabecular thickness; Tb.Sp, trabecular separation; TRAP, tartrate-resistant acid phosphatase; EV, empty vector; ns, not significant (P>0.05).
Figure 5
Figure 5
Cell-adhesion association genes and NF-κB signaling pathway are upregulated in LGR4-OE multiple myeloma cells. (A) Gene Set Enrichment Analysis of cell-adhesion pathway-related genes from differentially expressed genes between OCI-Ctrl and OCI-LGR4-OE. (B and C) Heatmap of RNA sequencing analysis of adhesion-related gene expression in OCI-EV, OCI-LGR4-OE, OCI-Ctrl, and OCI-LGR4-shRNA1. (D and E) Relative mRNA and protein levels of cell-adhesion genes in OCI-EV and OCI-LGR4-OE cells, respectively. (F and G) Relative mRNA and protein levels of cell-adhesion genes in OCI-Ctrl and OCI-LGR4-shRNA1 cells, respectively. (H and I) The protein level of NF-κB signal genes was detected in (H) OCI-EV and OCI-LGR4-OE cells; and (I) in OCI-Ctrl and OCI-LGR4-shRNA1 cells (I). Statistical analyses were performed using Student's t-test. *P<0.05, **P<0.01 and ***P<0.001. LGR4-OE, LGR4 overexpression; EV, empty vector; shRNA, short hairpin RNA; p-, phosphorylated; ZEB1, Zinc Finger E-Box Binding Homeobox 1; ns, not significant (P>0.05).
Figure 6
Figure 6
Inhibition of NF-κB pathway suppresses cell homing and multiple myeloma progression in vitro. (A) IC50 test with Cell Counting Kit-8 assays of LGR4-OE ARP1 and OCI-My5 cells after treatment with doubling dilution of QNZ (0-2,500 nmol/l, doubling dilution). (B) The proportions of cell cycle phases in LGR4-OE ARP1 and OCI-My5 cells with the addition of solvent or QNZ treatment for 48 h. (C-E) Cell homing assays were conducted with LGR4-OE ARP1 and OCI-My5 cells after solvent or QNZ treatment for 48 h. Scale bars, 100 μm. The quantification of the number of homing cells is presented in the column graph. (D-G) The quantification of the (D and E) homing, (F) migration and (G) invasion cell count with LGR4-OE ARP1 and OCI-My5 cells after QNZ treatment. (H and I) Adhesion assay of LGR4-OE ARP1 and OCI-My5 cells after QNZ treatment co-cultured with (H) HS5 cells or (I) fibronectin. (J) Western blotting of NF-κB signal genes in LGR4-OE ARP1 and OCI-My5 cells after QNZ treatment. Statistical analyses were performed using two-way ANOVA with Tukey's post-hoc test. *P<0.05, **P<0.01, ***P<0.001 and ****P<0.0001. LGR4-OE, LGR4 overexpression; EV, empty vector; ns, not significant (P>0.05).
Figure 7
Figure 7
Inhibition of the NF-κB pathway relieves the effect of LGR4-OE on MM cell proliferation and cell homing in vivo. (A) Schematic of in vivo experiments (n=3 for each group). (B) Tumor-associated live imaging of NCG mice injected with OCI-Ctrl or OCI-LGR4-OE cells treated with solvent and QNZ (0.6 mg/kg) at 3 and 6 weeks. (C) Quantification of luminescence intensity in live NCG mice. (D) Tumor cell homing-associated living image in the bone marrow. (E) Quantification of luminescence intensity. (F and G) Flow cytometric analysis and statistics of the human MM cell proportion in the bone marrow. (H) Quantification of bone microstructural parameters, namely BV/TV and Tb.N (n=3). (I) Quantification of the number of TRAP positive osteoclast cells is illustrated in the column graph. (J) Micro-CT images of femurs derived from NCG mice. (K) representative TRAP staining for NCG mice bone marrow section treated with solvent and QNZ. Scale bars, 25 μm. Statistical analyses were performed using Student's t-test. *P<0.05, **P<0.01, ***P<0.001 and ****P<0.0001. LGR4-OE, LGR4 overexpression; MM, multiple myeloma; EV, empty vector; i.v., intravenously; ns, not significant (P>0.05).
Figure 8
Figure 8
Schematic diagram of the current working hypothesis. MM, multiple myeloma; BMME, bone marrow microenvironment; ZEB1, Zinc Finger E-Box Binding Homeobox 1.

Similar articles

Cited by

References

    1. Palumbo A, Anderson K. Multiple myeloma. N Engl J Med. 2011;364:1046–1060. doi: 10.1056/NEJMra1011442. - DOI - PubMed
    1. Slovak ML. Multiple myeloma: Current perspectives. Clin Lab Med. 2011;31:699–724. doi: 10.1016/j.cll.2011.08.009. - DOI - PubMed
    1. Chauhan D, Uchiyama H, Akbarali Y, Urashima M, Yamamoto K, Libermann TA, Anderson KC. Multiple myeloma cell adhesion-induced interleukin-6 expression in bone marrow stromal cells involves activation of NF-kappa B. Blood. 1996;87:1104–1112. doi: 10.1182/blood.V87.3.1104.bloodjournal8731104. - DOI - PubMed
    1. Neri P, Ren L, Azab AK, Brentnall M, Gratton K, Klimowicz AC, Lin C, Duggan P, Tassone P, Mansoor A, et al. Integrin β7-mediated regulation of multiple myeloma cell adhesion, migration, and invasion. Blood. 2011;117:6202–6213. doi: 10.1182/blood-2010-06-292243. - DOI - PMC - PubMed
    1. Xu L, Mohammad KS, Wu H, Crean C, Poteat B, Cheng Y, Cardoso AA, Machal C, Hanenberg H, Abonour R, et al. Cell adhesion molecule CD166 drives malignant progression and osteolytic disease in multiple myeloma. Cancer Res. 2016;76:6901–6910. doi: 10.1158/0008-5472.CAN-16-0517. - DOI - PMC - PubMed