. 2025 Jun 28;17(1):mjae061.
doi: 10.1093/jmcb/mjae061.

A long noncoding RNA with enhancer-like function in pig zygotic genome activation

Affiliations

A long noncoding RNA with enhancer-like function in pig zygotic genome activation

Renyue Wei et al. J Mol Cell Biol. .

Abstract

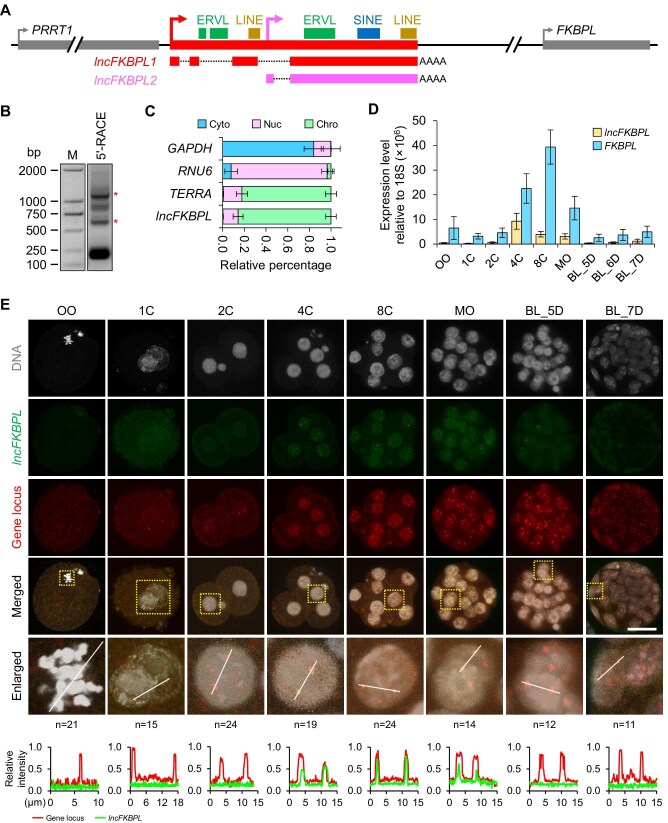
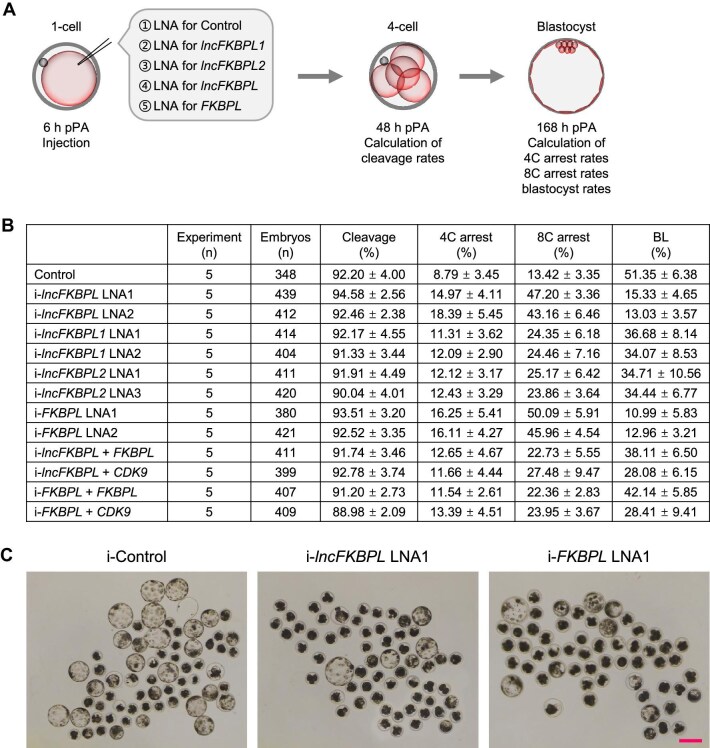
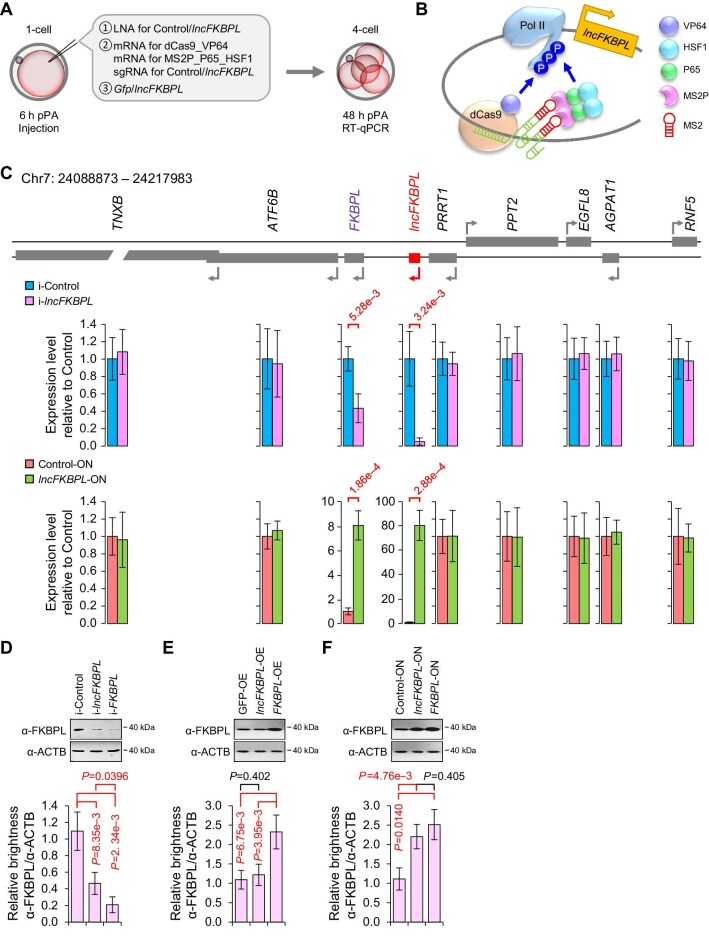
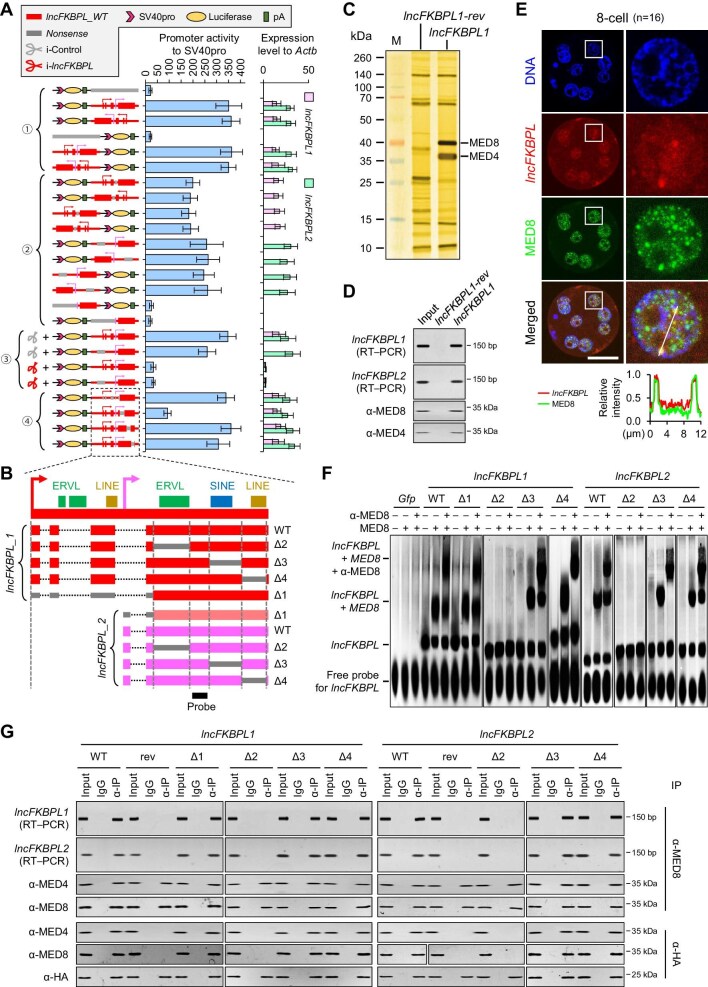
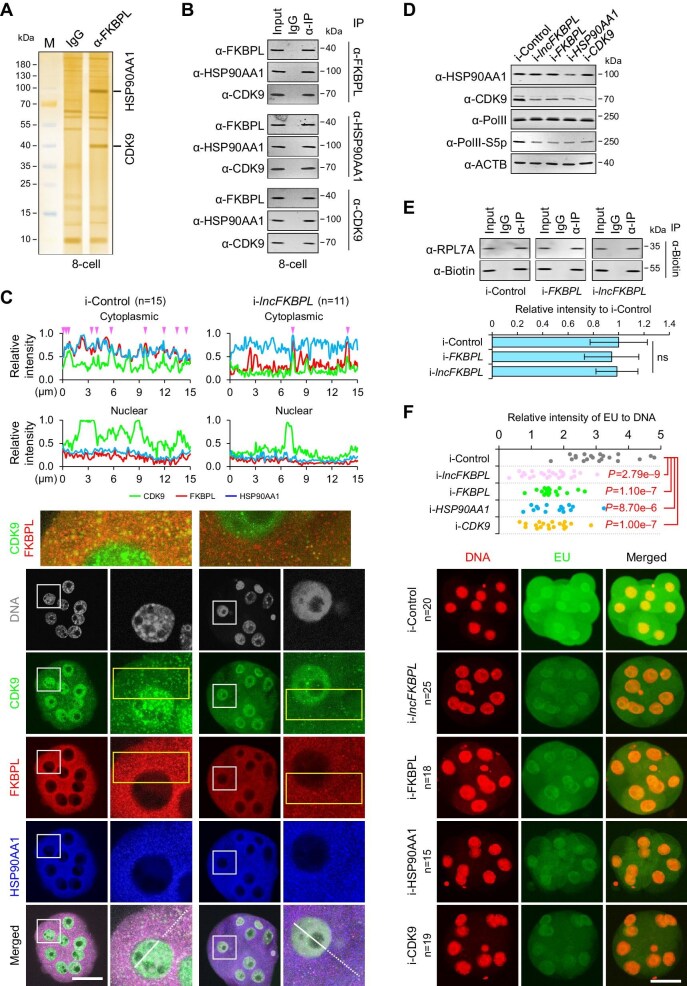
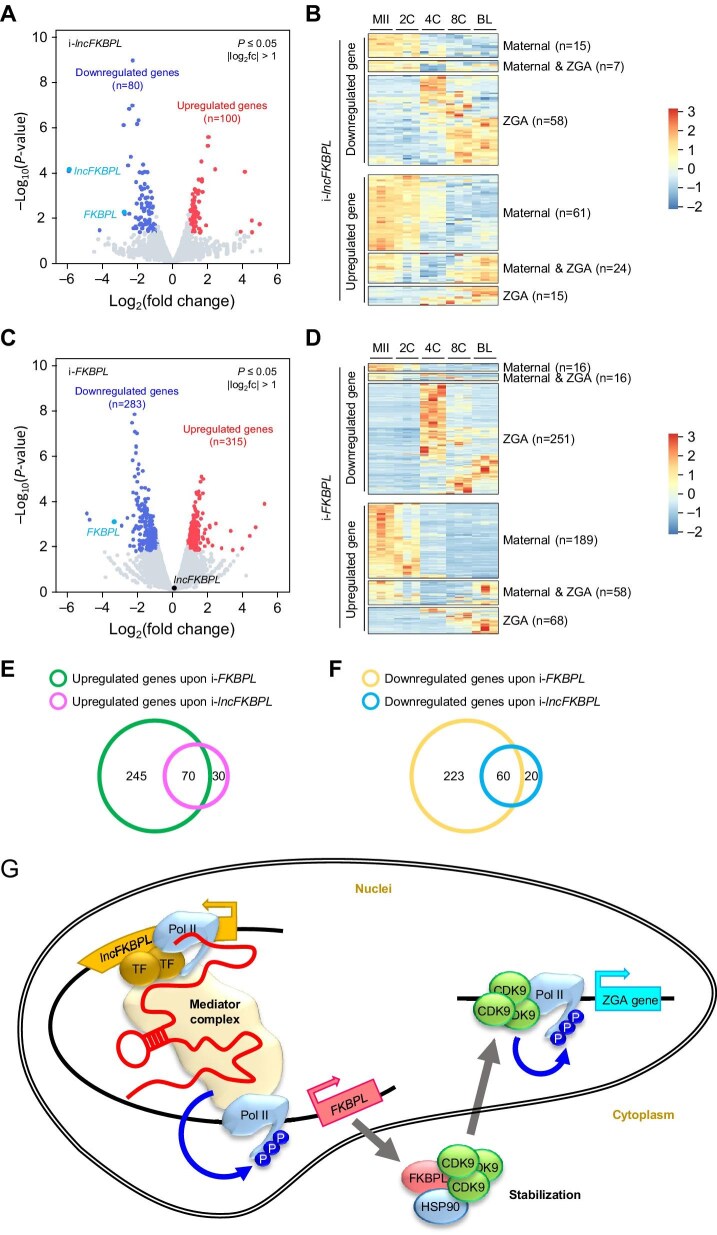
The zygotic genome activation (ZGA) is crucial for the development of pre-implantation embryos. Long noncoding RNAs (lncRNAs) play significant roles in many biological processes, but the study on their role in the early embryonic development of pigs is limited. In this study, we identify lncFKBPL as an enhancer-type lncRNA essential for pig embryo development. lncFKBPL is expressed from the 4-cell stage to the morula stage in pig embryos, and interference with lncFKBPL leads to a developmental arrest at the 8-cell stage. Mechanistic investigations uncover that lncFKBPL is able to bind to MED8, thereby mediating enhancer activity and regulating FKBPL expression. Additionally, FKBPL interacts with the molecular chaperone protein HSP90AA1, stabilizing CDK9 and boosting its protein-level expression. Elevated CDK9 levels enhance Pol II phosphorylation, facilitating ZGA. Our findings illuminate the role of lncFKBPL as an enhancer lncRNA in pig ZGA regulation and early embryo development, providing a foundation for further exploration in this area.

Keywords: lncRNA; porcine; pre-implantation embryonic development; zygotic genome activation.


Figures

Figure 1
Figure 1
lncFKBPL is an ERV-associated nuclear lncRNA highly expressed in pig 4-cell embryos. (A) Gene locus of lncFKBPL. lncFKBPL is between PRRT1 and FKBPL and has two transcript isoforms, lncFKBPL1 and lncFKBPL2. There are some ERVL, SINE, and LINE fragments on lncFKBPL gene locus. AATAAA is the polyadenylated signal site. (B) 5′-RACE results for lncFKBPL. Primers are shown in Supplementary Figure S1A. The asterisk (*) indicates the bands corresponding to the correct band of 5′-RACE for lncFKBPL. Approximately 200 pig 4-cell embryos were used for each experiment and three experimental replicates were performed. M, DNA ladder. (C) Subcellular localization analysis of lncFKBPL by RNA fractionation and qPCR. The error bars represent standard error of the mean (SEM). GAPDH, RNU6, and TERRA act as cytoplasm (Cyto), nucleoplasm (Nuc), and chromosome (Chro) control, respectively. Approximately 500 pig 4-cell embryos were used for each experiment and three experimental replicates were performed. (D) Expression pattern of lncFKBPL and FKBPL at different stages of pig pre-implantation embryos analyzed by qPCR. The error bars represent SEM. About 50 embryos of each stage were used and three experimental replicates were performed. OO, MII oocytes; 1C, 1-cell embryos; 2C, 2-cell embryos; 4C, 4-cell embryos; 8C, 8-cell embryos; MO, morula; BL_5D, blastocysts at embryonic day 5; BL_6D, blastocysts at embryonic day 6; BL_7D, blastocysts at embryonic day 7. (E) RNA-FISH combined with DNA-FISH in pig oocytes and early embryos to detect lncFKBPL transcripts and lncFKBPL gene locus. Three experimental replicates were performed. Top, representative images. Scale bar, 50 μm. One nucleus (marked by the square) is magnified in the ‘enlarged’ lane. Bottom, line scans of the relative intensity of fluorescence signals indicated by the white lines.
Figure 2
Figure 2
lncFKBPL or FKBPL depletion results in developmental arrest at 4- to 8-cell stages. (A) The experimental scheme to analyze the effects of lncFKBPL, lncFKBPL1, lncFKBPL2, or FKBPL depletion on embryonic development. (B) Statistics for embryonic development after microinjection of control LNA (i-Control), LNA targeting lncFKBPL (i-lncFKBPL), LNA targeting lncFKBPL1 (i-lncFKBPL1), LNA targeting lncFKBPL2 (i-lncFKBPL2), LNA targeting FKBPL (i-FKBPL), LNA targeting lncFKBPL and FKBPL mRNA (i-lncFKBPL + FKBPL), LNA targeting lncFKBPL and CDK9 mRNA (i-lncFKBPL + CDK9), LNA targeting FKBPL and FKBPL mRNA (i-FKBPL + FKBPL), or LNA targeting FKBPL and CDK9 mRNA (i-FKBPL + CDK9). Student's t-test was used for statistical analysis, and the P-values are shown in Supplementary Figure S2B. (C) Microcopy of embryos at blastocyst stage. Scale bar, 100 μm. Five experimental replicates were performed for each group.
Figure 3
Figure 3
lncFKBPL activates FKBPL in cis. (A) The experimental scheme to analyze the effects of interference, overexpression, or endogenous activation of lncFKBPL on neighbor genes. (B) The illustration of endogenous activation of lncFKBPL via the CRISPR-ON system. (C) Top, illustration of genes around lncFKBPL on pig chromosome 7 (Chr7: 24088873–24217983). Gene locus of lncFKBPL is shown in red. Middle, changes of gene expression levels upon lncFKBPL depletion analyzed by qPCR. Bottom, changes of gene expression levels upon endogenous activation of lncFKBPL through the CRISPR-ON system analyzed by qPCR. The error bars represent SEM. Student's t-test was used for statistical analysis. (DF) Western blotting and quantification of FKBPL protein levels upon depletion (D), overexpression (E), or endogenous activation through the CRISPR-ON system (F) of lncFKBPL or FKBPL. ACTB works as an internal reference. Three experimental replicates were performed. The error bars represent SEM. Student's t-test was used for statistical analysis.
Figure 4
Figure 4
lncFKBPL has an enhancer-like function. (A) The results of the dual-luciferase reporter system. The y-axis shows the construction of luciferase reporter plasmids and LNAs. ① lncFKBPL is forwardly or reversely inserted upstream or downstream of luciferase reporter gene. ② Promoter regions of lncFKBPL1 and/or lncFKBPL2 are replaced with nonsense sequences to disrupt their transcription. ③ Control LNAs or LNAs targeting lncFKBPL are overexpressed to deplete lncFKBPL1 and lncFKBPL2. ④ Different regions of lncFKBPL are replaced with nonsense sequences to generate different lncFKBPL deletion mutants. Three experimental replicates were performed. The error bars represent SEM. Student's t-test was used for the statistical analysis, and the P-values are shown in Supplementary Figure S4A. (B) Illustration of lncFKBPL deletion mutants. Four different regions were deleted individually, resulting in seven types of lncFKBPL transcripts: lncFKBPL-Δ1, lncFKBPL_1-Δ2, lncFKBPL_1-Δ3, lncFKBPL_1-Δ4, lncFKBPL_2-Δ2, lncFKBPL_2-Δ3, and lncFKBPL_2-Δ4. (C) Silver staining of SDS-PAGE gel following the RNA pull-down assay shows the proteins bound to lncFKBPL_1 (right lane) and reverse lncFKBPL_1 (lncFKBPL_1-rev, middle lane). Only one pull-down assay for mass spectrometry analysis was performed with 3271 pig 8-cell embryos. Two specific bands in the right lane were analyzed by mass spectrometry and confirmed to be MED4 and MED8. M, protein ladder. (D) Western blotting following the RNA pull-down assay. Three experimental replicates were performed. (E) Top, lncFKBPL and MED8 co-stained by immunofluorescence combined with RNA-FISH in pig 8-cell embryos. One nucleus (marked by square) is magnified in the right lane. Bottom, line scans of the relative intensity of fluorescence signals indicated by the white dotted line. (F) Results of RNA EMSA. Three biological replicates were performed. (G) Co-IP followed by reverse transcription–PCR and western blotting using PEFs expressing HA-tagged MS2P and MS2-labelled lncFKBPL. Three biological replicates were performed.
Figure 5
Figure 5
FKBPL forms a complex with HSP90AA1 to stabilize CDK9 and then promote ZGA. (A) Silver staining of SDS-PAGE gel following the co-IP assay shows the proteins bound to FKBPL (right lane) and IgG (middle lane). Only one pull-down assay for mass spectrometry analysis was performed with 2472 pig 8-cell embryos. Two specific bands in the right lane were analyzed by mass spectrometry and confirmed to be HSPAA1 and CDK9. (B) Western blotting following the co-IP assay. Three biological replicates were performed. (C) Bottom, CDK9, FKBPL, and HSPAA1 co-stained by immunofluorescence in pig 8-cell embryos upon lncFKBPL depletion. One nucleus marked by the square is magnified in the right lane. The co-localization of CDK9 and FKBPL (marked by the yellow rectangle) is highlighted by merging images with green and red fluorescence. Top, line scans of the relative intensity of fluorescence signals indicated by the dotted lines (cytoplasmic) or lines (nuclear). (D) Western blotting results of pig 8-cell embryos upon lncFKBPL, FKBPL, HSP90AA1, or CDK9 depletion. Three biological replicates were performed. The quantification results are shown in Supplementary Figure S5C. (E) Western blotting and quantification following the RNA pull-down assay. Three biological replicates were performed. The error bars represent SEM. Student's t-test was used for statistical analysis. ns, P > 0.05. (F) Representative images of EU staining and relative intensity of EU signals in pig 8-cell embryos upon lncFKBPL, FKBPL, HSP90AA1, or CDK9 depletion. Student's t-test was used for statistical analysis, and the P-values are shown.
Figure 6
Figure 6
lncFKBPL promotes pig ZGA. (AD) Volcano plots and heatmaps depicting differentially expressed genes upon lncFKBPL interference (i-lncFKBPL, A and B) or FKBPL interference (i-FKBPL, C and D). (E and F) Venn diagrams depicting the intersection of upregulated genes (E) or downregulated genes (F) between i-lncFKBPL and i-FKBPL. (G) Model of lncFKBPL function in pig ZGA. In pig 4- to 8-cell embryos, lncFKBPL interacts with MED4 and MED8, components of the Mediator complex, and has an enhancer-like function to activate FKBPL in cis. FKBPL forms a complex with HSP90AA1 to stabilize CDK9, which promotes phosphorylation of Pol II and then promotes ZGA.

Similar articles

Cited by

References

    1. Allen B.L., Taatjes D.J. (2015). The Mediator complex: a central integrator of transcription. Nat. Rev. Mol. Cell Biol. 16, 155–166. - PMC - PubMed
    1. Boija A., Klein I.A., Sabari B.R. et al. (2018). Transcription factors activate genes through the phase-separation capacity of their activation domains. Cell 175, 1842–1855.e16. - PMC - PubMed
    1. Bou G., Guo J., Liu S. et al. (2022). OCT4 expression transactivated by GATA protein is essential for non-rodent trophectoderm early development. Cell Rep. 41, 111644. - PubMed
    1. Bou G., Liu S., Sun M. et al. (2017). CDX2 is essential for cell proliferation and polarity in porcine blastocysts. Development 144, 1296–1306. - PubMed
    1. Burd C.E., Jeck W.R., Liu Y. et al. (2010). Expression of linear and novel circular forms of an INK4/ARF-associated non-coding RNA correlates with atherosclerosis risk. PLoS Genet. 6, e1001233. - PMC - PubMed

MeSH terms

Substances