

The omicron variant of SARS-CoV-2 drove broadly increased seroprevalence in a public university setting
- PMID: 39752417
- PMCID: PMC11698426
- DOI: 10.1371/journal.pgph.0003893
The omicron variant of SARS-CoV-2 drove broadly increased seroprevalence in a public university setting
Abstract
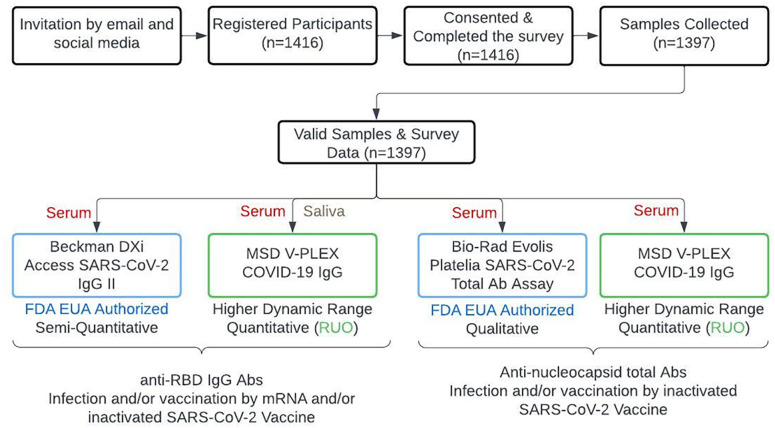
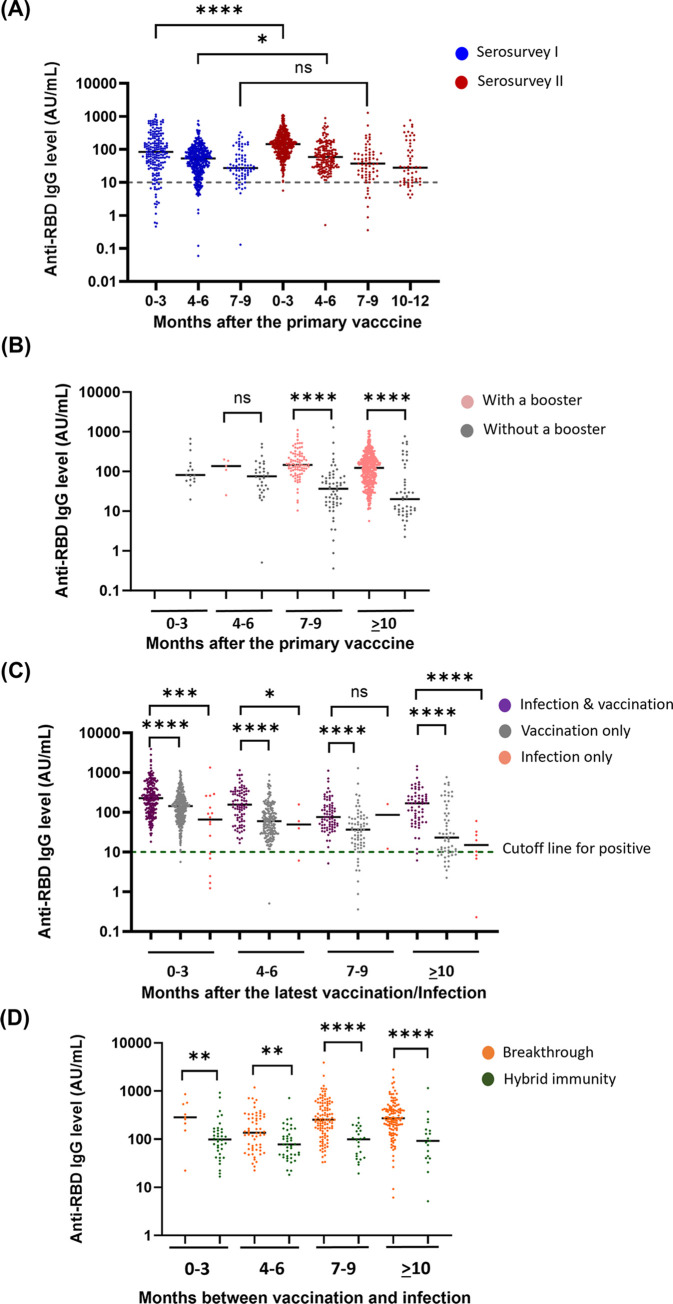
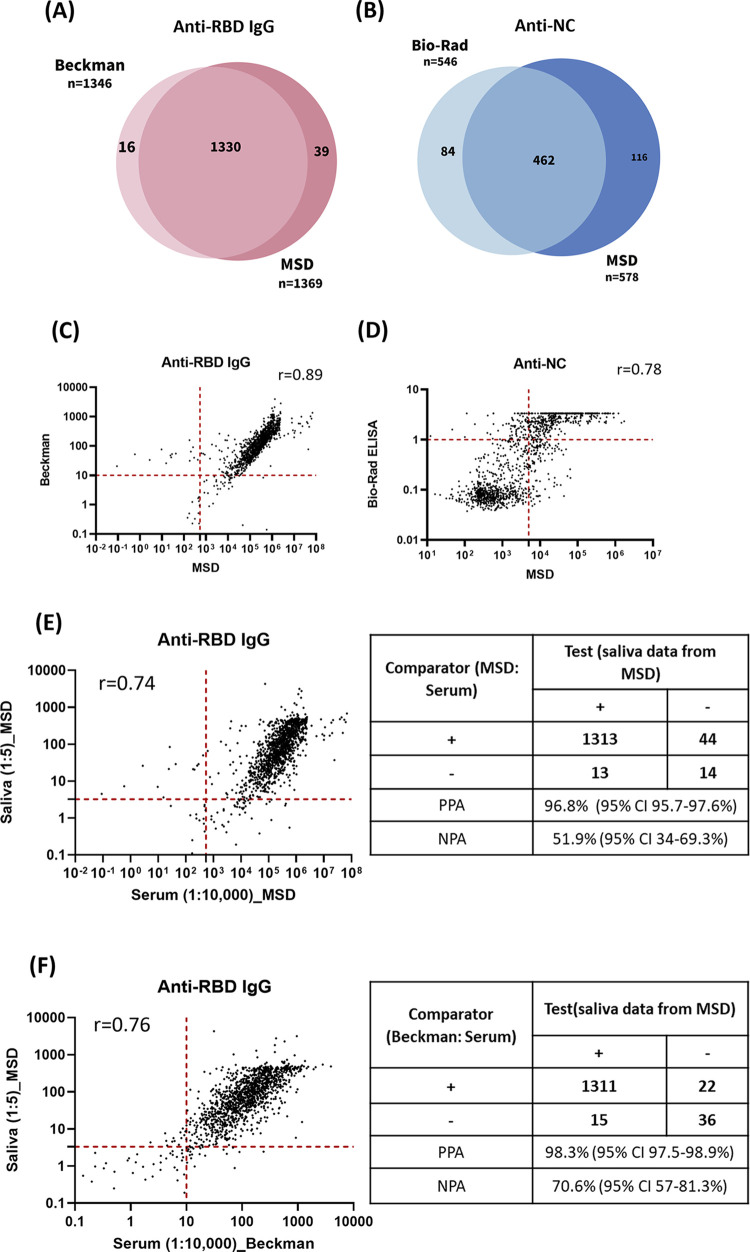
Omicron is the comparatively most transmissible and contagious variant of severe acute respiratory syndrome-coronavirus-2 (SARS-CoV-2). We conducted a seroprevalence study from March 1-3, 2022, to investigate the seroprevalence of SARS-CoV-2 antibodies among individuals aged 18 years and older after the Omicron outbreak. The seroprevalence of anti-receptor binding domain (RBD) antibodies was found to be 96.3% (95% CI 95.2-97.2%) compared to 88.2% (95% CI 86.1-90%) in our previous serosurvey. For anti-nucleocapsid (NC) antibodies, the seroprevalence was 39.1% (95% CI 36.6-41.7%) compared to 19.7% (95% CI 17.5-22.2%) earlier. Individuals that experienced breakthrough infections exhibited the highest levels of anti-RBD antibodies. Additionally, saliva samples showed promise as a potential diagnostic biofluid for measuring antibody levels, as they exhibited a strong agreement with the data obtained from serum samples. The near doubling of anti-NC reactivity, a proxy for history of infection, reflects the contagiousness of the omicron variant, but may also have been influenced by a more relaxed approach to precautions in the spring of 2022. Serosurveys repeated at regular intervals monitor the trend of infections in the community, delineate the geographical spread of the infection, and may guide containment measures in communities, and prompt response to future outbreaks.
Copyright: © 2025 Hou et al. This is an open access article distributed under the terms of the Creative Commons Attribution License, which permits unrestricted use, distribution, and reproduction in any medium, provided the original author and source are credited.
Conflict of interest statement
The authors have declared that no competing interests exist.
Figures
References
-
- Wikimedia Foundation I. List of United States public university campuses by enrollment [updated 21 March 2023]. Available from: https://en.wikipedia.org/wiki/List_of_United_States_public_university_ca....
-
- ASU. ASU sets new records with fall 2022. enrollment [updated Agust 15,2022]. Available from: https://news.asu.edu/20220815-university-news-asu-sets-record-fall-2022-...,%E2%80%94%20an%20increase%20of%203.2%25.
-
- Cohen E. Arizona seeing highest number of new coronavirus cases per capita: CNN; 2020. Available from: https://edition.cnn.com/world/live-news/coronavirus-pandemic-06-24-20-in....
-
- ASU. Fall 2021 update. Available from: https://eoss.asu.edu/health/announcements/coronavirus/feb-15-2021.
Grants and funding
LinkOut - more resources
Full Text Sources
Other Literature Sources
Miscellaneous