. 2025 Jan 3;20(1):e0316661.
doi: 10.1371/journal.pone.0316661. eCollection 2025.

De novo transcriptome assembly and discovery of drought-responsive genes in white spruce (Picea glauca)

Affiliations

De novo transcriptome assembly and discovery of drought-responsive genes in white spruce (Picea glauca)

Zoé Ribeyre et al. PLoS One. .

Abstract

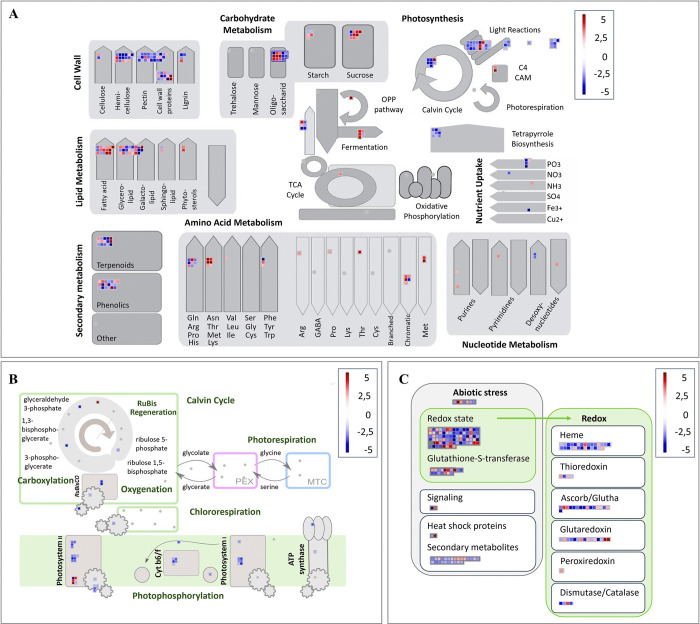
Forests face an escalating threat from the increasing frequency of extreme drought events driven by climate change. To address this challenge, it is crucial to understand how widely distributed species of economic or ecological importance may respond to drought stress. In this study, we examined the transcriptome of white spruce (Picea glauca (Moench) Voss) to identify key genes and metabolic pathways involved in the species' response to water stress. We assembled a de novo transcriptome, performed differential gene expression analyses at four time points over 22 days during a controlled drought stress experiment involving 2-year-old plants and three genetically distinct clones, and conducted gene enrichment analyses. The transcriptome assembly and gene expression analysis identified a total of 33,287 transcripts corresponding to 18,934 annotated unique genes, including 4,425 genes that are uniquely responsive to drought. Many transcripts that had predicted functions associated with photosynthesis, cell wall organization, and water transport were down-regulated under drought conditions, while transcripts linked to abscisic acid response and defense response were up-regulated. Our study highlights a previously uncharacterized effect of drought stress on lipid metabolism genes in conifers and significant changes in the expression of several transcription factors, suggesting a regulatory response potentially linked to drought response or acclimation. Our research represents a fundamental step in unraveling the molecular mechanisms underlying short-term drought responses in white spruce seedlings. In addition, it provides a valuable source of new genetic data that could contribute to genetic selection strategies aimed at enhancing the drought resistance and resilience of white spruce to changing climates.


Conflict of interest statement

The authors have declared that no competing interests exist.

Figures

Fig 1
Fig 1. Experimental design and analysis pipeline used in this study.
The analysis steps are presented in chronological order for the two boxes Transcriptome assembly and Transcriptomic analyses. The tool used for each type of analysis is reported.
Fig 2
Fig 2. Characteristics and quality assessment of the de novo assembly GCAT 4.0.
(A) Distribution of the number of transcript and unigene sequences as a function of the sequence length expressed in base pairs (bp). The two pie charts represent the results of the BUSCO analysis using (B) the viridiplantae database (Viridiplantae_(odb10) and (C) the embryophyta database (Embryophyta_(odb10)).
Fig 3
Fig 3. Differentially expressed unigenes (DEGs) in response to drought in white spruce.
(A) Volcano plot control versus water stressed white spruce trees on day 22. Down-regulated unigenes (FDR ⩽ 0.05 and a log2FC ⩽ -2) are shown in blue, while up-regulated unigenes (FDR ⩽ 0.05 and a log2FC ⩾ 2) are represented in red. Genes whose expression is not significantly altered by drought are identified by grey dots. (B) The number of differentially expressed unigenes (DEGs) is shown as a function of their regulation (in red, upwards, and in blue, downwards) for the four sampling days. The Venn Diagrams depict the overlaps of (C) downregulated and (D) upregulated differentially expressed genes across the days of sampling. The intensity of the color is positively correlated with the number of unigenes.
Fig 4
Fig 4. Results of gene ontology enrichment analyses as a function of drought exposure time.
(A) The barplot represents the gene ontology (GO) annotation from OmicsBox of unique DEGs regulated on all time points. (B) The scatterplots represent the enriched GO terms belonging to the biological process (BP) and molecular function (MF), as a function of exposure time to the water stress treatment (Days of sampling). Significantly enriched GO terms are shown with the transparency gradient based on -log10(FDR). The size of the dots indicates the ratio of the number of annotated sequences in the sample to the reference transcriptome GCAT 4.0. Enriched GO terms associated with up- and down-regulated sequences are shown in red and blue, respectively. Day 14 showed no significant enrichment and has been withdrawn from the graph for clarity.
Fig 5
Fig 5. Pathways based on MapMan classification of differentially expressed genes (DEGs) involved in drought stress responses after 22 days in white spruce seedlings.
Expression profiles of DEGs involved in metabolism overview (A), photosynthesis (B), abiotic stresses and redox homeostasis (C) are presented. The schematic representation of panel (C) was obtained after modifying MapMan’s original pathways (biotic stress and cellular response overview pathways) to improve and more concisely synthesize the results obtained in the context of our specific short-term drought experiment. The scale bar represents the up- (red) and down- (blue) regulation of gene expression based on log2FC scores.
Fig 6
Fig 6. Main classes of transcription factors (TFs) unigenes significantly regulated in response to drought.
(A) Histogram showing the number of up (red) or down (blue) regulated genes for the most represented classes of drought-responsive TFs. (B) Heatmap showing the expression of TFs belonging to key TF classes in the response to drought conditions. To the right of the heatmap is the log2 fold change (log2Foldchange), which corresponds to the level of regulation of transcription factor expression when it was detected significantly regulated for a given time point. In cases where a TF was up-regulated at more than one time point, the log2foldchange was averaged over multiple time points and plotted in the heatmap. The complete list of drought-responsive TFs is presented in S8 Table.

Similar articles

References

    1. Forzieri G, Dakos V, McDowell NG, Ramdane A, Cescatti A. Emerging signals of declining forest resilience under climate change. Nature. 2022;608: 534–539. doi: 10.1038/s41586-022-04959-9 - DOI - PMC - PubMed
    1. Hartmann H, Bastos A, Das AJ, Esquivel-Muelbert A, Hammond WM, Martínez-Vilalta J, et al.. Climate change risks to global forest health: emergence of unexpected events of elevated tree mortality worldwide. Annu Rev Plant Biol. 2022;73: 673–702. doi: 10.1146/annurev-arplant-102820-012804 - DOI - PubMed
    1. Depardieu C, Girardin MP, Nadeau S, Lenz P, Bousquet J, Isabel N. Adaptive genetic variation to drought in a widely distributed conifer suggests a potential for increasing forest resilience in a drying climate. New Phytol. 2020;227: 427–439. doi: 10.1111/nph.16551 - DOI - PMC - PubMed
    1. Laverdière J, Lenz P, Nadeau S, Depardieu C, Isabel N, Perron M, et al.. Breeding for adaptation to climate change: genomic selection for drought response in a white spruce multi‐site polycross test. Evol Appl. 2022;15: 383–402. doi: 10.1111/eva.13348 - DOI - PMC - PubMed
    1. Soro A, Lenz P, Roussel J-R, Larochelle F, Bousquet J, Achim A. The phenotypic and genetic effects of drought-induced stress on apical growth, ring width, wood density and biomass in white spruce seedlings. New For. 2023;54: 789–811. doi: 10.1007/s11056-022-09939-5 - DOI - PMC - PubMed

LinkOut - more resources