

Genetic diversity and population structure studies of West African sweetpotato [Ipomoea batatas (L.) Lam] collection using DArTseq
- PMID: 39752435
- PMCID: PMC11698414
- DOI: 10.1371/journal.pone.0312384
Genetic diversity and population structure studies of West African sweetpotato [Ipomoea batatas (L.) Lam] collection using DArTseq
Abstract
Background: Sweetpotato is a vegetatively propagated crop cultivated worldwide, predominantly in developing countries, valued for its adaptability, short growth cycle, and high productivity per unit land area. In most sub-Saharan African (SSA) countries, it is widely grown by smallholder farmers. Niger, Nigeria, and Benin have a huge diversity of sweetpotato accessions whose potential has not fully been explored to date. Diversity Arrays Technology (DArTseq), a Genotyping by Sequencing (GBS) method, has been developed and enables genotyping with high-density single nucleotide polymorphisms (SNPs) in different crop species. The aim of this study was to assess the genetic diversity and population structure of the West African sweetpotato collection using Diversity Arrays Technology through Genotyping by Sequencing (GBS).
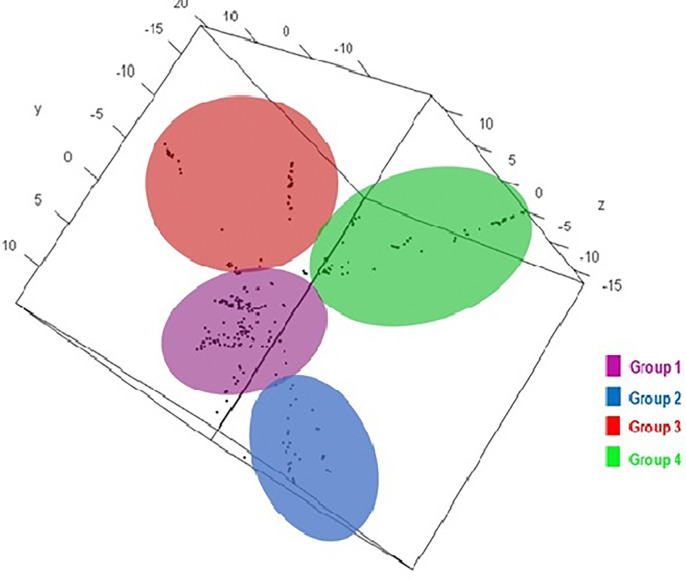
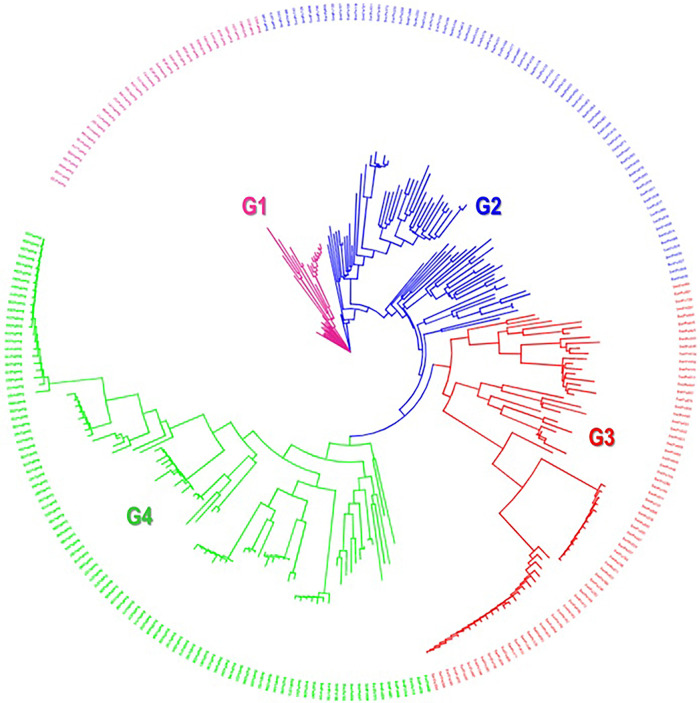
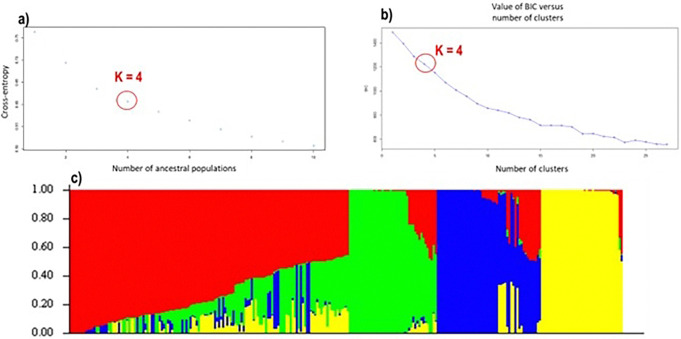
Results: 29,523 Diversity Arrays Technology (DArTseq) single nucleotide polymorphism markers were used to genotype 271 sweetpotato accessions. Genetic diversity analysis revealed an average polymorphic information content (PIC) value of 0.39, a minor allele frequency of 0.26, and an observed heterozygosity of 10%. The highest value of polymorphic information content (PIC) (0.41) was observed in chromosomes 4, while the highest proportion of heterozygous (He) (0.18) was observed in chromosomes 11. Molecular diversity revealed high values of polymorphic sites (Ps), theta (θ), and nucleotide diversity (π) with 0.973, 0.158, and 0.086, respectively, which indicated high genetic variation. The pairs of genetic distances revealed a range from 0.08 to 0.47 with an overall average of 0.34. Population structure analysis divided the 271 accessions into four populations (population 1 was characterised by a mixture of accessions from all countries; population 2, mostly comprised of Nigerian breeding lines; population 3 contained exclusively landraces from Benin; and population 4 was composed by only landraces from West African countries) at K = 4, and analysis of molecular variance (AMOVA) based on PhiPT values showed that most of the variation was explained when accessions were categorized based on population structure at K = 4 (25.25%) and based on cluster analysis (19.43%). Genetic distance showed that group 4 (which constituted by landraces of Niger and Benin) was genetically distant (0.428) from groups 2 (formed by 75% of breeding lines of Nigeria), while group 1 was the closest (0.182) to group 2.
Conclusions: This study employed 7,591 DArTseq-based SNP markers, revealing extensive polymorphism and variation within and between populations. Variability among countries of origin (11.42%) exceeded that based on biological status (9.13%) and storage root flesh colour (7.90%), emphasizing the impact of migration on genetic diversity. Population structure analysis using principal component analysis (PCA), Neighbor-Joining (NJ) tree, and STRUCTURE at K = 4 grouped 271 accessions into distinct clusters, irrespective of their geographic origins, indicating widespread genetic exchange. Group 4, dominated by landraces (95%), showed significant genetic differentiation (Nei's Gst = 0.428) from Group 2, mainly comprising breeding lines, suggesting their potential as heterotic groups for breeding initiatives like HEBS or ABS.
Copyright: © 2025 Mahaman Mourtala et al. This is an open access article distributed under the terms of the Creative Commons Attribution License, which permits unrestricted use, distribution, and reproduction in any medium, provided the original author and source are credited.
Conflict of interest statement
The authors declare that they have no competing interests.
Figures
References
-
- Sweetpotato Lebot V. Root and tuber crops: Handbook of plant breeding. In: Bradshaw JE, editor. Springer. in Bradshaw, ed. New York, NY: Springer New York; 2010. p. 97–125.
-
- Zhang D, Rossel G, Kriegner A, Hijmans R. AFLP assessment of diversity in sweetpotato from Latin America and the Pacific region: Its implications on the dispersal of the crop. Genet Resour Crop Evol. 2004; 51:115–20.
-
- Austin DF. The taxonomy, evolution and genetic diversity of sweet potato and related wilds species. In: Exploration, maintenance, and utilization of sweet potato genetic resources -Report of the First Sweet Potato Planning Conference. Lima, Peru; 1987.
-
- Zhang DP, Carbajulca D, Ojeda L, Rossel G, Milla S, Herrera C. Microsatellite analysis of genetic diversity in sweetpotato varieties from Latin America. CIP program report 1999–2000. Lima, Peru; 2000.
MeSH terms
LinkOut - more resources
Full Text Sources
Research Materials
Miscellaneous
