

Trends in childhood cancer: Incidence and survival analysis over 45 years of SEER data
- PMID: 39752445
- PMCID: PMC11698462
- DOI: 10.1371/journal.pone.0314592
Trends in childhood cancer: Incidence and survival analysis over 45 years of SEER data
Abstract
Background: The SEER Registry contains U.S. cancer statistics. To assess trends in incidence and survival and the impact of demographic factors among pediatric patients with cancer, we assessed nearly 5 decades (1975-2019) of data.
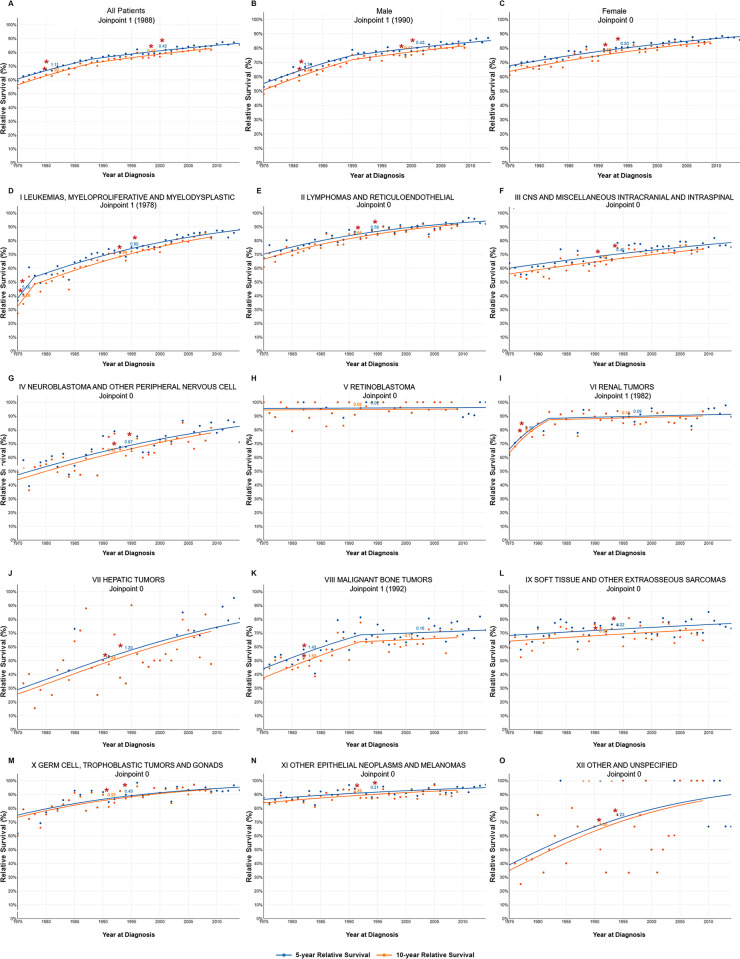
Methods: All patients below the age of 20 with histology-confirmed malignancy were studied. Kaplan-Meier survival curves were generated to evaluate survival trends across treatment periods and ICCC classes. JoinPoint analysis was conducted to identify changes in incidence and survival.
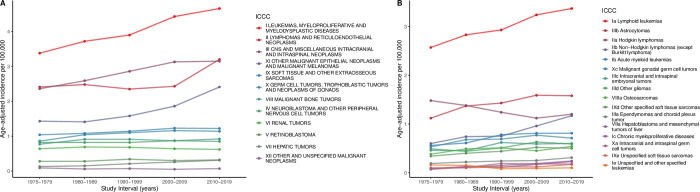
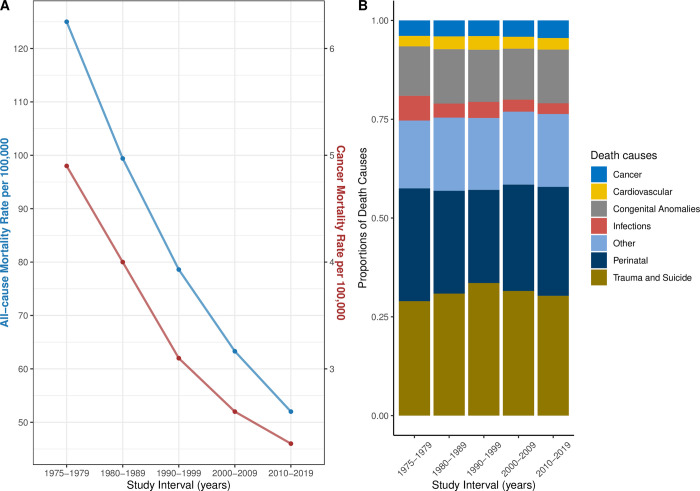
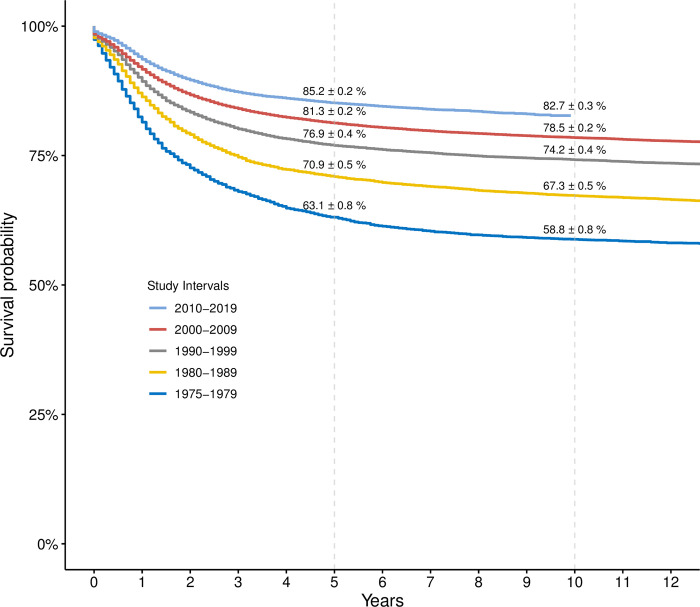
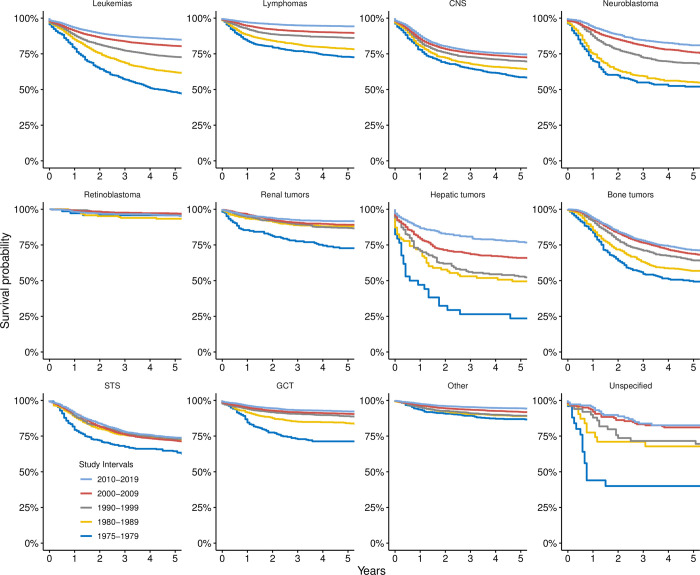
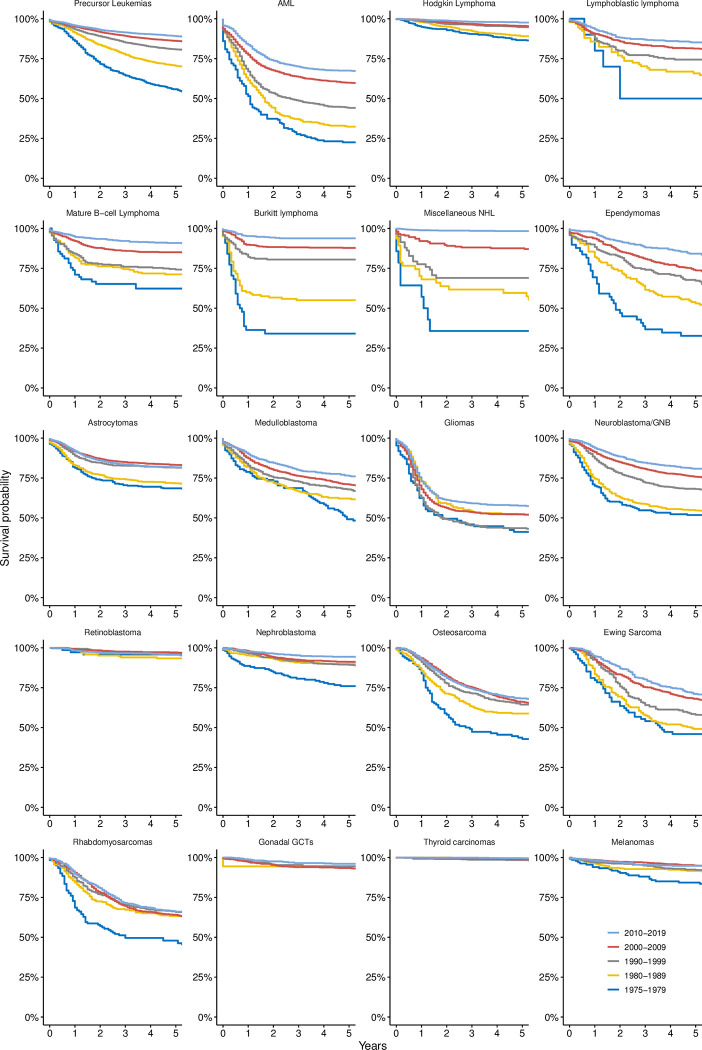
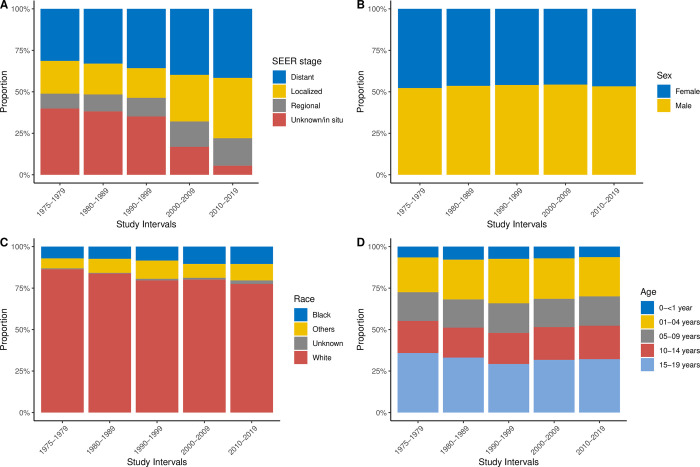
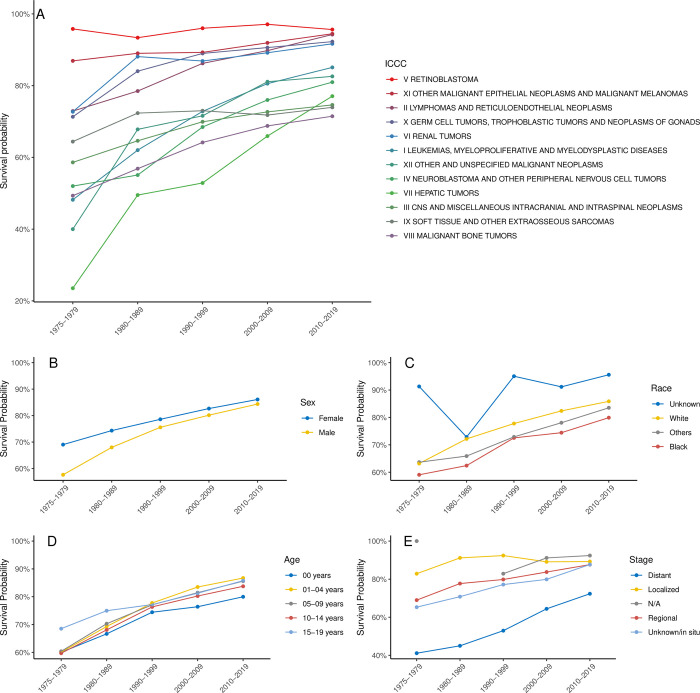
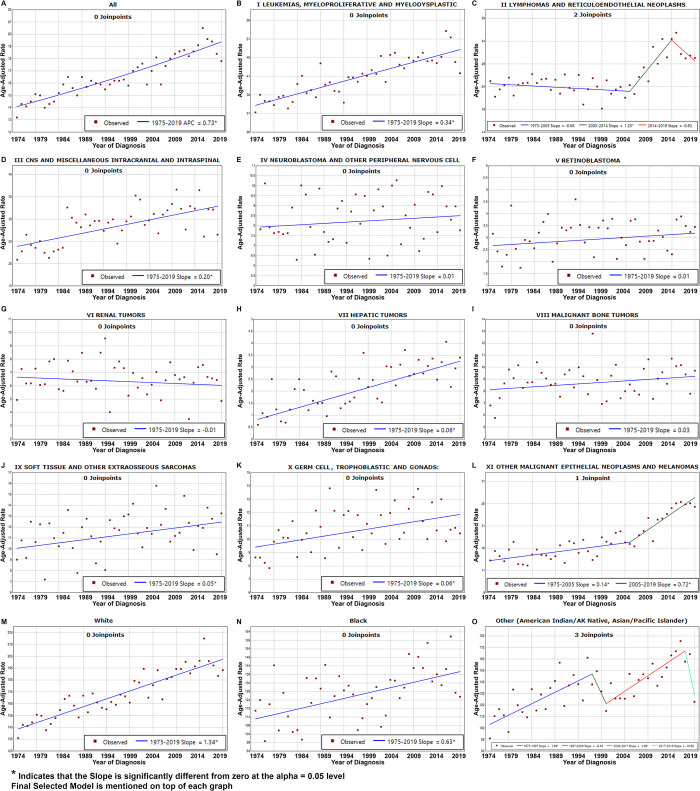
Results: The incidence of childhood cancer increased from 14.23 cases per 100,000 children in 1975-1979 to 18.89 in 2010-2019, with an average annual percent change of 0.73. This rise was more pronounced in several cancers, including leukemias, lymphomas, brain tumors, hepatic tumors, and gonadal germ cell tumors. Age-adjusted cancer mortality decreased from 4.9 to 2.3 per 100,000. Cancer-related mortality was consistently higher in boys than in girls, and in Black children than in White children. Survival significantly improved, with 5- and 10-year survival rates rising from 63.1% to 85.2% and from 58.8% to 82.7%, respectively. Leukemias showed a substantial increase in 5-year survival from 48.2% ± 1.7% to 85.1% ± 0.4% in 2010-2019. Lymphomas also showed significant improvement, with survival increasing from 72.9% ± 1.7% to 94.2% ± 0.3%. Despite these improvements, the survival of CNS tumors, bone tumors, and sarcomas remained suboptimal, with 5-year survival estimates of approximately 60%. Our joinpoint analysis confirmed our findings but revealed an interesting increase in the incidence of lymphomas limited to the years between 2005 and 2014.
Conclusion: This research elucidates advancements in survival among pediatric patients with cancer. The results offer critical perspectives on pediatric oncology, highlighting the imperative for ongoing innovation in therapeutics. Although the increase in incidence may partially stem from enhanced diagnostic capabilities and more comprehensive registration processes, the underlying causes remain unclear.
Copyright: © 2025 Sultan et al. This is an open access article distributed under the terms of the Creative Commons Attribution License, which permits unrestricted use, distribution, and reproduction in any medium, provided the original author and source are credited.
Conflict of interest statement
The authors have declared that no competing interests exist.
Figures
References
-
- Pfister SM, Reyes-Mugica M, Chan JKC, Hasle H, Lazar AJ, Rossi S, et al. A Summary of the Inaugural WHO Classification of Pediatric Tumors: Transitioning from the Optical into the Molecular Era. Cancer discovery. 2022;12(2):331–55. Epub 2021/12/19. doi: 10.1158/2159-8290.CD-21-1094 ; PubMed Central PMCID: PMC9401511. - DOI - PMC - PubMed
MeSH terms
LinkOut - more resources
Full Text Sources
Medical
