. 2025 Jan 3;20(1):e0315981.
doi: 10.1371/journal.pone.0315981. eCollection 2025.

Uncovering NK cell sabotage in gut diseases via single cell transcriptomics

Affiliations

Uncovering NK cell sabotage in gut diseases via single cell transcriptomics

Hansong Lee et al. PLoS One. .

Abstract

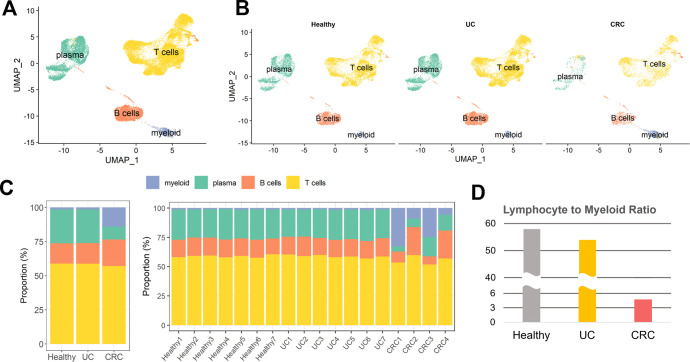
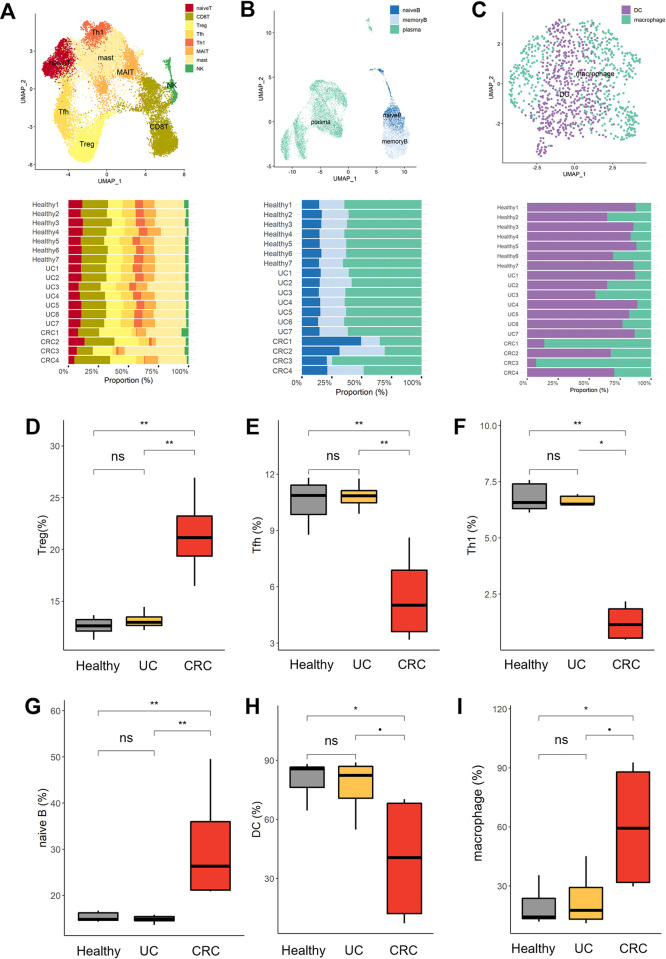
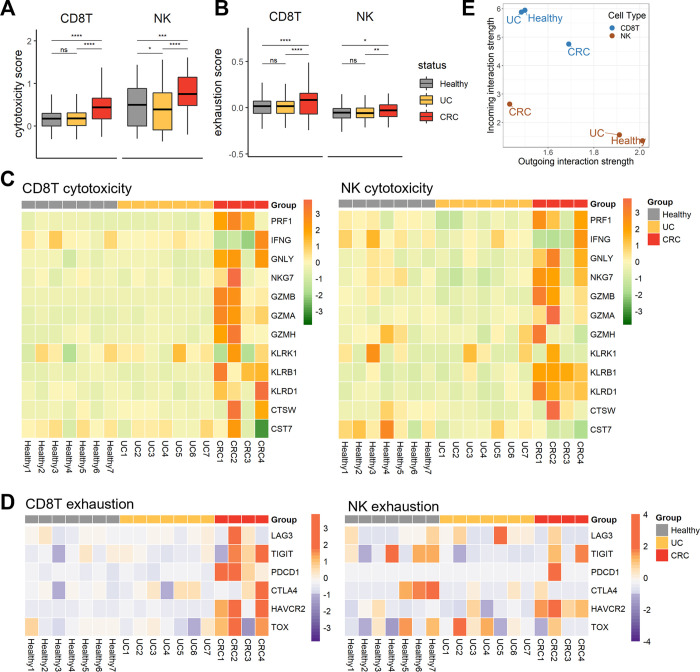
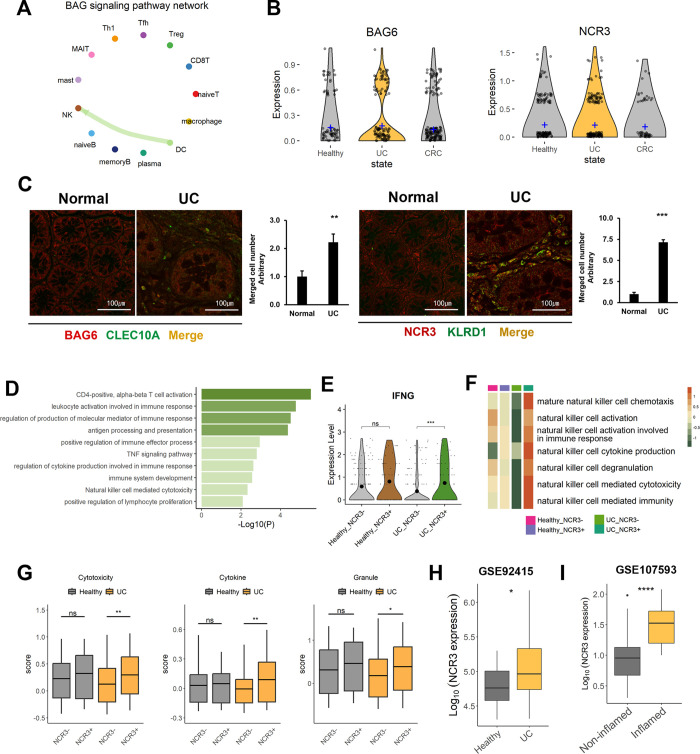
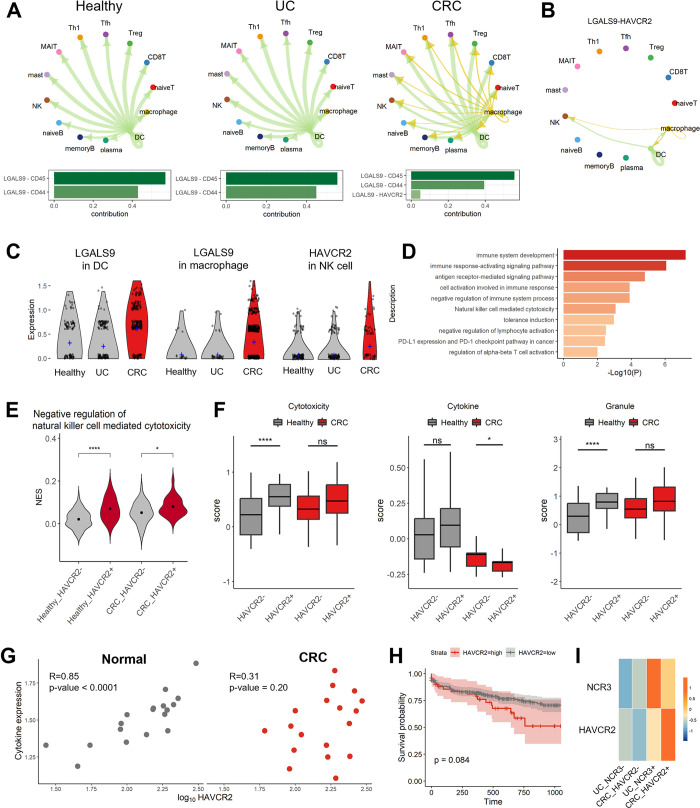
The identification of immune environments and cellular interactions in the colon microenvironment is essential for understanding the mechanisms of chronic inflammatory disease. Despite occurring in the same organ, there is a significant gap in understanding the pathophysiology of ulcerative colitis (UC) and colorectal cancer (CRC). Our study aims to address the distinct immunopathological response of UC and CRC. Using single-cell RNA sequencing datasets, we analyzed the profiles of immune cells in colorectal tissues obtained from healthy donors, UC patients, and CRC patients. The colon tissues from patients and healthy participants were visualized by immunostaining followed by laser confocal microscopy for select targets. Natural killer (NK) cells from UC patients on medication showed reduced cytotoxicity compared to those from healthy individuals. Nonetheless, a UC-specific pathway called the BAG6-NCR3 axis led to higher levels of inflammatory cytokines and increased the cytotoxicity of NCR3+ NK cells, thereby contributing to the persistence of colitis. In the context of colorectal cancer (CRC), both NK cells and CD8+ T cells exhibited significant changes in cytotoxicity and exhaustion. The GALECTIN-9 (LGALS9)-HAVCR2 axis was identified as one of the CRC-specific pathways. Within this pathway, NK cells solely communicated with myeloid cells under CRC conditions. HAVCR2+ NK cells from CRC patients suppressed NK cell-mediated cytotoxicity, indicating a reduction in immune surveillance. Overall, we elucidated the comprehensive UC and CRC immune microenvironments and NK cell-mediated immune responses. Our findings can aid in selecting therapeutic targets that increase the efficacy of immunotherapy.


Conflict of interest statement

The authors declare no conflicts of interest.

Figures

Fig 1
Fig 1. Overview of the scRNA-seq profiles of immune cells from healthy controls, UC, and CRC patients.
(A) UMAP plot of annotated cell types. Myeloid, T, B, and plasma cells were identified. (B) UMAP visualization split by disease status. (C) Stacked bar plot of immune cell proportions. The proportions for each group are shown in the left panel, and those for each individual are shown in the right panel. (D) Lymphocyte-to-myeloid ratio according to disease status.
Fig 2
Fig 2. High-resolution cell compartment analysis.
(A) UMAP and proportion bar plot of subclustered T cells. The T cells in Fig 1A were reclustered and identified into hierarchical subclusters of T cells and NK cells. The subclusters identified included naive T cells, CD8T cells, regulatory T (Treg) cells, follicular helper T (Tfh) cells, type 1 helper T (Th1) cells, Mucosal-associated invariant T (MAIT) cells, and mast and natural killer (NK) cells. The stacked bar plot shows the proportions of cells in the T-cell lineage and NK cells. (B) UMAP and proportion bar plot of subclustered B cells. As B cells and plasma cells are positioned on the same differentiation lineage, B cells and plasma cells were grouped simultaneously. Subclustering identified naive B, memory B, and plasma cells. The stacked bar plot shows the proportions of B-cell subtypes. (C) UMAP and proportion bar plot of myeloid cells. The myeloid cell group shown in Fig 1A was reclustered and identified as macrophages and dendritic cells (DCs). The stacked bar plot shows the proportions of myeloid cell subtypes. (D-I) The proportions of immune cells in healthy, UC and CRC patients. The boxplot represents the ratio of cellular components for (D) Tregs, (E) Tfh cells, (F) Th1 cells, (G) naive B cells, (H) DCs and (I) macrophages under each condition. The horizontal line indicates the mean ratio, and the Wilcoxon test was performed to compare two groups. p ≤ 0.1 (•), p ≤ 0.05 (*), p ≤ 0.01 (**), p ≤ 0.001 (***), p ≤ 0.0001 (****), not significant (ns).
Fig 3
Fig 3
The altered traits of effector cells, CD8+ T cells, and NK cells. (A) Box plots of the cytotoxicity scores of NK and CD8+ T cells. The x-axis indicates three groups, healthy, UC, and CRC, and the horizontal line in the box shows the average score. To explore the significance of the differences, the Wilcoxon test was performed; p ≤ 0.05 (*), p ≤ 0.01 (**), p ≤ 0.001 (***), p ≤ 0.0001 (****), and not significant (ns). (B) Box plots of exhaustion scores in NK and CD8+ T cells. Like in Fig 3A, the scores were compared. (C) Heatmap of cytotoxicity-associated genes across participants. The genes used for cytotoxicity scoring are listed, and scaled expression levels of the genes are shown. (D) Heatmap of exhaustion-associated genes spanning participants. The genes used for exhaustion scoring are listed, and scaled expression levels of the genes are shown. (E) Inferred interaction strength of CD8+ T cells and NK cells as a sender and a receiver. The X-axis indicates the outgoing interaction strength of CD8+ T cells and NK cells, which served as signal senders for each condition. The Y-axis indicates the incoming interaction strength of CD8+ T cells and NK cells, which serve as signal receivers for each condition.
Fig 4
Fig 4. UC-specific cell‒cell communication network among tissue-resident immune cells.
(A) Circle plot of cell‒cell interactions in the BAG pathway in UC patients. For each immune cell type, the color of a dot is assigned, and the color of the arrow is the same as the color of the cell type that sends the signal. (B) Gene expression of the ligand BAG6 and the receptor NCR3. The violin plots for BAG6 are normalized transcripts in DCs (left), and those for NCR3 are normalized in NK cells (right). The crossbar of the plot indicates the average expression level of each transcript. (C) Comparison of BAG6 and NCR3 expression in normal and UC patient tissues through immunostaining. BAG6 expression was explored in DC (CLEC10A) cells, and NCR3 was explored in NK (KLRD1) cells. To explore the significance of the difference, the Wilcoxon test was performed; p ≤ 0.05 (*), p ≤ 0.01 (**), p ≤ 0.001 (***), p ≤ 0.0001 (****), and not significant (ns). (D) Functional analysis of differentially coexpressed genes in NCR3+ NK cells compared to NCR3- NK cells in the UC group. Immune-related pathways associated with P<0.05 are shown. (E) Violin plot of IFNG expression in healthy donors and UC patients separated by NCR3 expression in NK cells. The statistical significance was determined using the Wilcoxon test; p ≤ 0.05 (*), p ≤ 0.01 (**), p ≤ 0.001 (***), p ≤ 0.0001 (****), and not significant (ns). (F) GSVA of NCR3+ NK cells from UC patients. Heatmaps depicting NK cell-related pathway activities according to the presence of NCR3 expression in the healthy and UC groups. The color bar indicates the NES, with higher activity represented in orange and lower activity in green. (G) Boxplot of cytotoxicity in NK cells separated according to the expression of NCR3. The groups were separated by the presence (+) or absence (-) of NCR3 expression in healthy controls and UC patients, and the color is presented according to the disease condition. To calculate the score, we utilized the expression levels of cytokine-encoding genes (IFNG, TNF, CSF2, IL10, and IL15) and granule-encoding genes (PRF1, GZMB, GZMA, GZMH, GZMM, GZMK, NKG7, and GNLY). In each panel of the boxplot, the overall cytotoxicity of NK cells was measured using total cytokine- and granule-encoding genes (left), cytokine-mediated toxicity (middle), and granule-mediated toxicity (right). The horizontal line in the box indicates the average score, and Wilcoxon signed-rank test was performed; p ≤ 0.05 (*), p ≤ 0.01 (**), p ≤ 0.001 (***), p ≤ 0.0001 (****), not significant (ns). (H-I) Expression level of NCR3 in GEO datasets, GSE92415 (H) and GSE107593 (I).
Fig 5
Fig 5. CRC-specific intercellular signaling pathways.
(A) The GALECTIN pathway according to disease condition. Each immune cell type is assigned the color of a circle, and the color of the arrow is the same as the color of the cell type sending the signal. (B) Circle plot of the interaction between the LGALS9-HAVCR2 pair and the GALECTIN pathway in healthy donors, UC patients, and CRC patients. (C) Gene expression levels of a ligand and a receptor in the GALECTIN pathway. The violin plot shows the expression levels of the ligand LGALS9 in DCs and macrophages and the receptor HAVCR2 in NK cells. The crossbar indicates the average expression level of transcripts in each status. (D) Immunological functions of differentially coexpressed genes in HAVCR2+ NK cells compared to HAVCR2- NK cells in the CRC group. To determine the significance of the differences, the Wilcoxon test was performed; p ≤ 0.05 (*), p ≤ 0.01 (**), p ≤ 0.001 (***), p ≤ 0.0001 (****), and not significant (ns). (E) Violin plot of NES for negative regulation of natural killer cell-mediated cytotoxicity. The groups were separated based on disease condition and the expression of HAVCR2. (F) Boxplot of cytotoxicity in NK cells separated according to HAVCR2 expression. As shown in Fig 4G, groups were separated by the presence (+) or absence (-) of HAVCR2 expression in healthy individuals and CRC patients. (G) Correlation between HAVCR2 and cytokine expression levels. The correlation coefficients and p-values are displayed in the upper left. (H) Kaplan-Meier survival plot for 3 years. The 371 CRC patients from TCGA-COAD are classified based on the expression levels of HAVCR2, and survival plot is described in days. (I) The expression level of NCR3 and HAVCR2 in NK cells of UC and CRC patients. The groups are categorized based on the expression levels of NCR3 and HAVCR2 with disease.

Similar articles

References

    1. The global, regional, and national burden of inflammatory bowel disease in 195 countries and territories, 1990–2017: a systematic analysis for the Global Burden of Disease Study 2017. Lancet Gastroenterol Hepatol. 2020;5(1):17–30. doi: 10.1016/S2468-1253(19)30333-4 - DOI - PMC - PubMed
    1. Avramidou M, Angst F, Angst J, Aeschlimann A, Rossler W, Schnyder U. Epidemiology of gastrointestinal symptoms in young and middle-aged Swiss adults: prevalences and comorbidities in a longitudinal population cohort over 28 years. BMC Gastroenterol. 2018;18(1):21. - PMC - PubMed
    1. Wang R, Li Z, Liu S, Zhang D. Global, regional, and national burden of 10 digestive diseases in 204 countries and territories from 1990 to 2019. Front Public Health. 2023;11:1061453. doi: 10.3389/fpubh.2023.1061453 - DOI - PMC - PubMed
    1. Ferlay J, Soerjomataram I, Dikshit R, Eser S, Mathers C, Rebelo M, et al.. Cancer incidence and mortality worldwide: sources, methods and major patterns in GLOBOCAN 2012. Int J Cancer. 2015;136(5):E359–86. doi: 10.1002/ijc.29210 - DOI - PubMed
    1. Kuipers EJ, Grady WM, Lieberman D, Seufferlein T, Sung JJ, Boelens PG, et al.. Colorectal cancer. Nat Rev Dis Primers. 2015;1:15065. doi: 10.1038/nrdp.2015.65 - DOI - PMC - PubMed

MeSH terms