

cSTAR analysis identifies endothelial cell cycle as a key regulator of flow-dependent artery remodeling
- PMID: 39752487
- PMCID: PMC11698091
- DOI: 10.1126/sciadv.ado9970
cSTAR analysis identifies endothelial cell cycle as a key regulator of flow-dependent artery remodeling
Abstract
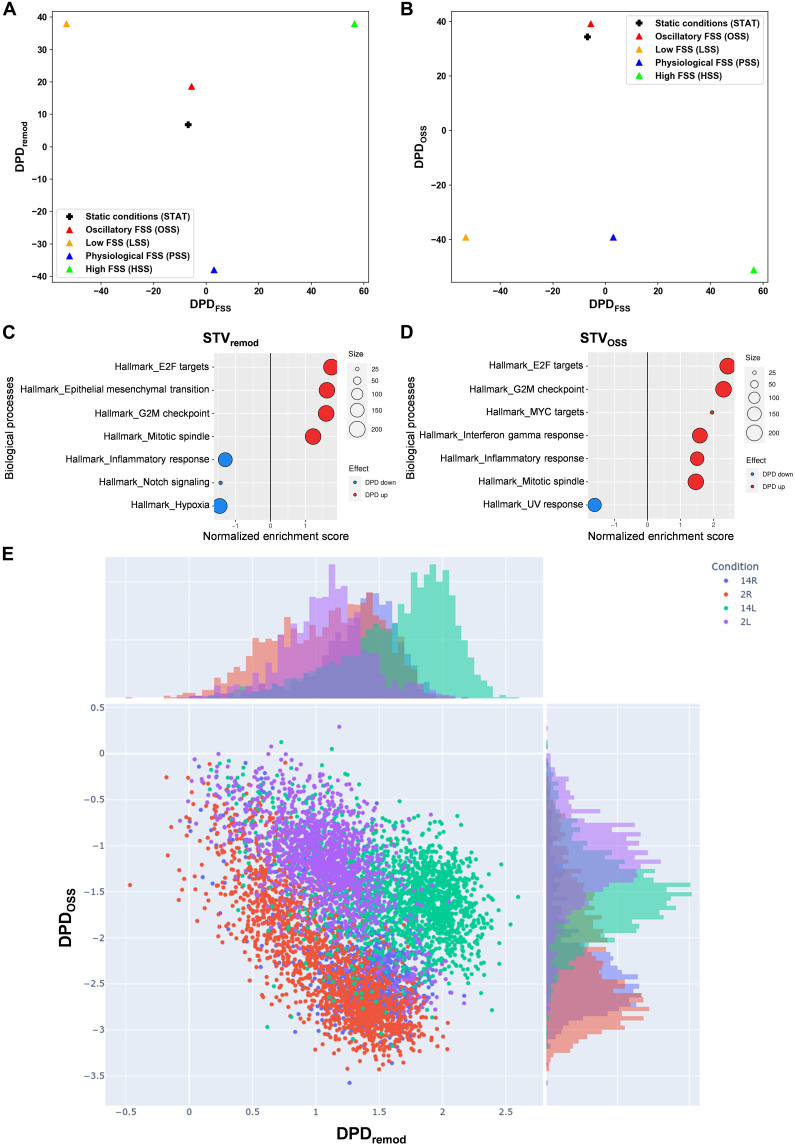
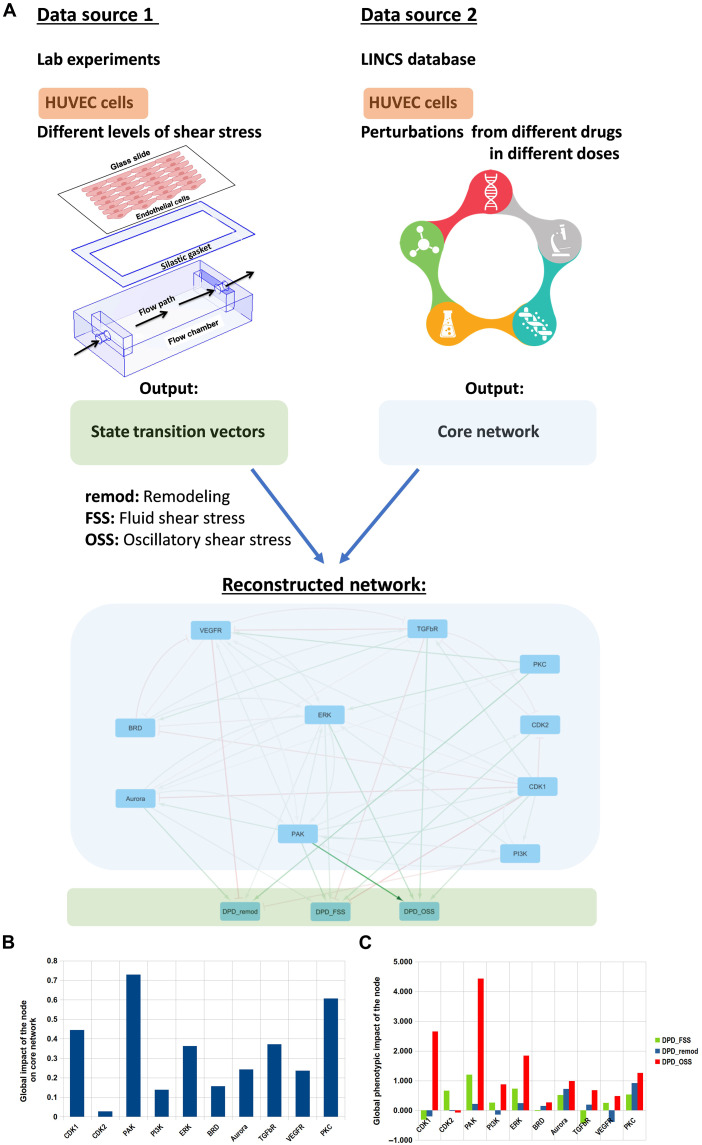
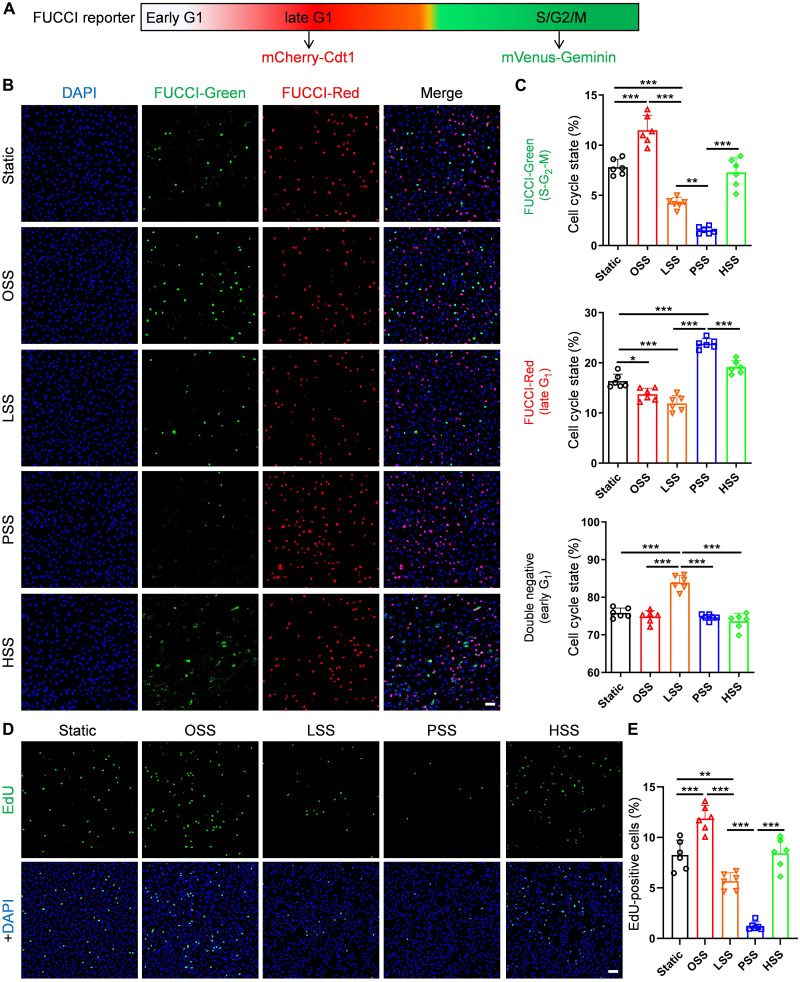
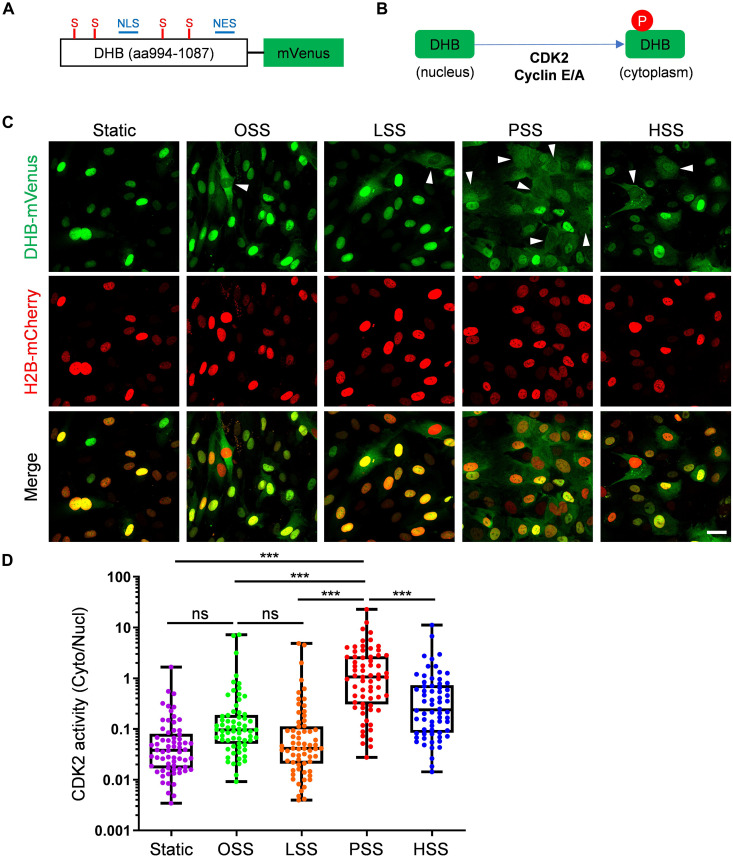
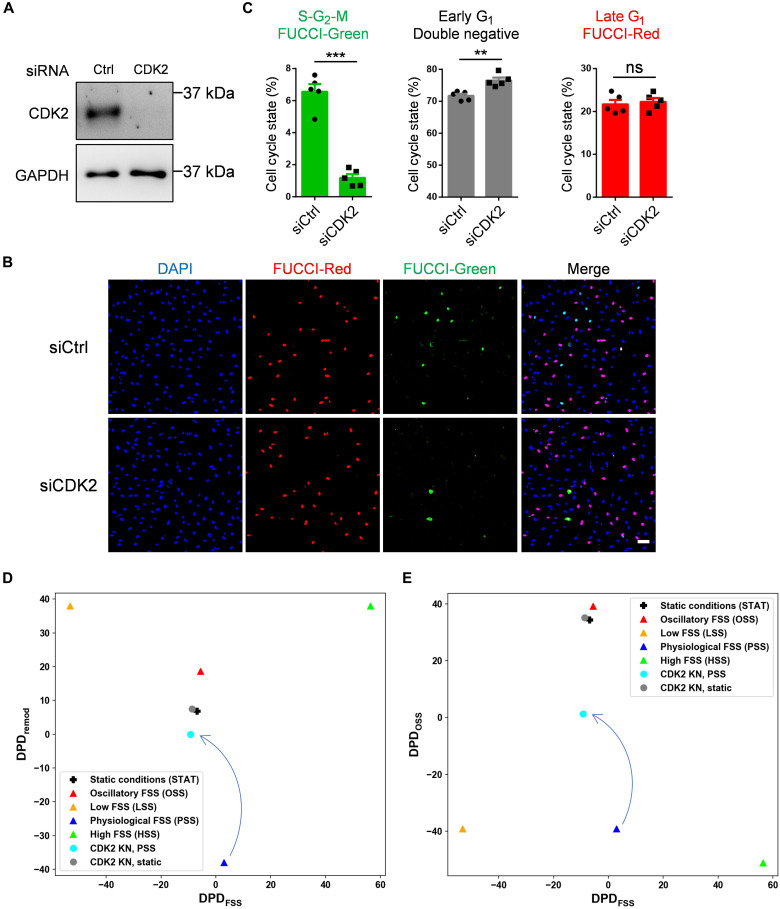
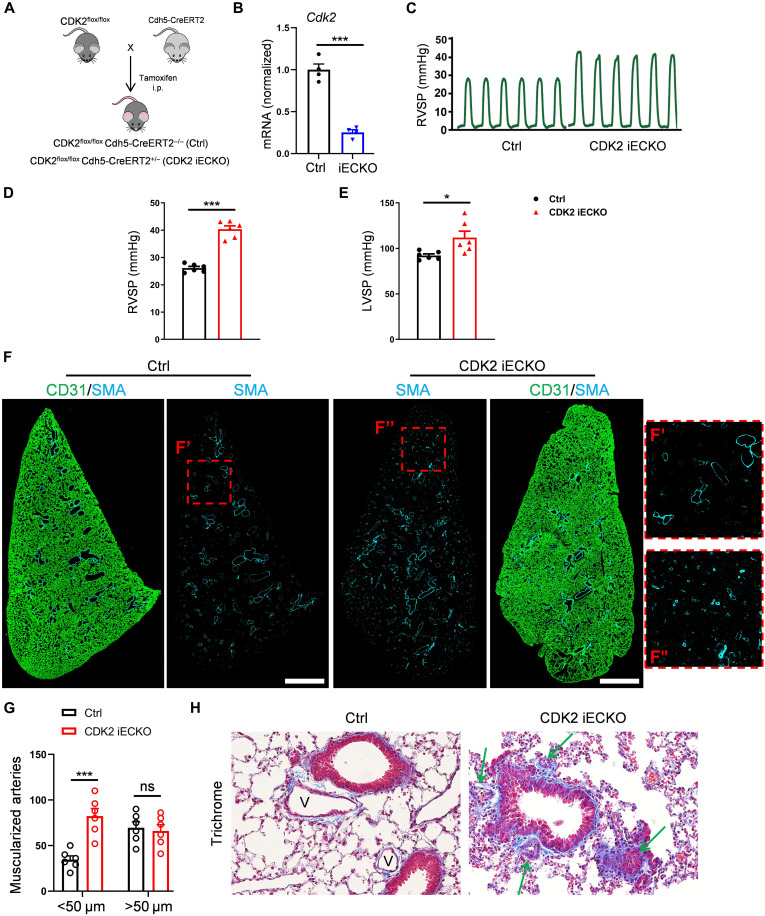
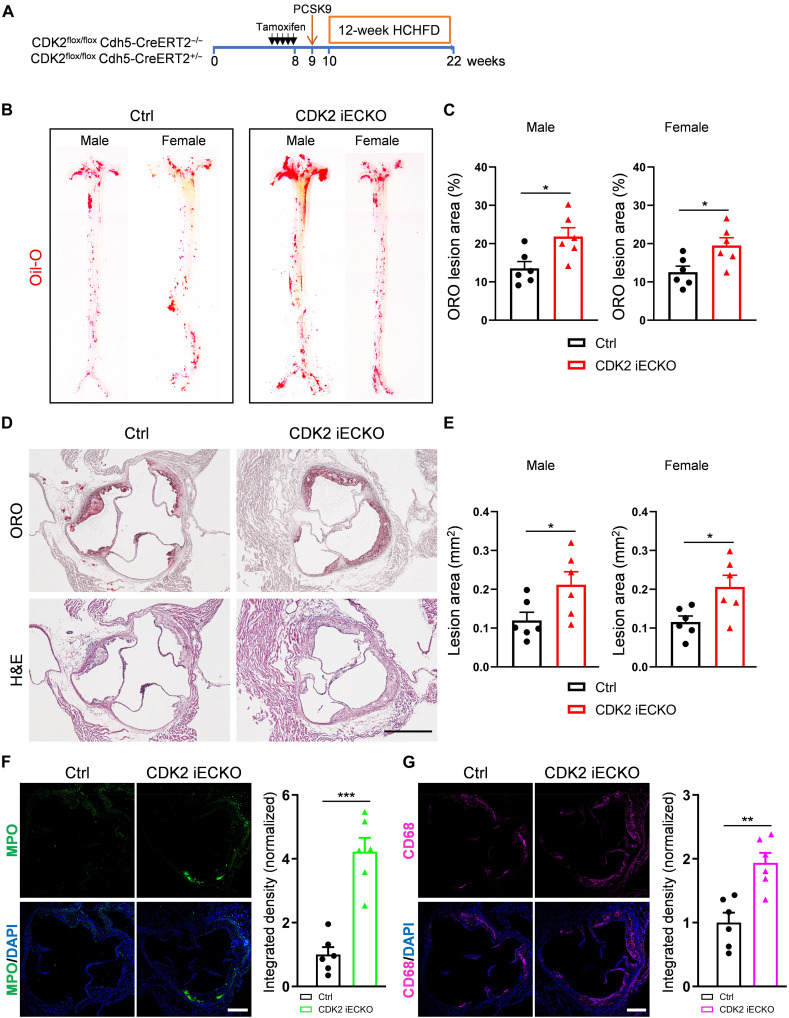
Fluid shear stress (FSS) from blood flow sensed by vascular endothelial cells (ECs) determines vessel behavior, but regulatory mechanisms are only partially understood. We used cell state transition assessment and regulation (cSTAR), a powerful computational method, to elucidate EC transcriptomic states under low shear stress (LSS), physiological shear stress (PSS), high shear stress (HSS), and oscillatory shear stress (OSS) that induce vessel inward remodeling, stabilization, outward remodeling, or disease susceptibility, respectively. Combined with a publicly available database on EC transcriptomic responses to drug treatments, this approach inferred a regulatory network controlling EC states and made several notable predictions. Particularly, inhibiting cell cycle-dependent kinase (CDK) 2 was predicted to initiate inward remodeling and promote atherogenesis. In vitro, PSS activated CDK2 and induced late G1 cell cycle arrest. In mice, EC deletion of CDK2 triggered inward artery remodeling, pulmonary and systemic hypertension, and accelerated atherosclerosis. These results validate use of cSTAR and identify key determinants of normal and pathological artery remodeling.
Figures
Update of
-
cSTAR analysis identifies endothelial cell cycle as a key regulator of flow-dependent artery remodeling.bioRxiv [Preprint]. 2023 Oct 25:2023.10.24.563764. doi: 10.1101/2023.10.24.563764. bioRxiv. 2023. Update in: Sci Adv. 2025 Jan 3;11(1):eado9970. doi: 10.1126/sciadv.ado9970. PMID: 37961694 Free PMC article. Updated. Preprint.
Similar articles
-
Fluid Shear Stress-Regulated Vascular Remodeling: Past, Present, and Future.Arterioscler Thromb Vasc Biol. 2025 Jun;45(6):882-900. doi: 10.1161/ATVBAHA.125.322557. Epub 2025 Apr 10. Arterioscler Thromb Vasc Biol. 2025. PMID: 40207366 Review.
-
cSTAR analysis identifies endothelial cell cycle as a key regulator of flow-dependent artery remodeling.bioRxiv [Preprint]. 2023 Oct 25:2023.10.24.563764. doi: 10.1101/2023.10.24.563764. bioRxiv. 2023. Update in: Sci Adv. 2025 Jan 3;11(1):eado9970. doi: 10.1126/sciadv.ado9970. PMID: 37961694 Free PMC article. Updated. Preprint.
-
Activation of Smad2/3 signaling by low fluid shear stress mediates artery inward remodeling.Proc Natl Acad Sci U S A. 2021 Sep 14;118(37):e2105339118. doi: 10.1073/pnas.2105339118. Proc Natl Acad Sci U S A. 2021. PMID: 34504019 Free PMC article.
-
Endothelial cell (EC)-specific Ctgf/Ccn2 expression increases EC reprogramming and atherosclerosis.Matrix Biol. 2025 Apr;136:102-110. doi: 10.1016/j.matbio.2025.01.003. Epub 2025 Jan 14. Matrix Biol. 2025. PMID: 39818254
-
Flow pattern-dependent endothelial cell responses through transcriptional regulation.Cell Cycle. 2017 Oct 18;16(20):1893-1901. doi: 10.1080/15384101.2017.1364324. Epub 2017 Aug 18. Cell Cycle. 2017. PMID: 28820314 Free PMC article. Review.
Cited by
-
Silencing KRIT1 Partially Reverses the Effects of Disturbed Flow on the Endothelial Cell Transcriptome.Int J Mol Sci. 2025 May 2;26(9):4340. doi: 10.3390/ijms26094340. Int J Mol Sci. 2025. PMID: 40362576 Free PMC article.
-
Fluid Shear Stress-Regulated Vascular Remodeling: Past, Present, and Future.Arterioscler Thromb Vasc Biol. 2025 Jun;45(6):882-900. doi: 10.1161/ATVBAHA.125.322557. Epub 2025 Apr 10. Arterioscler Thromb Vasc Biol. 2025. PMID: 40207366 Review.
-
Disruption of the novel nested gene Aff3ir mediates disturbed flow-induced atherosclerosis in mice.Elife. 2025 May 2;13:RP103413. doi: 10.7554/eLife.103413. Elife. 2025. PMID: 40315012 Free PMC article.
-
Endothelial heterogeneity shapes shear stress response: a transcriptomic perspective.Res Pract Thromb Haemost. 2025 Jun 10;9(4):102927. doi: 10.1016/j.rpth.2025.102927. eCollection 2025 May. Res Pract Thromb Haemost. 2025. PMID: 40678354 Free PMC article. No abstract available.
-
Silencing KRIT1 Partially Reverses the Effects of Disturbed Flow on the Endothelial Cell Transcriptome.bioRxiv [Preprint]. 2025 Mar 14:2025.03.12.642862. doi: 10.1101/2025.03.12.642862. bioRxiv. 2025. Update in: Int J Mol Sci. 2025 May 02;26(9):4340. doi: 10.3390/ijms26094340. PMID: 40161739 Free PMC article. Updated. Preprint.
References
-
- Aitken C., Mehta V., Schwartz M. A., Tzima E., Mechanisms of endothelial flow sensing. Nat. Cardiovasc. Res. 2, 517–529 (2023). - PubMed
-
- Tiezzi M., Deng H., Baeyens N., Endothelial mechanosensing: A forgotten target to treat vascular remodeling in hypertension? Biochem. Pharmacol. 206, 115290 (2022). - PubMed
MeSH terms
Substances
Grants and funding
LinkOut - more resources
Full Text Sources
Molecular Biology Databases
