. 2025 Jan 3;11(1):eadp1949.
doi: 10.1126/sciadv.adp1949. Epub 2025 Jan 3.

Global niche partitioning of purine and pyrimidine cross-feeding among ocean microbes

Affiliations

Global niche partitioning of purine and pyrimidine cross-feeding among ocean microbes

Rogier Braakman et al. Sci Adv. .

Abstract

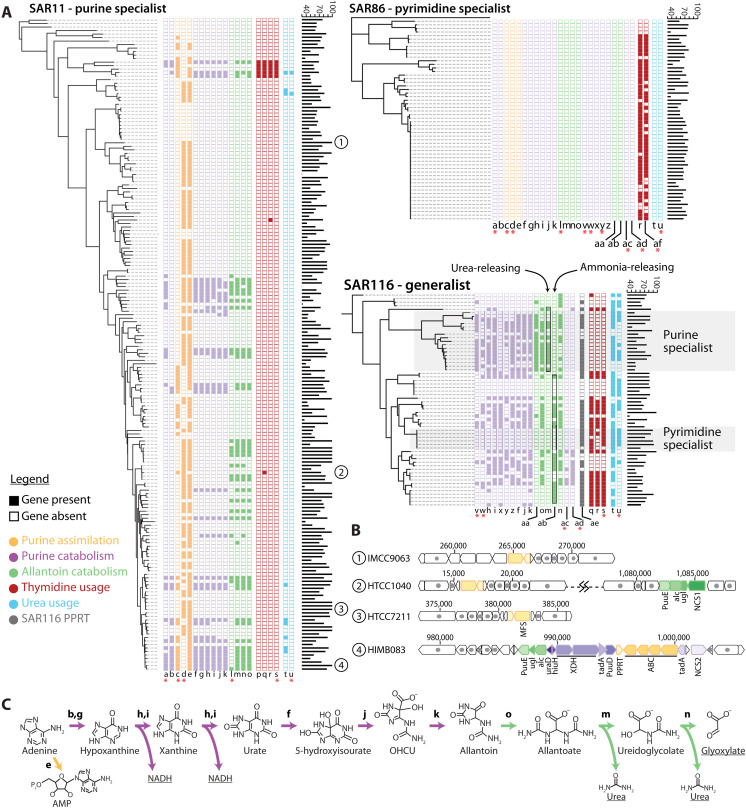
Cross-feeding involves microbes consuming exudates of other surrounding microbes, mediating elemental cycling. Characterizing the diversity of cross-feeding pathways in ocean microbes illuminates evolutionary forces driving self-organization of ocean ecosystems. Here, we uncover a purine and pyrimidine cross-feeding network in globally abundant groups. The cyanobacterium Prochlorococcus exudes both compound classes, which metabolic reconstructions suggest follows synchronous daily genome replication. Co-occurring heterotrophs differentiate into purine- and pyrimidine-using generalists or specialists that use compounds for different purposes. The most abundant heterotroph, SAR11, is a specialist that uses purines as sources of energy, carbon, and/or nitrogen, with subgroups differentiating along ocean-scale gradients in the supply of energy and nitrogen, in turn producing putative cryptic nitrogen cycles that link many microbes. Last, in an SAR11 subgroup that dominates where Prochlorococcus is abundant, adenine additions to cultures inhibit DNA synthesis, poising cells for replication. We argue that this subgroup uses inferred daily adenine pulses from Prochlorococcus to synchronize to the daily photosynthate supply from surrounding phytoplankton.


Figures

Fig. 1.
Fig. 1.. Extra- and intracellular pyrimidines and purines in cultures of Prochlorococcus.
Extracellular levels of the pyrimidine thymidine (orange), and the purines adenine, guanine, and 5-methylthioadenosine (shades of blue) are normalized to the total amounts of purines or pyrimidines incorporated into DNA and shown alongside cytosolic concentrations (gray shading) of these compounds, for three different strains of Prochlorococcus grown under different conditions, as measured in a complementary study (21). Error bars show the SD between biological replicates. Light levels are in units of μmol photons m−2 s−1, “R” stands for batch culture growth in nutrient replete media, and “–P” stands for growth under semicontinuous phosphorus limitation. Exudation levels of adenine and guanine (marked with asterisks) are uncorrected from the measured concentrations due to having an extraction efficiency of less than 1%. For a sense of scale relative to thymidine exudation levels, gray dashed bars are included at 100× the measured adenine and guanine levels (i.e., the theoretical correction factor for an extraction efficiency of 1%). Incidences in which metabolites were only detected in single replicates are denoted with “detected,” while incidences in which metabolites were not detected in any replicate are denoted with “nd.”
Fig. 2.
Fig. 2.. Putative deoxyribonucleotide recycling pathway in Prochlorococcus.
(A) Structure of the deoxyribonucleotide recycling pathway in relation to pathways for DNA and RNA synthesis and polyamine metabolism. Metabolites highlighted in boxes are exuded by Prochlorococcus (Fig. 1). (B) transcriptional dynamics of genes involved in the deoxyribonucleotide recycling pathway, as well as subunits of DNA and RNA polymerases, in Prochlorococcus MED4 cells synchronized to a diel light:dark cycle (29). In both panels, deoxyribonucleotide recycling pathway reactions/genes are highlighted using the orange spectrum, and DNA and RNA polymerase are highlighted in shades of blue. Abbreviations: NDP, nucleoside diphosphate; dNDP, deoxynucleoside diphosphate; NTP, nucleoside triphosphate; dNTP, deoxynucleoside triphosphate; dTMP, deoxythymidine monophosphate; dGMP, deoxyguanosine monophosphate; dAMP, deoxyadenosine monophosphate; dA, deoxyadenosine; MTA, 5-methyl-thioadenosine; SAMA, S-adenosylmethioninamine; PUT, putrescine; SPE, spermidine; MTRP, methyl-5-thioribose; PRPP, phosphoribose diphosphate; Pi, orthophosphate; SurE, survival protein E (5′-nucleotidase); MTAP, methylthioadenosine phosphorylase; apt, adenine phosphoribosyltransferase; SpeE, spermidine synthase; dnaE, DNA polymerase III alpha subunit, dnaN, DNA polymerase III subunit beta; dnaQ, polymerase III subunit epsilon; rpoB, RNA polymerase subunit beta; rpoC1, RNA polymerase subunit beta′; rpoC2, RNA polymerase subunit beta′′.
Fig. 3.
Fig. 3.. Niche partitioning of purine and thymidine usage in oceanic bacterioplankton.
(A) Phylometabolic diagrams show presence/absence of purine and pyrimidine usage genes in the abundant heterotrophic bacterioplankton groups SAR11, SAR86, and SAR116. Transporter genes are indicated with pink asterisks. Gene colors indicate different pathway functions as shown in the inset legend. Genome completeness statistics (%) are shown as bar graphs next to gene profiles. (B) Representative genome profiles of SAR11 subgroups specializing in either purine assimilation (IMCC9063 and HTCC7211), purine assimilation and allantoin catabolism (HTCC1040), or full purine catabolism (HIMB083). (C) Purine catabolism pathway in SAR11, with major degradation products underlined: energy in the form of NADH, carbon in the form of glyoxylate, and nitrogen in the form of urea. Genes: a, purine NCS2 permease; b, purine deaminase 2 (tadA); c, purine ABC transporter permease; d, purine MFS permease; e, purine phosphoribosyltransferase (PPRT); f, urate oxidase (PuuD); g, purine deaminase 1 (tadA); h, Xanthine dehydrogenase Mo-subunit (XDH_Mo); i, xanthine dehydrogenase FAD-subunit (XDH_FAD); j, 5-hydroxyisourate lyase (hiuH); k, 2-oxo-4-hydroxy-4-carboxy-5-ureidoimidazoline decarboxylase (OHCU decarboxylase, uraD); l, allantoin NCS1 permease; m, allantoicase (alc); n, ureidoglycolate lyase (ugl); o, allantoinase (PuuE); p, uracil phosphoribosyltransferase; q, cytidine deaminase; r, thymidine kinase; s, pyrimidine ABC transporter; t, urease; u, urea ABC transporter; v, purine ABC transporter; w, purine ABC transporter; x, XDH accessory protein; y, purine NCS2 permease; z, purine deaminase; aa, allantoin racemase; ab, ureidoglycine aminohydrolase; ac, purine TRAP transporter; ad, DMT transporter; ae, purine/pyrimidine phosphoribosyltransferase; af, CNT transporter.
Fig. 4.
Fig. 4.. Putative purine:urea-mediated cryptic nitrogen cycles among abundant ocean microbes.
Prochlorococcus and Thaumarcheota (and potentially Synechococcus, see text) supply purines that are used by SAR11. Different SAR11 cell types, labeled by representative strains (Fig. 3), have variants of purine catabolism as shown using sequences of reactions that perform different purine usage functions. Underlined metabolites (AMP, NADH, and glyoxylate) are the main products of purine assimilation/breakdown inferred to be used by the shown SAR11 cell types, while blue metabolites (adenine, allantoin, and urea) are inferred to be involved in cross-feeding interactions. Many SAR11 genomes, including the examples shown, lack the urease genes required to use urea, suggesting that it is released and available to surrounding cells of other groups, including Prochlorococcus, Thaumarcheota, and Synechococcus. Some SAR11 genomes lack purine catabolism genes but contain genes for using allantoin, which is inferred to be released by other SAR11 cells that incompletely catabolize purines. Colors of purine usage functions are as defined in Fig. 3: purine assimilation genes in yellow, purine catabolism genes in purple, and allantoin catabolism genes in green, while enzymes mediating different reactions are labeled with letters, also as defined in Fig. 3. Reactions marked with a red asterisk represent enzymes that in subsets of SAR11 genomes are collocated with transporter genes (Fig. 3). Black arrows represent inferred cross-feeding pathways.
Fig. 5.
Fig. 5.. Distribution of SAR11 purine usage genes.
Metagenomically derived estimates for the gene/genome frequency of different purine usage genes in SAR11 are shown as a function of (A) surface (i.e., upper 100 m) biogeography, (B) depth in the water column in the North Atlantic, and (C) inorganic nitrogen concentration. Purine usage functions are color coded as defined in Fig. 3. For surface biogeography panels, each data point represents the mean across samples within the upper 100 m of the water column at a given station. Spearman rank correlation coefficients (rS) of the correlation between gene/genome frequency and nitrogen concentration are shown as insets in panels on the right.
Fig. 6.
Fig. 6.. In situ expression of genes related to putative purine cross-feeding between Prochlorococcus and SAR11.
Normalized in situ expression of DNA polymerase (dnaE and dnaN) and RNA polymerase (rpoB and rpoC2) in Prochlorococcus, and of a SAR11 purine MFS permease, in the North Pacific Ocean [data from (51)]. Prochlorococcus genes are in dark blue, while the SAR11 transporter gene is in orange. The transition from DNA to RNA polymerase in Prochlorococcus is inferred to be associated with the release of purines (Fig. 2), while the SAR11 purine MFS transporter is inferred to be involved in the intact assimilation of purines (Figs. 3 and 4).
Fig. 7.
Fig. 7.. Growth and cell physiology of SAR11 HTCC7211 grown with and without adenine.
Top, growth curves of SAR11 cells in nutrient-balanced [(pyruvate):(glycine):(methionine) = 1:1:0.2] and glycine-depleted [(pyruvate):(glycine):(methionine) = 50:1:10] media amended with different concentrations of adenine (shades of blue). Black bars at the bottom reflect the time frame used to determine growth rates, which are shown in the insets. Middle and bottom, histograms of the averages of bead-normalized relative DNA fluorescence per cell and bead-normalized forward angle light scatter (FALS) per cell, respectively, at several time points between mid-exponential growth and stationary phase. For all panels, error bars reflect the SD across three biological replicates, while values significantly different (P < 0.05, two-tailed Student’s t test) between adenine-treated and unamended controls are highlighted with a pink asterisk.
Fig. 8.
Fig. 8.. Post-washing response of SAR11 HTCC7211 previously grown with and without adenine.
Growth curves of SAR11 cultures grown with and without adenine, before and after washing and resuspension in adenine-free media. Three identical experiments were performed in both nutrient-balanced and glycine-depleted cultures, which are labeled using roman numerals. Each experiment included cultures grown with adenine at three different concentrations as well as an adenine-free control, with six biological replicates for each condition. Empty entries at given concentrations in different rows represent adenine concentrations not included in different experiments. Fractions of replicates experiencing a lag of two or more days after washing at a given adenine concentration and culture condition are shown as inset within each experimental panel, and as fractions of totals across experiments at bottom. Statistically significant differences between adenine amended and adenine-free cultures according to a two-tailed Fisher’s exact test are shown as single pink asterisks for P < 0.05 and double pink asterisks for P < 0.01.
Fig. 9.
Fig. 9.. Hypothesized role of purines in driving synchronization of SAR11 metabolism to the diel light:dark cycle.
Organic carbon produced by phytoplankton during the day (photosynthate, blue) stimulates SAR11 metabolism, while purines (orange) exuded by Prochlorococcus at night after genome replication (Fig. 2) inhibit SAR11 metabolism (Fig. 6). Daily alternation of these positive and negative signals over long timescales drives synchronization of metabolism to the 24-hour period as observed in in situ gene expression data (51).

Similar articles

References

    1. Pomeroy L. R., The ocean’s food web, a changing paradigm. Bioscience 24, 499–504 (1974).
    1. Azam F., Fenchel T., Field J. G., Gray J. S., Meyer-Reil L. A., Thingstad F., The ecological role of water-column microbes in the sea. Mar. Ecol. Prog. Ser. 10, 257–263 (1983).
    1. Moran M. A., Kujawinski E. B., Schroer W. F., Amin S. A., Bates N. R., Bertrand E. M., Braakman R., Brown C. T., Covert M. W., Doney S. C., Dyhrman S. T., Edison A. S., Eren A. M., Levine N. M., Li L., Ross A. C., Saito M. A., Santoro A. E., Segrè D., Shade A., Sullivan M. B., Vardi A., Microbial metabolites in the marine carbon cycle. Nat. Microbiol. 7, 508–523 (2022). - PubMed
    1. Field C. B., Behrenfeld M. J., Randerson J. T., Falkowski P., Primary production of the biosphere: Integrating terrestrial and oceanic components. Science 281, 237–240 (1998). - PubMed
    1. P. G. Falkowski, J. A. Raven, Aquatic Photosynthesis (Princeton Univ. Press, 2013).

LinkOut - more resources