. 2025 Jan 3;11(1):eads5963.
doi: 10.1126/sciadv.ads5963. Epub 2025 Jan 3.

Transcriptional regulation of adipocyte lipolysis by IRF2BP2

Affiliations

Transcriptional regulation of adipocyte lipolysis by IRF2BP2

Yang Chen et al. Sci Adv. .

Abstract

Adipocyte lipolysis controls systemic energy levels and metabolic homeostasis. Lipolysis is regulated by posttranslational modifications of key lipolytic enzymes. However, less is known about the transcriptional mechanisms that regulate lipolysis. Here, we identify interferon regulatory factor-2 binding protein 2 (IRF2BP2) as a transcriptional repressor of adipocyte lipolysis. Deletion of IRF2BP2 in human adipocytes increases lipolysis without affecting glucose uptake, whereas IRF2BP2 overexpression decreases lipolysis. RNA sequencing, and chromatin immunoprecipitation sequencing analyses show that IRF2BP2 represses lipolysis-related genes, including LIPE, which encodes hormone sensitive lipase, the rate-limiting enzyme in lipolysis. Adipocyte-selective deletion of Irf2bp2 in mice increases Lipe expression and free fatty acid levels, resulting in adipose tissue inflammation and glucose intolerance. Together, these findings demonstrate that IRF2BP2 restrains adipocyte lipolysis and opens avenues to target lipolysis for the treatment of metabolic disease.


Figures

Fig. 1.
Fig. 1.. IRF2BP2 regulates adipocyte lipolysis.
(A) Relative IRF2BP2 mRNA levels during human adipocyte differentiation (n = 3 in each time point). (B to E) hAPCs were transduced with IRF2BP2-targeting (KO) CRISPR lentivirus or nontargeting control lentivirus (Ctrl), and differentiated into adipocytes for 14 days. (B) Relative mRNA levels of IRF2BP2 and adipocyte marker genes (ADIPOQ, FABP4, and PPARG). (C) Western blot analysis of IRF2BP2 and glyceraldehyde phosphate dehydrogenase (GAPDH) (loading control) protein levels. (D) Glucose uptake in Ctrl and KO adipocytes treated with either phosphate-buffered saline (PBS) or 10−8 M insulin. (E) NEFA levels in culture medium from Ctrl and KO adipocytes under basal conditions or following stimulation with 10−6 M isoproterenol (ISO). (F to I) hAPCs were transduced with IRF2BP2-expressing (OE) or GFP-expressing lentivirus (Ctrl) and differentiated into adipocytes for 14 days. (F) Relative mRNA levels of IRF2BP2, ADIPOQ, FABP4, and PPARG. (G) Western blot analysis of IRF2BP2 and GAPDH (loading control) protein levels. (H) Glucose uptake in Ctrl and OE adipocytes treated with either PBS or 10−8 M insulin. (I) NEFA levels in culture medium from Ctrl and OE adipocytes under basal conditions or following stimulation with 10−6 M ISO. Unpaired two-tailed Student’s t tests were used in (B), (E), (F), and (I). One-way analysis of variance (ANOVA) followed by Dunnett multiple comparisons test was applied in (A). *P < 0.05.
Fig. 2.
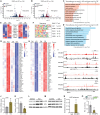
Fig. 2.. Identification of IRF2BP2 target genes including LIPE.
(A and B) Volcano plots showing results from RNA-seq analyses of control (Ctrl) versus IRF2BP2-KO (A) and Ctrl versus IRF2BP2-overexpressing (OE) adipocytes (B). X axis: Fold changes in mRNA levels (log2 transformed) over Ctrl group. Y axis: −Log10 (P value) for significance. (C and D) Gene enrichment pathway analysis using Biological Processes (BP) database. (C) The top 10 pathways that are (i) up-regulated in KO and (ii) down-regulated in OE adipocytes. (D) The top 10 pathways that are (i) down-regulated in KO and (ii) up-regulated in OE adipocytes. (E) Heatmap showing the expression profile of lipolysis genes in KO and OE adipocytes, relative to control cells. (F) Motif analysis of IRF2BP2 binding regions in hAPCs subjected to differentiation cocktail for 1 day. (G and H) Expression heatmap of the top 50 IRF2BP2-repressed (G) and IRF2BP2-activated genes (H) that have nearby IRF2BP2 binding peaks. (I) ChIP-seq tracks for IRF2BP2 and H3K27Ac at LIPE, MGLL, HSD11B1, and NPR3. (J and K) Relative LIPE mRNA levels in (J) Ctrl and KO adipocytes and (K) Ctrl and OE adipocytes. (L and M) Western blot analysis of HSL, phospho-HSL, and GAPDH (loading control) levels in (L) Ctrl and KO adipocytes and (M) Ctrl and OE adipocytes. (N) ChIP-qPCR analysis for IRF2BP2 or IgG (control) at the −5.9-kb region of LIPE in mature hAPC-derived adipocytes. (O) Transcription assay showing activity of −5.9-kb region of LIPE in immortalized hAPCs transfected with control vector (Ctrl) or IRF2BP2-expressing vector. For (J), (K), (N), and (O), unpaired two-tailed Student’s t tests were used. *P < 0.05.
Fig. 3.
Fig. 3.. Adipocyte-specific deletion of Irf2bp2 increases lipolysis and inflammation in adipose tissue.
Control and AKO mice were assessed as follows. (A) Relative Irf2bp2 mRNA levels in iWAT and eWAT. (B) Western blot analysis of IRF2BP2 and GAPDH (loading control) protein levels in iWAT and eWAT. Protein quantification was performed with imageJ. *P < 0.05 versus iWAT Ctrl; #P < 0.05 versus eWAT Ctrl. (C) Body weights (n = 9). (D and E) Weights of: (D) BAT and (E) iWAT and eWAT (n = 9). (F) H&E staining of iWAT (scale bar, 50 um). (G) Quantification of adipocyte size in iWAT (n = 7). (H) Circulating NEFA and glycerol levels under ad libitum fed conditions (n = 8). (I) Relative Lipe mRNA levels in iWAT and eWAT (n = 7). (J) Relative mRNA levels of Pnpla2 and Mgll in iWAT and eWAT (n = 7). (K) Relative mRNA levels of adipocyte genes Adipoq, Fasn, Scd, and Acly in iWAT (n = 7). (L) Relative mRNA levels of inflammatory genes Adgre1 (F4/80), Il1b, Il6, and Ccl2 (Mcp1) in iWAT (n = 7). (M and N) Flow cytometry analysis of F4/80+; CD11c+ (CD45+) cells in stromal vascular cells from iWAT (M) and eWAT (N) (n = 3). In (A), (B), (E), (H), (I), (J), (L), and (M), unpaired two-tailed Student’s t tests were applied. Two-way ANOVA followed by Sidak’s test was applied for (G). *P < 0.05.
Fig. 4.
Fig. 4.. Adipocyte Irf2bp2 deficiency causes glucose intolerance.
(A to E) Analysis of metabolic parameters in 12- to 14-week-old control (Ctrl) and AKO mice (n = 8 to 10). (A) Fasting glucose levels. (B) Intraperitoneal GTT. (C) GTT AUC values from (B). (D) Intraperitoneal ITT. (E) ITT AUC values from (D). (F) Correlation between Irf2bp2 mRNA levels in subcutaneous adipose tissue and serum FFA levels in 42 mouse strains (data extracted from GeneNetwork database, EPFL LISP3 Cohort) (38). (G) Correlation between IRF2BP2 and LIPE mRNA levels in subcutaneous adipose tissue from healthy, nondiabetic female individuals (n = 39). (H) IRF2BP2 mRNA levels in subcutaneous adipose tissue from diabetic (n = 31) and nondiabetic individuals (n = 39). (I) Working model: (Left) IRF2BP2 transcriptionally represses LIPE expression in adipocytes to decrease the rate of lipolysis. (Right) Loss of IRF2BP2 (or its down-regulation in diabetes) increases lipolysis, leading to inflammation and impaired metabolic homeostasis. In (A), (C), (E), and (H), unpaired two-sided t tests were used. Two-way ANOVA followed by Sidak’s test was used in (B) and (D). Person correlational analysis was performed in (F) and (G). *P < 0.05.

Update of

References

    1. Sakers A., De Siqueira M. K., Seale P., Villanueva C. J., Adipose-tissue plasticity in health and disease. Cell 185, 419–446 (2022). - PMC - PubMed
    1. Kashyap S., Belfort R., Gastaldelli A., Pratipanawatr T., Berria R., Pratipanawatr W., Bajaj M., Mandarino L., DeFronzo R., Cusi K., A sustained increase in plasma free fatty acids impairs insulin secretion in nondiabetic subjects genetically predisposed to develop type 2 diabetes. Diabetes 52, 2461–2474 (2003). - PubMed
    1. Taschler U., Radner F. P. W., Heier C., Schreiber R., Schweiger M., Schoiswohl G., Preiss-Landl K., Jaeger D., Reiter B., Koefeler H. C., Wojciechowski J., Theussl C., Penninger J. M., Lass A., Haemmerle G., Zechner R., Zimmermann R., Monoglyceride lipase deficiency in mice impairs lipolysis and attenuates diet-induced insulin resistance. J. Biol. Chem. 286, 17467–17477 (2011). - PMC - PubMed
    1. Morigny P., Houssier M., Mouisel E., Langin D., Adipocyte lipolysis and insulin resistance. Biochimie 125, 259–266 (2016). - PubMed
    1. Takahara S., Ferdaoussi M., Srnic N., Maayah Z. H., Soni S., Migglautsch A. K., Breinbauer R., Kershaw E. E., Dyck J. R. B., Inhibition of ATGL in adipose tissue ameliorates isoproterenol-induced cardiac remodeling by reducing adipose tissue inflammation. Am. J. Physiol. Heart Circ. Physiol. 320, H432–H446 (2021). - PMC - PubMed