Multicenter Study
. 2025 Jan 3;11(1):eadr8078.
doi: 10.1126/sciadv.adr8078. Epub 2025 Jan 3.

Large-scale multicenter study reveals anticitrullinated SR-A peptide antibody as a biomarker and exacerbator for rheumatoid arthritis

Affiliations
Multicenter Study

Large-scale multicenter study reveals anticitrullinated SR-A peptide antibody as a biomarker and exacerbator for rheumatoid arthritis

Yang Xie et al. Sci Adv. .

Abstract

Current diagnosis and treatment of rheumatoid arthritis (RA) is still challenging. More than one-third of patients with RA could not be accurately diagnosed because of lacking biomarkers. Our recent study reported that scavenger receptor-A (SR-A) is a biomarker for RA, especially for anticyclic citrullinated peptide antibody (anti-CCP)-negative RA. Here, we further identified the B cell autoantigenic epitopes of SR-A. By a large-scale multicenter study including one training and three validation cohorts of 1954 participants, we showed that anticitrullinated SR-A peptide antibody (anti-CSP) was exclusively elevated in RA as a biomarker, particularly useful for seronegative RA. Combination of anti-CSP with anti-CCP demonstrated superior diagnostic value for RA, with sensitivity of 84.83% and specificity of 92.43%. Moreover, RA anti-CSP revealed distinct glycosylation patterns, capable of provoking inflammation in cartilage organoids and exacerbating disease progression in experimental arthritis. Together, these data identify anti-CSP as an RA autoantibody clinically applicable and actively involved in disease pathogenesis.


Figures

Fig. 1.
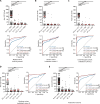
Fig. 1.. The prevalence of anti-CSP in patients with RA.
(A) The serum levels of anti-CSP were significantly higher in patients with RA (n = 64) than those in healthy controls (HCs; n = 60) and patients with other common rheumatic diseases and nonautoimmune inflammatory diseases (NAIDs), including osteoarthritis (OA; n = 30), Sjogren’s syndrome (SS; n = 30), systemic lupus erythematosus (SLE; n = 30), ankylosing spondylitis (AS; n = 23), adult-onset still’s disease (AOSD; n = 25), psoriatic arthritis (PsA; n = 19), gout (n = 22), and ANCA-associated vasculitis (AAV; n = 25). (B) The serum levels of anti-CSP were significantly higher in patients with RA (n = 64) than those in HCs (n = 60) and patients with NAID (n = 24), including enteritis, gastritis, pneumonia, and colitis. (C) Preincubation of RA serum (n = 5) with gradient concentrations of CSP peptides (0 to 10 μg/ml) significantly decreased the detected level of anti-CSP. (D) Comparison of the serum levels of antibody to CSP (left) and non-CSP (middle) in patients with RA (n = 64) and HC (n = 30). Red horizontal lines, means; error bars, SEMs. **P < 0.01 and ***P < 0.001; ns, not significant. Kruskal-Wallis test followed by Dunn’s posttest for multiple comparisons [(A) to (C)], Mann-Whitney U test or Wilcoxon matched-paired signed rank test (D).
Fig. 2.
Fig. 2.. The diagnostic value of anti-CSP for RA: A large-scale multicenter study.
A large-scale, multicenter study was performed to access the diagnostic value of anti-CSP in RA through ELISA. The results in the training cohort, validation cohort 1, validation cohort 2, validation cohort 3, and the pooled four cohorts were shown, respectively. (A) Beijing cohort: training cohort (anti-CCP+ RA = 229; anti-CCP RA = 76; OA = 105; SS = 105; SLE = 111; and HC = 206), (B) Henan cohort: validation cohort 1 (anti-CCP+ RA = 80; anti-CCP RA = 36; OA = 60; SS = 68; SLE = 62; and HC = 100), (C) Inner Mongolia cohort: validation cohort 2 (anti-CCP+ RA = 99; anti-CCP RA = 22; OA = 57; SS = 58; SLE = 61; and HC = 103), (D) Zhejiang cohort: validation cohort 3 (anti-CCP+ RA = 80; anti-CCP RA = 24; OA = 28; SS = 54; SLE = 56; and HC = 74), (E) Pooled four cohorts: pooled all four cohorts’ data together (anti-CCP+ RA = 488; anti-CCP RA = 158; OA = 250; SS = 285; SLE = 290; and HC = 483). (F) The levels and the positive rates of patients with anti-CSP in anti-CCP–negative and/or RF-negative RA were further analyzed in a larger cohort, including patients with RF RA (n = 197), patients with anti-CCP RA (n = 216), and patients with (anti-CCP and RF) RA (n = 124). Red horizontal lines, means; error bars, SEMs. ***P < 0.001; ns, not significant. Kruskal-Wallis test followed by Dunn’s posttest for multiple comparisons.
Fig. 3.
Fig. 3.. ROC curves of anti-CSP, anti-CCP, and their combination for RA diagnosis.
Anti-CCP levels and receiver operating characteristic (ROC) curves of anti-CSP, anti-CCP, and anti-CSP and anti-CCP combination (RA versus all controls) in the training cohort (A), validation cohort 1 (B), validation cohort 2 (C), validation cohort 3 (D), and the pooled four cohorts (E) were shown, respectively. The 95% bootstrap confidence intervals (CIs) for the AUCs were indicated within parentheses. Red horizontal lines, means; error bars, SEMs. *P < 0.05, **P < 0.01, and ***P < 0.001; ns, not significant. Kruskal-Wallis test followed by Dunn’s posttest for multiple comparisons and Delong method for ROC comparisons. Anti-CCP, anticyclic citrullinated peptide antibody; AUC, area under the ROC curve.
Fig. 4.
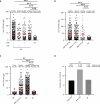
Fig. 4.. Anti-CSP in RA patients with normal ESR and/or CRP, patients with ERA, and patients with UA.
(A) The levels and the positive rates of anti-CSP in patients with RA with increased ESR (+) and increased CRP (+), normal ESR (−) and increased CRP (+), increased ESR (+) and normal CRP (−), and normal ESR (−) and normal CRP (−) were detected. (B) The levels and the positive rates of anti-CSP in patients with early RA (ERA), including patients with disease duration ≤24 months, disease duration ≤12 months, and disease duration ≤6 months. (C) The levels and the positive rates of anti-CSP in patients with undifferentiated arthritis (UA), ERA, and patients with RA were compared. (D) Prevalence of anti-CSP, anti-CCP, and RF in patients with UA. n, the number of anti-CSP–positive patients; N, the number of total patients. Red horizontal lines, means; error bars, SEMs. ***P < 0.001; ns, not significant. Kruskal-Wallis test followed by Dunn’s posttest for multiple comparisons.
Fig. 5.
Fig. 5.. Purification and N-glycosylation pattern analysis of RA anti-CSP.
(A) Detection of the levels of anti-CSP in RA sera (n = 60) and synovial fluids (n = 64). (B) Schematic illustration of the anti-CSP purification process. Anti-CSP from synovial fluids of patients with RA was purified by centrifugation, hyaluronidase treatment, saturated ammonium sulfate precipitation, Protein G purification, CSP affinity column purification, and ultrafiltration. (C) SDS–polyacrylamide gel electrophoresis (SDS-PAGE) and Coomassie blue staining of different fractions during anti-CSP purification. (D) The specificity of anti-CSP was detected by ELISA binding analysis with CSP and CCP peptide, respectively. The results of different concentrations of anti-CSP, ranging from 0.1563 to 10 μg/ml, were shown. Red line: ELISA plate coated with CSP peptide; black line: ELISA plate coated with CCP peptide. Data are presented as mean ± SEM. The reaction of purified anti-CSP with gradient concentrations of BSA-conjugated CSP peptide (0.5 to 2 μg) (E) and citrullinated SR-A protein (0.5 to 2 μg) (F) were detected by Western blot. (G) Quantitative analysis of IgG glycosylation in RA anti-CSP, RA IgG and HC IgG. The results of different glycoforms, including G0 form (A1, A2, FA2, and FA2B), G1 form (A1G1, A2G1, FA2G1, and FA2BG1), and G2 form (FA2G2, FA2BG2, and FA2G2S1) were shown, respectively. The galactosylation levels were also calculated using the formula: G0/(G1 + G2 × 2). Error bars represent the SEM of each dataset. *P < 0.05, **P < 0.01, and ***P < 0.001; ns, not significant. Kruskal-Wallis test followed by Dunn’s posttest for multiple comparisons [(A) and (G)] or one-way ANOVA test followed by Tukey’s posttest for multiple comparisons (G).
Fig. 6.
Fig. 6.. RA anti-CSP exacerbated the inflammation in cartilage organoids.
(A) Scheme of the experimental setup. hMSCs were seeded into collagen-I sponge and cultured with chrondrogenic medium containing 10 nM dexamethasone, TGF-β3 (10 ng/ml), and 10 μM ascorbic acid for 4 weeks. Purified RA anti-CSP or HC IgG (2 μg/ml) was added at day 22, 25, and 28. The cultured cartilage organoids were then stimulated with TNF-α (10 ng/ml) and IL-1β (2 ng/ml) for 3 days, and collected for qPCR, ELISA, and histochemistry analyses. (B) Representative images of macroscopic overview (left), H&E staining (middle), and Alcian blue staining (right) of the cartilage organoids. Scale bars, 100 μm. (C and D) Effects of RA anti-CSP on the production of IL-6 and IL-8 in cartilage organoids. Gene expression was normalized to the housekeeper gene GAPDH. Data are presented as means ± SEM. *P < 0.05, **P < 0.01, and ***P < 0.001; ns, not significant. One-way ANOVA test followed by Tukey’s posttest for multiple comparisons (C and D). hMSCs, human mesenchymal stem cells; collagen-I sponge, type I collagen sponges; TGF-β3, transforming growth factor–β3; TNF-α, tumor necrosis factor–α; IL-1β, interleukin-1β.
Fig. 7.
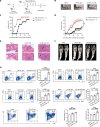
Fig. 7.. RA anti-CSP promoted the development of experimental arthritis.
(A) Scheme of the experimental setup. DBA/1 mice were intravenously injected with purified RA anti-CSP or HC IgG (2 μg per mouse) every 2 days during CIA induction, starting from 2 days before boosting immunization for a total of five times. Mice were monitored every day and euthanized 21 days after the second immunization. (B) Representative images of arthritic paws of naïve, CIA-RA anti-CSP, and CIA-HC IgG mice. (C and D) The arthritis incidence and the arthritis scores were shown for both CIA-RA anti-CSP and CIA-HC IgG mice over time (CIA-RA anti-CSP, n = 7; CIA-HC IgG, n = 7; *P < 0.05). (E) H&E staining of the sagittal sections of paws from naïve, CIA-RA anti-CSP, and CIA-HC IgG mice. Arrows indicate the stenosis of articular cavity and destruction of cartilage. Scale bars, 100 μm. (F) Micro-CT image showing the bone destruction of paws from naïve, CIA-RA anti-CSP, and CIA-HC IgG mice. (G) The frequencies of GCB cells, CD86+ B cells, CD80+ B cells, neutrophils and monocytes in the spleen, and TFH cells in the lymph nodes were analyzed by flow cytometry. The representative flow charts and the statistical results were shown, respectively (naïve, n = 5; CIA-RA anti-CSP, n = 7; and CIA-HC IgG, n = 7). Data are presented as mean ± SEM. *P < 0.05, **P < 0.01, and ***P < 0.001; ns, not significant. Two-way repeated-measures ANOVA test (D) or one-way ANOVA test followed by Tukey’s posttest for multiple comparisons (G). CIA, collagen-induced arthritis; i.v., intravenously; GCB, germinal center B cells; TFH, follicular helper T cells.

References

    1. Smolen J. S., Aletaha D., McInnes I. B., Rheumatoid arthritis. Lancet 388, 2023–2038 (2016). - PubMed
    1. Ahsan H., Origins and history of autoimmunity—A brief review. Rheumatol. Autoimmun. 3, 9–14 (2023).
    1. Van Hoovels L., Jacobs J., Vander Cruyssen B., Van den Bremt S., Verschueren P., Bossuyt X., Performance characteristics of rheumatoid factor and anti-cyclic citrullinated peptide antibody assays may impact ACR/EULAR classification of rheumatoid arthritis. Ann. Rheum. Dis. 77, 667–677 (2018). - PubMed
    1. Nishimura K., Sugiyama D., Kogata Y., Tsuji G., Nakazawa T., Kawano S., Saigo K., Morinobu A., Koshiba M., Kuntz K. M., Kamae I., Kumagai S., Meta-analysis: Diagnostic accuracy of anti-cyclic citrullinated peptide antibody and rheumatoid factor for rheumatoid arthritis. Ann. Intern. Med. 146, 797–808 (2007). - PubMed
    1. Curran A. M., Naik P., Giles J. T., Darrah E., PAD enzymes in rheumatoid arthritis: Pathogenic effectors and autoimmune targets. Nat. Rev. Rheumatol. 16, 301–315 (2020). - PubMed

Publication types