. 2025 Jan 3;11(1):eadr7427.
doi: 10.1126/sciadv.adr7427. Epub 2025 Jan 3.

A propofol binding site in the voltage sensor domain mediates inhibition of HCN1 channel activity

Affiliations

A propofol binding site in the voltage sensor domain mediates inhibition of HCN1 channel activity

Verena Burtscher et al. Sci Adv. .

Abstract

Hyperpolarization-activated and cyclic nucleotide-gated (HCN) ion channels are members of the cyclic nucleotide-binding family and are crucial for regulating cellular automaticity in many excitable cells. HCN channel activation contributes to pain perception, and propofol, a widely used anesthetic, acts as an analgesic by inhibiting the voltage-dependent activity of HCN channels. However, the molecular determinants of propofol action on HCN channels remain unknown. Here, we use a propofol-analog photoaffinity labeling reagent to identify propofol binding sites in the human HCN1 isoform. Mass spectrometry analyses combined with molecular dynamics simulations show that a binding pocket is formed by extracellularly facing residues in the S3 and S4 transmembrane segments in the resting voltage-sensor conformation. Mutations of residues within the putative binding pocket mitigate or eliminate voltage-dependent modulation of HCN1 currents by propofol. Together, these findings reveal a conformation-specific propofol binding site that underlies voltage-dependent inhibition of HCN currents and provides a framework for identifying highly specific modulators of HCN channel gating.


Figures

Fig. 1.
Fig. 1.. PAL of purified hHCN1 isoform.
(A) Schematic of the workflow for PAL. Reference mass spectra were obtained using middle-down MS of HCN1 solubilized in digitonin and digested with trypsin. PAL was performed by exposing the digitonin-solubilized HCN1 to UV light in the presence of AziPm (top right). Photolabeled peptides were identified in mass spectra on the basis of their predicted m/z ratio, and the labeled residues were identified by the additional mass of the AziPm adduct on features in the fragment ion spectra. (B) Tubular representation of the structure of the HCN1 subunit highlighting (in red) the positions of the six residues that were photolabeled. Note that either C385 or Y386 is photolabeled, but for clarity, we only show the C385 position. The inset shows another view of the photolabeled residues in the CNBD.
Fig. 2.
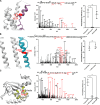
Fig. 2.. Three distinct AziPm-labeled sites in the HCN1 channel.
(A) (Left) Structural representation of the VSD highlighting the photolabeled peptide in mauve and the photolabeled Y234 residue in red. (Middle) Fragment ion spectrum of the S3 peptide labeled with 10 μM AziPm; unlabeled fragment ions are shown in black and labeled ions are shown in red. The unlabeled y7 and labeled y8 fragment ions define Y234 as the adducted residue. (Right) Photolabeling efficiencies of the singly labeled S3 peptide in the presence and absence of propofol (1 mM) or cAMP (30 μM). Propofol but not cAMP prevents photolabeling (n = 3; one-way ANOVA, F = 20.69; Dunnett’s multiple comparison of the means, control versus propofol, *P = 0.002). ns, not significant. (B) (Left) Structural representation of the two pore helices (S5 and S6) highlighting the photolabeled peptide in turquoise and photolabeled residues (either C385 or Y386) in red. (Middle) Fragment ion spectrum of the S6 peptide labeled with 10 μM AziPm. The unlabeled y18 (black) and labeled y20 (red) fragment ions localize the adducted residue to either C385 or Y386. (Right) Photolabeling efficiencies of the S6 peptide in the presence and absence of propofol (1 mM). Propofol does not prevent AziPm labeling (n = 3; t test; P = 0.42). (C) (Left) Structural representation of the CNBD highlighting the photolabeled peptides in citrine and photolabeled residue M487 in red. (Middle) Fragment ion spectrum of the A-helix peptide of the CNBD labeled with 30 μM AziPm. The unlabeled y3 (black) fragment ion and labeled y4 (red) fragment ion define the adducted residue as M487. (Right) Photolabeling efficiencies of the photolabeled A-helix peptide in the presence and absence of propofol (1 mM) or cAMP (30 μM). Both propofol and cAMP prevent AziPm labeling (n = 3 for each sample; one-way ANOVA, F = 60.69; Dunnett’s multiple comparison of the means, *P < 0.001).
Fig. 3.
Fig. 3.. MD simulation identifies a binding pocket delimited by transmembrane helices S3 and S4.
(A) Three-dimensional heatmap representing averaged propofol occupancy on VSD and HCN domain structure of HCN1 in the closed conformation. The occupancies from MD trajectories were calculated using PyLipID. Gray density depicts the time-averaged propofol density at a threshold of 0.06 plotted relative to the VSD structure. (B) Close-up views of the heatmap shown in (A) highlighting the region with the highest occupancies. The side chains of residues predicted to interact with propofol (orange) in the binding pocket are shown as sticks.
Fig. 4.
Fig. 4.. Functional evaluation of key residues in the putative propofol binding pocket.
(A) Close-up ribbon representation of the structure of HCN1 VSD. The residues marked in red were tested for their role in mediating propofol modulation of HCN channel gating. The photoaffinity-tagged residue Y234 is shown in blue. (B) Conductance-voltage curves of the WT and mutant mHCN1 channels obtained in the presence of various concentrations of propofol. Control conductance-voltage curves were obtained without propofol (unfilled symbols). The mutants are numbered according to their equivalent position in hHCN1, and the corresponding residue positions in mHCN1 are in parentheses below. The data shown represent means ± SEM. (C) Box plot of propofol-induced shifts of V0.5 of channel activation for WT and mutant channels. The shifts in V0.5 are plotted relative to the control recordings for two concentrations of propofol: 10 μM (light red) and 100 μM (deep red). For each concentration, the change in mean half-maximal activation was compared to WT using a nonparametric Kruskal-Wallis post hoc test with a significance level of P < 0.05. ****P < 0.0001; ***P < 0.001; **P < 0.01; *P < 0.05.

References

    1. Biel M., Wahl-Schott C., Michalakis S., Zong X., Hyperpolarization-activated cation channels: From genes to function. Phys. Rev. 89, 847–885 (2009). - PubMed
    1. Combe C. L., Gasparini S., Ih from synapses to networks: HCN channel functions and modulation in neurons. Prog. Biophys. Mol. Biol. 166, 119–132 (2021). - PMC - PubMed
    1. Craven K., Zagotta W. N., CNG and HCN channels: Two peas, one pod. Annu. Rev. Physiol. 68, 374–401 (2006). - PubMed
    1. Santoro B., Liu D. T., Yao H., Bartsch D., Kandel E. R., Siegelbaum S. A., Tibbs G. R., Identification of a gene encoding a hyperpolarization-activated pacemaker channel of brain. Cell 93, 717–729 (1998). - PubMed
    1. Brown H. F., Difrancesco D., Noble S. J., How does adrenaline accelerate the heart? Nature 280, 235–236 (1979). - PubMed

MeSH terms

Substances

LinkOut - more resources