. 2025 Jan 7;122(1):e2321319121.
doi: 10.1073/pnas.2321319121. Epub 2025 Jan 3.

Image segmentation with traveling waves in an exactly solvable recurrent neural network

Affiliations

Image segmentation with traveling waves in an exactly solvable recurrent neural network

Luisa H B Liboni et al. Proc Natl Acad Sci U S A. .

Abstract

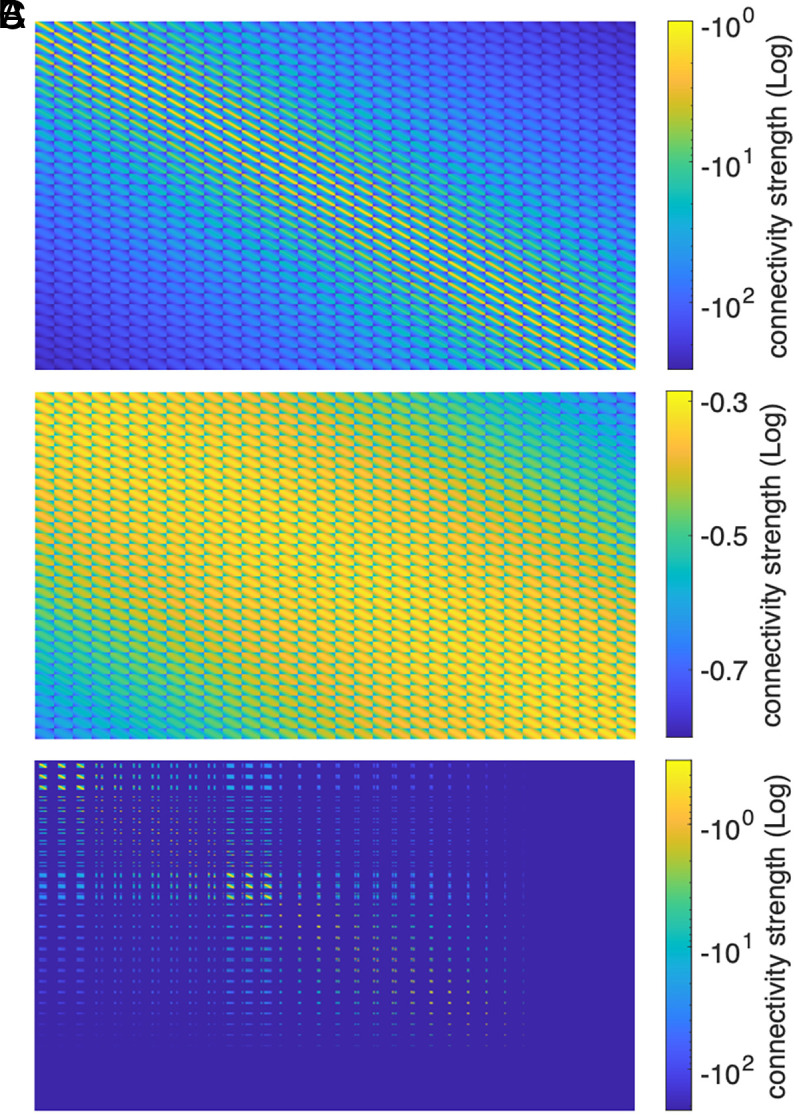
We study image segmentation using spatiotemporal dynamics in a recurrent neural network where the state of each unit is given by a complex number. We show that this network generates sophisticated spatiotemporal dynamics that can effectively divide an image into groups according to a scene's structural characteristics. We then demonstrate a simple algorithm for object segmentation that generalizes across inputs ranging from simple geometric objects in grayscale images to natural images. Using an exact solution of the recurrent network's dynamics, we present a precise description of the mechanism underlying object segmentation in the network dynamics, providing a clear mathematical interpretation of how the algorithm performs this task. Object segmentation across all images is accomplished with one recurrent neural network that has a single, fixed set of weights. This demonstrates the expressive potential of recurrent neural networks when constructed using a mathematical approach that brings together their structure, dynamics, and computation.

Keywords: explainable AI; image segmentation; recurrent neural networks; spatiotemporal dynamics; visual system.


Conflict of interest statement

Competing interests statement:The authors declare no competing interest.

Figures

Fig. 1.
Fig. 1.
Schematic representation of the cv-RNN. (A) Input image. Each pixel projects to one node in the cv-RNN. (B) Nodes in the cv-RNN are arranged into a 2D sheet, where recurrent connection weights (purple) decrease as a Gaussian with distance between nodes Eq. 4. (C) The activity of each node is described by a phase Arg(z) and an amplitude |z| in the complex plane. Inputs from image pixels modulate the natural frequency ω of the corresponding node. (D) Image inputs interact with the recurrent dynamics of the cv-RNN, to produce spatiotemporal patterns of activity in the network that can be used to segment images.
Fig. 2.
Fig. 2.
Spatiotemporal dynamics produced by the cv-RNN. (A) An image drawn from the 2Shapes dataset (see Materials and Methods, Image Inputs and Datasets) is input to the oscillator network by modulating the nodes’ intrinsic frequencies ω. The samples of the phase dynamics in the recurrent layer during transient time show that the nodes are imprinting the visual space by generating three different spatiotemporal patterns: one for the nodes corresponding to the background in the input space, one for the nodes corresponding to the square in the input image, and finally for the nodes corresponding to the triangle in the input space. (B) Image drawn from the MNIST&Shapes dataset is input into the dynamical system. Three different spatiotemporal patterns arise: one for the nodes corresponding to the background in visual input space, one for the nodes corresponding to the triangle in the input space, and finally for the nodes corresponding to the handwritten three-digit.
Fig. 3.
Fig. 3.
Object segmentation algorithm. (A) A first cv-RNN layer with broad spatial connectivity segments the image background. In this plot, samples of the phase dynamics (reshaped to a N×N grid) at each point in time show a unique phase for the nodes corresponding to the background in the visual input space. Pixels corresponding to foreground objects synchronize on a single phase distinct from the background. (B) After timestep k=60, nodes corresponding to background pixels are disconnected from the rest of the recurrent network in the second cv-RNN layer. Then, the second layer dynamics begins, where connections between nodes in the second layer create sophisticated spatiotemporal dynamics unique to each object. (C) The similarity projection in the low dimensional space for the phase dynamics generated in the second layer shows that the spatiotemporal patterns propagate through the nodes corresponding to the objects of the visual input. The phase patterns are separated into two different groups by the K-means algorithm. (D) Labels assigned to objects in the input by the K-means algorithm.
Fig. 4.
Fig. 4.
A single set of recurrent connection weights segments objects from simple images to naturalistic visual scenes. Image inputs are shown in the left column, and some samples of the phase dynamics in the cv-RNN are depicted in the middle column. Panel (A) contains an input with simple geometric shapes, panel (B) shows a naturalistic image input of coins on a dark background and panel (C) also shows a naturalistic image of a bear. Projection onto the eigenvectors of the similarity matrix separates the phase patterns in a three-dimensional space (second column from right, labeled “projection”). Labels assigned to objects in the input by the K-means algorithm are plotted in the right column.
Fig. 5.
Fig. 5.
Segmentation of overlapping objects. (A) When objects in the input image overlap, the object segmentation algorithm separates the nonoverlapping sections into different objects. (3D plot at Right) Points in the projection are colored by the final value in the phase dynamics. Outlines for each point denote the object to which each point belongs in the ground-truth input. The points are arranged into two closed loops that meet where the pixels in the image overlap. (B) Small differences in the pixel intensities for each object separate the similarity projection for each object. (Left) Ground-truth labels for this case of partial overlap, with the triangle in yellow, the square in green, and pixels belonging to the overlap zone in purple. (Top row) Differences in pixel intensities for each foreground object range from 0 to 0.8 (Top Right corner of input images), and nodes in the overlap zone (purple nodes) receive the same input intensity as the triangle (yellow nodes). (Bottom row) Plotted is the similarity projection for each input case, with nodes in the projection colored according to which zone they belong in the input image. When the pixel intensities differ for the two objects, the pixels in the overlap zone are assigned the intensity of the triangle. As the difference in pixel intensity between the triangle and the square increases, the separation between clusters in the similarity projection grows. As in Fig. 4, all image segmentation is performed with the same set of recurrent weights and hyperparameters.
Fig. 6.
Fig. 6.
The eigenvectors of matrix B illustrate how the cv-RNN creates traveling wave patterns unique to each object. (A) An input image interacts with the recurrent dynamics specified by connections in the network by modulating the natural frequencies of each node. Due to the network’s topographic structure, nodes corresponding to nearby pixels in an image are more strongly connected. If these pixels are also part of the same object, the corresponding nodes will have similar natural frequencies, causing their dynamics to evolve in a similar way. (B) The interaction between image inputs and recurrent connections can be understood through eigendecomposition of this linear system. Here, eigenvalues are plotted in descending order of absolute value. The argument of the eigenvectors corresponding to the first five eigenvalues are also plotted. Each eigenvector specifies a wave pattern in the cv-RNN. Note that these patterns are object specific. (C) Dominant eigenvectors dictate the spatiotemporal patterns that appear in the cv-RNN, See Movie S7. (DF) Same as AE for a different input image. Note that the network connectivity is identical, but the differing input leads to different dominant eigenvectors for this input image, and thus different spatiotemporal patterns. See Movie S8. The precise interaction between specific inputs and the network structure can be studied through this framework, providing insight into how the same set of connections can produce very different activity patterns to segment a variety of images.
Fig. 7.
Fig. 7.
Adjacency matrix and cv-RNN connectivity. (A) Connectivity matrix A with parameters α = 0.51, σ = 0.0313, which was used in the case study of Fig. 2. (B) Connectivity matrix A1 with parameters α = 0.5, σ = 0.9, responsible for driving the dynamics for background removal. (C) The masked connectivity matrix A2 on logarithmic scale. The lines and columns of the connectivity matrix corresponding to the connections to the background nodes are assigned a value of zero and do not contribute to the dynamics of the object segmentation task.

References

    1. S Beucher, “Use of watersheds in contour detection” in Proceedings of the International Workshop on Image Processing, Sept. 1979 (1979), pp. 17–21.
    1. Kass M., Witkin A., Terzopoulos D., Snakes: Active contour models. Int. J. Comput. Vis. 1, 321–331 (1988).
    1. G. E. Hinton, S. Sabour, N. Frosst, “Matrix capsules with EM routing” in International Conference on Learning Representations (2018).
    1. Minaee S., et al. , Image segmentation using deep learning: A survey. IEEE Trans. Pattern Anal. Mach. Intell. 44, 3523–3542 (2021). - PubMed
    1. S. Löwe, P. Lippe, M. Rudolph, M. Welling, Complex-valued autoencoders for object discovery. arXiv [Preprint] (2022). https://arxiv.org/abs/2204.02075 (Accessed 21 July 2024).

LinkOut - more resources