. 2025 Jan 3;10(103):eads6295.
doi: 10.1126/sciimmunol.ads6295. Epub 2025 Jan 3.

Functional differences between rodent and human PD-1 linked to evolutionary divergence

Affiliations

Functional differences between rodent and human PD-1 linked to evolutionary divergence

Takeya Masubuchi et al. Sci Immunol. .

Abstract

Mechanistic understanding of the inhibitory immunoreceptor PD-1 is largely based on mouse models, but human and mouse PD-1 share only 59.6% amino acid identity. Here, we found that human PD-1 is more inhibitory than mouse PD-1, owing to stronger interactions with the ligands PD-L1 and PD-L2 and more efficient recruitment of the effector phosphatase Shp2. In a mouse melanoma model with adoptively transferred T cells, humanization of a PD-1 intracellular domain disrupted the antitumor activity of CD8+ T cells and increased the magnitude of anti-PD-1 response. We identified a motif highly conserved across vertebrate PD-1 orthologs, absent in rodents, as a key determinant for differential Shp2 recruitment. Evolutionary analysis suggested that PD-1 underwent a rodent lineage-specific functional attenuation during evolution. Together, our study uncovers species-specific features of the PD-1 pathway, with implications for PD-1 evolution and differential anti-PD-(L)1 responses in mouse models and human patients.


Conflict of interest statement

Competing interests:

E.H. consults for Tentarix Biotherapeutics. The other authors declare that they have no competing interests. J.D.B. consults for Valora and DrKumo and serves as Chief Scientific Officer for Paramita Therapeutics and Pathfinder.

Figures

Fig. 1.
Fig. 1.. HuPD-1:PD-L1 interaction more potently inhibited T cell function than moPD-1:PD-L1 interaction.
(A) Left, cartoon depicting a human-derived coculture assay containing Jurkat expressing TCR, CD28 and mGFP-tagged huPD-1 or moPD-1, and superantigen (SEE)-pulsed Raji APCs expressing MHCII, CD86, and mCherry-tagged huPD-L1 or moPD-L1. Right, FACS histograms showing the expression of indicated PD-1-mGFP or PD-L1-mCherry variant on the Jurkat or Raji cells. (B) Atezolizumab dose-responses of secreted IL-2 in the indicated Jurkat:Raji coculture in the presence of 0.1 ng/mL SEE. Data were normalized to the IL-2 amounts at the highest [atezolizumab]. (C) Superantigen dose-responses of % IL-2 inhibition mediated by either huPD-1:huPD-L1 or moPD-1:moPD-L1 pair in the Jurkat:Raji coculture assay depicted in A. Raji cells were pre-treated with 0 or 120 μg/mL Atezolizumab. (D) Left, cartoon depicting a mouse-derived coculture assay containing DO11.10 cells expressing TCR, CD28 and mGFP-tagged huPD-1 or moPD-1, and OVA323–339-pulsed A20 APCs expressing MHCII, CD86, and mCherry-tagged huPD-L1 or moPD-L1. Right, FACS histograms showing the expression of indicated PD-1-mGFP or PD-L1-mCherry variant on the DO11.10 or A20 cell. (E) OVA323–339 dose-responses of % IL-2 inhibition mediated by either huPD-1:huPD-L1 or moPD-1:moPD-L1 pair in the DO11.10:A20 coculture assay depicted in D. Data are mean ± SD from three independent technical replicates. ***P < 0.001; two-way ANOVA.
Fig. 2.
Fig. 2.. Both ECD and ICD of huPD-1 contribute to its stronger inhibitory function than that of moPD-1.
(A) FACS histograms showing the expressions of indicated mGFP-tagged PD-1 or mCherry-tagged PD-L1 variants on Jurkat or Raji cells used for cocultures. (B) Left, a cartoon depicting the PD-1:PD-L1 pairs tested in five parallel Jurkat:Raji coculture assays. Right, bar graphs showing the % inhibition of IL-2 secretion and of CD69 expression by the PD-1:PD-L1 pairs indicated on the left (n = 6 independent technical replicates). (C) FACS histograms showing the expressions of indicated mGFP-tagged PD-1 or mCherry-tagged PD-L1 variants on DO11.10 or A20 cells used for cocultures. (D) Left, a cartoon depicting the PD-1:PD-L1 pairs tested in five parallel A20:DO11.10 coculture assays. Right, a bar graph showing the % inhibition of IL-2 secretion by the PD-1:PD-L1 pairs indicated on the left (n = 3 independent technical replicates). (E) Left, diagram showing the purification method for human primary CD4+ T cells. Right, FACS histograms of CD3 and CD4 expressions on huPBMC and CD4+ T cells. (F) Top, cartoon depicting a coculture assay containing CD4+ T cells expressing TCR, CD28, and mGFPECD-TMD-PD-1ICD, and SEB-pulsed Raji APCs expressing MHCII, CD86, and GFPNb-TM-TagBFP. Bottom, FACS histograms showing the expression of indicated PD-1 chimera or GFPNb-TM-TagBFP on CD4+ T or Raji cells, respectively. (G) A dot plot showing % inhibition of IL-2 secretion by the PD-1 chimera:GFPNb association in CD4+ T cell:Raji coculture depicted in F (n = 3 independent technical replicates). Data are mean ± SD based on the sample numbers indicated in each panel. *P < 0.05; **P < 0.01; ***P < 0.001; ns, not significant; student’s t-test.
Fig. 3.
Fig. 3.. Human PD-1 ECD associates with its ligands more strongly than mouse PD-1 ECD.
(A) Representative BLI data obtained for the indicated PD-1:ligand pairs with the PD-L1 or PD-L2 immobilized on the sensor chip and increasing concentrations of PD-1-ECD presented in the solution. (B) Kd values of the indicated PD-1:ligand pairs based on the BLI experiments (n = 3 independent technical replicates). (C) Left, representative confocal images of a conjugate between Jurkat expressing the indicated PD-1 variants (green) and Raji expressing the indicated PD-L1 variants (red) with or without anti-PD-L1 (atezolizumab). Right, a dot plot showing the synaptic enrichment score of each PD-1 variant in the presence or absence of atezolizumab (n = 40 cells). (D) A cartoon depicting a cell-SLB assay, in which Jurkat cells expressing mGFP-tagged PD-1 variant interacted with a SLB functionalized with anti-huCD3ε and hu/moPD-L1-His. PD-1 microclusters were visualized via TIRF-M. (E) Top, representative TIRF images showing microclusters of indicated mGFP-tagged PD-1 variant in a Jurkat cell that contacted the SLB functionalized with 3 nM huPD-L1 or moPD-L1 that matched the species of the ECD of the corresponding PD-1 variant. Bottom, dot plots showing the clustering indices of all five PD-1 variants (See methods) (n = 40 cells). (F) Dose-response curves showing PD-1 clustering indices of the indicated PD-1 variant plotted against [PD-L1] (n = 3 independent technical replicates). Scale bars: 5 μm. Data are mean ± SD based on the sample numbers indicated in each panel. **P < 0.01; ***P < 0.001; ns, not significant; student’s t-test.
Fig. 4.
Fig. 4.. HuPD-1 more strongly recruits Shp2 than does moPD-1 due to three non-conserved motifs.
(A) A cartoon showing a cell-SLB assay for TIRF imaging of PD-1:Shp2 association in Jurkat or human CD4+ T cells. (B) Left, representative TIRF images of the indicated mGFP-tagged PD-1 variants (green) and anti-Shp2 (magenta) at the interface of a Jurkat cell and the SLB as depicted in A. Right, dot plots showing the anti-Shp2 F.I. normalized to PD-1 F.I. (n = 40 cells). (C) Same as B, except that human CD4+ T cells expressing the indicated PD-1 variants were imaged (n = 40 cells). (D, E) Same as A, B, except that DO11.10 cells were observed. (F) AA sequence alignment of huPD-1ICD and moPD-1ICD, with ITIM, PRS, PEQ/H, and ITSM highlighted. (G) Cartoon of a liposome reconstitution assay for measuring PD-1ICD:Shp2tSH2 interaction. (H) Left, representative time courses of SC505 (Shp2tSH2) F.I. at increasing concentrations of huPD-1ICD. Right, % SC505 quenching 30 min after ATP addition plotted against the [huPD-1ICD] and [moPD-1ICD] (n = 3 independent technical replicates). (I) Bar graphs summarizing apparent Kd of Shp2tSH2 interaction with indicated PD-1ICD variants determined via assays shown in G and H (n = 3 independent technical replicates). (J) Left, representative TIRF images showing Shp2 recruitment to microclusters of indicated PD-1 variants in a Jurkat-SLB assays. Right, dot plots showing anti-Shp2 F.I. normalized to PD-1 F.I. (n = 40 cells). Scale bars: 5 μm. Data are mean ± SD based on the sample numbers indicated in each panel. **P < 0.01; ***P < 0.001; ns, not significant; student’s t-test.
Fig. 5.
Fig. 5.. ICD humanization of moPD-1 inhibits precursor-to-terminal differentiation of Tox+ CD8+ T cells.
(A) Schematic of an adoptive transfer experiment using Pdcd1−/− P14 CD8+ T cells and B16.gp33 cells. Pdcd1−/− P14 cells were retrovirally transduced with exoPD-1 and Thy1.1, and adoptively transferred to mice bearing B16.gp33 melanoma. (B) Surface staining of indicated moPD-1 variants and Thy1.1 on P14 cells transferred to mice in A. (C) Individual (left) and average (right) tumor growth curves in mice received 1 million Pdcd1−/− P14 cells expressing either moPD-1 or moPD-1huICD (n = 2 mice for no transfer control, 3 mice for other groups). (D) Number of Thy1.1+ intratumoral CD8+ T cells (n = 5 tumors). (E) % TCF-1+, % TIM-3+, % IFNγ+, and % GzmB+ population within TOX+ intratumoral P14 cells containing either moPD-1 or moPD-1huICD, based on flow cytometry (n = 4–5 tumors). (F) Expressions of the indicated genes in Tox+ intratumoral P14 cells containing either moPD-1 or moPD-1huICD, based on scRNAseq. (G) UMAP showing the Tox+ intratumoral P14 cells containing either moPD-1 or moPD-1huICD and their cell clusters. (H) Dot plot of indicated gene expressions in the cell subsets identified in G. (I) % population of the indicated subsets of intratumoral P14 cells containing either moPD-1 or moPD-1huICD (n = 4–6 tumors). (J) B16.gp33 tumor growth curves in mice that received 1.2 million P14 cells containing moPD-1WT (left) or moPD-1huICD (right), in response to treatment of either anti-PD-1 (magenta) or isotype control (gray) (n = 7 mice per group). (K) Model showing how PD-1 humanization affects the precursor-to-terminal differentiation of Tox+ intratumoral CD8+ T cells. Data are mean ± SEM calculated based on the numbers of mice or tumors indicated above (C, D, E, I, and J). For violin-box plots (F), black bars are median, the boxes are 25% to 75% interquartile range, and the whiskers stand for minimum to maximum values excluding outliers. *P < 0.5; **P < 0.01; ***P < 0.001; ns, not significant; FDR, false discovery rate; two-way ANOVA (C and J), student’s t-test (D, E, and I), or Wilcoxon signed-rank test (F). FDR was calculated using the Scanpy toolkit.
Fig. 6.
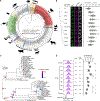
Fig. 6.. Rodent PD-1 orthologs share a distinct pre-ITSM sequence that weakens their ability to recruit Shp2.
(A) Phylogeny of 236 vertebrate species, color-coded on the basis of the pre-ITSM sequence of PD-1. (B) Left, a phylogenetic tree of pre-ITSM sequence found in PD-1 orthologs. Middle, representative TIRF images of microclusters of GFP-tagged huPD-1 variant bearing the indicated pre-ITSM sequence (green) and endogenous Shp2 (magenta) in an anti-huCD3ε/huPD-L1 stimulated Jurkat cell. Right, dot plots showing anti-Shp2 F.I. normalized to PD-1 F.I. in Jurkat cells expressing the indicated huPD-1 variant (n = 40 cells). Scale bars: 5 μm. (C) The subtree of the 107-species mammal phylogeny spanning the rodent clade and the primate clade. The branch lengths were inferred based on PD-1 codon sequence evolution. The marked nodes are mouse, human or the ones with reconstructed ancestral sequences. The color codes show the inhibition ability of the sequences at respective nodes, based on data in D. The bar indicates 0.03 nucleotide substitutions per codon site. (D) Left, FACS histograms showing the expressions of huPD-1 chimera harboring an ICD corresponding to the indicated node, on Jurkat cells. Right, % inhibition of IL-2 secretion by the indicated huPD-1 chimera upon stimulating Jurkat (huPD-1 chimera) with Raji (huPD-L1). The ITIM and pre-ITSM type is labeled: hu, human-like, mo, mouse like (n = 5 independent technical replicates). Data are mean ± SD calculated based on the sample numbers indicated in each panel. *P < 0.05; **P < 0.01; ***P < 0.001; ns, not significant; student’s t-test.

References

    1. Francisco LM, Sage PT, Sharpe AH, The PD-1 pathway in tolerance and autoimmunity. Immunol Rev 236, 219–242 (2010). - PMC - PubMed
    1. Dong H, Strome SE, Salomao DR, Tamura H, Hirano F, Flies DB, Roche PC, Lu J, Zhu G, Tamada K, Lennon VA, Celis E, Chen L, Tumor-associated B7-H1 promotes T-cell apoptosis: a potential mechanism of immune evasion. Nat Med 8, 793–800 (2002). - PubMed
    1. Zou W, Wolchok JD, Chen L, PD-L1 (B7-H1) and PD-1 pathway blockade for cancer therapy: Mechanisms, response biomarkers, and combinations. Sci Transl Med 8, 328rv324 (2016). - PMC - PubMed
    1. Sharpe AH, Wherry EJ, Ahmed R, Freeman GJ, The function of programmed cell death 1 and its ligands in regulating autoimmunity and infection. Nat Immunol 8, 239–245 (2007). - PubMed
    1. Chen L, Co-inhibitory molecules of the B7-CD28 family in the control of T-cell immunity. Nat Rev Immunol 4, 336–347 (2004). - PubMed

Publication types

MeSH terms

Substances