. 2025 Mar;12(2):e200361.
doi: 10.1212/NXI.0000000000200361. Epub 2025 Jan 3.

Aberrant Complement Activation Is Associated With Structural Brain Damage in Multiple Sclerosis

Affiliations

Aberrant Complement Activation Is Associated With Structural Brain Damage in Multiple Sclerosis

Johanna Oechtering et al. Neurol Neuroimmunol Neuroinflamm. 2025 Mar.

Abstract

Background and objectives: Levels of activated complement proteins in the CSF are increased in people with multiple sclerosis (MS) and are associated with clinical disease severity. In this study, we determined whether complement activation profiles track with quantitative MRI metrics and liquid biomarkers indicative of disease activity and progression.

Methods: Complement components and activation products (Factor H and I, C1q, C3, C4, C5, Ba, Bb, C3a, C4a, C5a, and sC5b-9) and liquid biomarkers (neurofilament light chain, glial fibrillary acidic protein [GFAP], CXCL-13, CXCL-9, and IL-12b) were quantified in the CSF of 112 patients with clinically isolated syndromes and 127 patients with MS; longitudinal MRIs according to a standardized protocol of the Swiss MS cohort were assessed. We used multivariable models to analyze associations of the 12 complement parameters as individual independent variables and longitudinal brain volumes, T2-weighted (T2w) lesion volumes, contrast-enhancing (CELs) and paramagnetic rim lesions (PRLs), and molecular biomarkers as dependent variables, respectively.

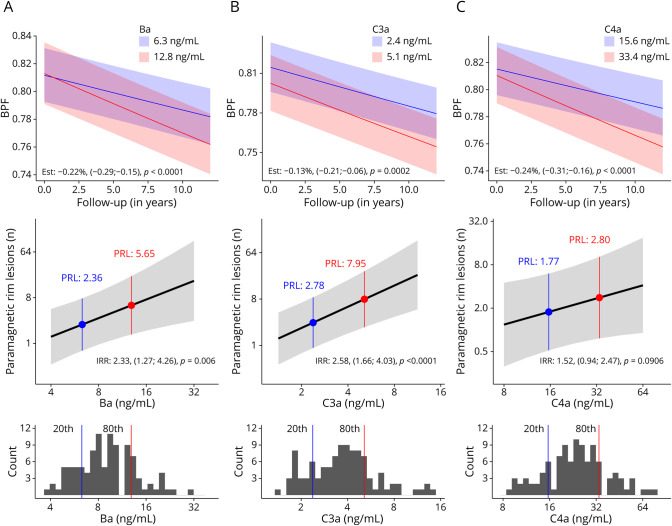
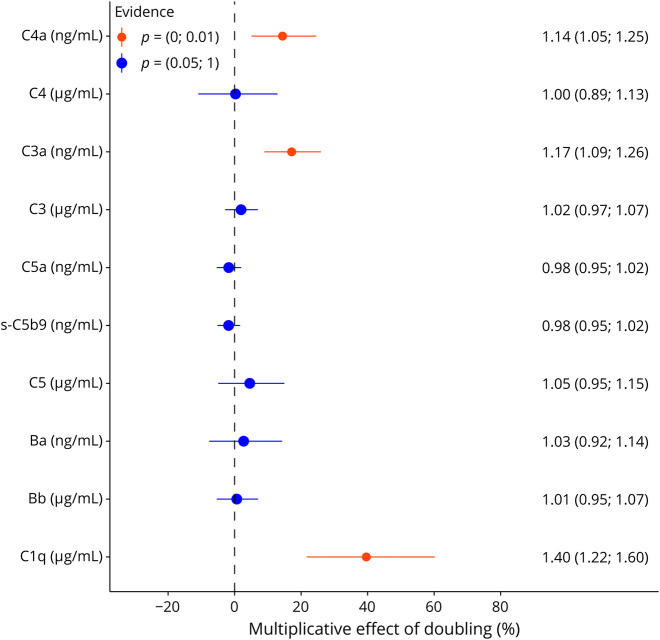
Results: Strongest associations with accelerated brain atrophy were found for C4a: doubling of C4a CSF levels was associated with an additional brain volume loss of -0.24% (95% CI -0.31% to -0.16%; p < 0.0001) per year, followed by Ba and C3a (-0.22% [-0.29% to -0.15%]) and -0.13% ([-0.21 to -0.06]; both p < 0.001). Doubling of C3a, Ba, and C4a levels correlated with 2.2- (1.6-3.0; p < 0.0001), 2.0- (1.3-3.1; p = 0.0038), and 1.8-fold (1.2-2.6; p = 0.0029) increased longitudinal T2w lesion volumes; C3a and Ba were associated with 2.5- (1.4-4.6; p = 0.0022) and 3.3-fold (1.5-7.2; p = 0.0024) higher odds for CELs and 2.6- (1.7-4.0; p < 0.0001) and 2.3-fold (1.3-4.3; p = 0.006) increased PRL incidence rates. C1q, C3a, and C4a were associated with higher GFAP levels, and CXCL-13, CXCL-9, and IL-12b analyses showed consistent patterns with strongest associations for C1q, followed by Ba, C3a, and C4a.

Discussion: Intrathecal complement activation is consistently associated with MRI metrics and liquid biomarkers indicative for MS disease activity and progression. Our results demonstrate that aberrant complement activation is strongly associated with structural brain damage in MS. Therapeutic targeting of the complement system might limit disability accumulation due to MS.


Figures

Figure 1
Figure 1. Multivariable Associations of CSF Ba, C3a, and C4a Levels With Brain Volume Loss and PRL Counts
Higher CSF levels of complement activation products Ba, C3a, and C4a in persons with CIS/MS are associated with an accelerated brain volume loss and higher PRL counts: (A) Top: The additional brain volume loss in a person with a Ba level corresponding to the 80th percentile (12.8 ng/mL; red line) within the CIS/MS cohort is −0.22% (p < 0.0001) as compared with a patient with a CSF Ba level corresponding to the 20th percentile (6.3 ng/mL; blue line). Middle: A patient with a Ba level (6.3 ng/mL) corresponding to the 20th percentile would have an estimated PRL count of 2.4 (blue), while one with an 80th percentile value (12.8 ng/mL) would correspond to 5.6 PRLs (red) (p < 0.0001). Bottom: The distribution of the percentiles within the CIS/MS cohort for the Ba concentration is expressed in this figure: the 20th percentile value is represented by the blue line and the 80th percentile level by the red line. (B) CSF C3a levels corresponding to the 80th percentile (5.1 ng/mL; red line) are associated with −0.13% (p = 0.0002) increased brain volume loss as compared with the 20th percentile (2.4 ng/mL; blue line) and correspond to estimated 7.9 for the 80th vs 2.8 PRLs (p < 0.0001) for the 20th percentile. (C) An 80th percentile C4a level (33.4 ng/mL) is associated with −0.24% (p < 0.0001) increased brain atrophy in comparison with a 20th percentile value (15.6 ng/mL) and with estimated 2.8 vs 1.8 PRLs (p = 0.0906). CIS = clinically isolated syndrome; MS = multiple sclerosis; PRL = paramagnetic rim lesion.
Figure 2
Figure 2. Multivariable Associations of CSF CC or CAP With GFAP Levels
In CIS/MS (n = 235), doubling of CSF C3a levels was associated with by 17%, C4a 14% and C1q 40% increased GFAP CSF levels (compare Table 3). CAP = complement activation product; CC = complement component; CIS = clinically isolated syndrome; GFAP = glial fibrillary acidic protein; MS = multiple sclerosis.
Figure 3
Figure 3. Multivariable Associations of CSF C4a, C3a, Ba, and C1q Levels With Cytokines
Strong multivariable associations of C4a, C3a, Ba, and C1q with higher IL-12b, CXCL-9, and CXCL-13 CSF levels in a homogenous and consistent pattern are displayed. Reading example: doubling of C4a CSF levels was associated with by 38% higher IL-12b levels (red bar), by 50% increased CXCL-9 levels (orange bar), and 63% higher CXCL13 levels (yellow bar) (compare Table 3).

References

    1. Attfield KE, Jensen LT, Kaufmann M, Friese MA, Fugger L. The immunology of multiple sclerosis. Nat Rev Immunol. 2022;22(12):734-750. doi:10.1038/s41577-022-00718-z - DOI - PubMed
    1. Breij EC, Brink BP, Veerhuis R, et al. . Homogeneity of active demyelinating lesions in established multiple sclerosis. Ann Neurol. 2008;63(1):16-25. doi:10.1002/ana.21311 - DOI - PubMed
    1. Ingram G, Loveless S, Howell OW, et al. . Complement activation in multiple sclerosis plaques: an immunohistochemical analysis. Acta Neuropathol Commun. 2014;2:53. doi:10.1186/2051-5960-2-53 - DOI - PMC - PubMed
    1. Morgan BP, Gommerman JL, Ramaglia V. An “Outside-In” and “Inside-Out” consideration of complement in the multiple sclerosis brain: lessons from development and neurodegenerative diseases. Front Cel Neurosci. 2020;14:600656. doi:10.3389/fncel.2020.600656 - DOI - PMC - PubMed
    1. Watkins LM, Neal JW, Loveless S, et al. . Complement is activated in progressive multiple sclerosis cortical grey matter lesions. J Neuroinflammation. 2016;13(1):161. doi:10.1186/s12974-016-0611-x - DOI - PMC - PubMed