. 2025 Jan 2;112(1):168-180.
doi: 10.1016/j.ajhg.2024.12.001.

EEFSEC deficiency: A selenopathy with early-onset neurodegeneration

Affiliations

EEFSEC deficiency: A selenopathy with early-onset neurodegeneration

Lucia Laugwitz et al. Am J Hum Genet. .

Abstract

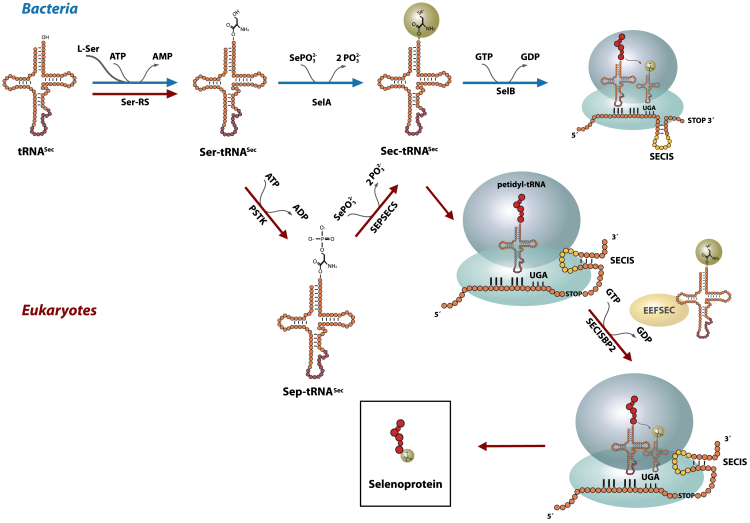
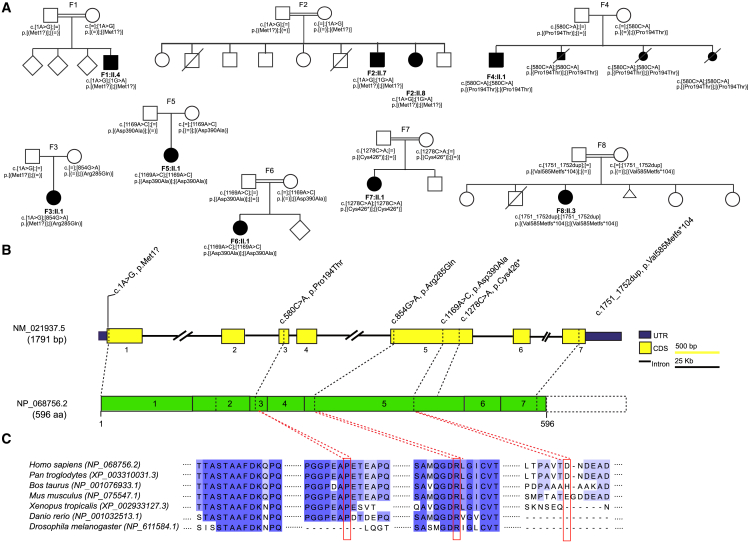
Inborn errors of selenoprotein expression arise from deleterious variants in genes encoding selenoproteins or selenoprotein biosynthetic factors, some of which are associated with neurodegenerative disorders. This study shows that bi-allelic selenocysteine tRNA-specific eukaryotic elongation factor (EEFSEC) variants cause selenoprotein deficiency, leading to progressive neurodegeneration. EEFSEC deficiency, an autosomal recessive disorder, manifests with global developmental delay, progressive spasticity, ataxia, and seizures. Cerebral MRI primarily demonstrated a cerebellar pathology, including hypoplasia and progressive atrophy. Exome or genome sequencing identified six different bi-allelic EEFSEC variants in nine individuals from eight unrelated families. These variants showed reduced EEFSEC function in vitro, leading to lower levels of selenoproteins in fibroblasts. In line with the clinical phenotype, an eEFSec-RNAi Drosophila model displays progressive impairment of motor function, which is reflected in the synaptic defects in this model organisms. This study identifies EEFSEC deficiency as an inborn error of selenocysteine metabolism. It reveals the pathophysiological mechanisms of neurodegeneration linked to selenoprotein metabolism, suggesting potential targeted therapies.

Keywords: EEFSEC deficiency; cerebellar atrophy; cerebellar hypoplasia; epilepsy; progressive spasticity; selenopathy; selenoproteins.


Conflict of interest statement

Declaration of interests B.B. is a co-founder, shareholder, and CTO of AIRAmed GmbH.

Figures

Figure 1
Figure 1
Selenoprotein synthesis in eubacteria and eukaryotes modified according to Simonovic and Puppala In all domains of life, tRNASec is serylated by SerRS. In eubacteria (blue), the Ser is converted to Sec by the enzyme SelA. The Sec-tRNASec is delivered by SelBGTP (bacterial analog to EEFSEC) to the bacterial ribosome reading an in-frame UGA. Elongation is favored over termination at the UGA by proteins binding to the selenocysteine insertion sequence (SECIS), a stem-loop structure in selenoprotein mRNAs.,,,,, The SECIS element, which is formed by the coding region, prevents binding of a release factor. In eukaryotes (red), the Ser-tRNASec is phosphorylated to phosphoserine (Sep) by PSTK. Afterward, SEPSECS converts Sep-tRNASec into Sec-tRNASec using selenophosphate. EEFSECGTP brings Sec-tRNASec into the A-site of a ribosome to read the UGA codon. The SECIS element is located in the 3′ UTR of the mRNA and interacts with EEFSEC and SECISBP2 in a complex on the ribosome. Peptidyl transfer of the peptide forms the P-site tRNA on Sec-tRNASec in the A-site, incorporating Sec into the nascent selenoprotein.
Figure 2
Figure 2
Pedigrees of investigated families and structure of EEFSEC (A) Pedigrees of eight families with pathogenic variants in EEFSEC, illustrating the variant carrier status of affected (closed symbol) and healthy (open symbol) family members. Unaffected siblings were not tested unless indicated. F1:II.4, F2:II.7, and F2:II.8 harbor a homozygous start-loss variant (c.1A>G [p.Met1?]), and F3:II.1 was found to be compound heterozygous for the same start-loss variant (c.1A>G [p.Met1?]) and another missense variant in exon 5 (c.854G>A [p.Arg285Gln]). In family F4 (F4:II.1 and 3 affected fetuses), F5:II.1 and F6:II.1 missense variants were detected in homozygous states, respectively, in exon 3 (F4:II.1: c.580C>A [p.Pro194Thr]) and exon 5 (F5:II.1 and F6:II.1: c.1169A>C [p.Asp390Ala]). F7:II.1 harbors a homozygous nonsense variant (c.1278C>A [p.Cys426]) leading to either nonsense-mediated mRNA decay or a loss of 170 amino acids. In family F8 (F7:II.3), a homozygous frameshift variant was identified (c.1751_1752dup [p.Val585Metfs104]), expected to lead to a protein extension of 120 amino acids. All variants were either absent or listed exclusively in a heterozygous state in gnomAD 4.0 at the time of reporting. (B) Structure of EEFSEC and the encoded protein with known domains and position of identified variants. CDS, coding sequence; UTR, untranslated region. (C) Conservation of variants in EEFSEC across vertebrate and invertebrate animals.
Figure 3
Figure 3
Neuroimaging features of EEFSEC deficiency Representative MR images of the brain show distinct pathological features in individuals with EEFSEC deficiency, distinguishing between severe and moderate phenotypes. The severe phenotype includes cerebellar hypoplasia (F4:II.1, top row) and marked cerebellar atrophy (F8:II.3, second row, and F4:II.1, top row). At 1 month of age, the cerebellar hemispheres and vermis are small, and the cervical spinal cord is slender (far left T2w axial and left FLAIR sagittal); at 6 years of age, the coronal T1w image (top right row) shows cerebellar hypoplasia with disturbed cerebellar proportion (dragonfly appearance) and malformed, short cerebellar folia with poorly identifiable branching, and the cerebrum appears dysplastic and atrophic; the sagittal T2w image (far right) shows the small vermis unchanged. Myelination is severely delayed. F8:II.3 (second row, far left T2w coronal and left sagittal) at 27 months shows more severe cerebellar atrophy affecting the vermis but also the hemispheres: cerebellar volume is reduced but its proportions remain normal. The rarefaction of the folia leads to enlarged sulci, with a skeletal appearance of the vermis. F2:II.7 (third row, far left sagittal T2w image) at 13 years shows cerebellar atrophy illustrated in the vermis and a thin cervical spinal cord; F2:II.8 (left sagittal T2w image and right and far right sagittal and coronal T1w images, respectively) at 15 years shows similar vermis atrophy, and at 21 years, the atrophy has reached a more skeletal appearance (so the atrophy appears to be progressive), while the hemispheres show less pronounced atrophy. F5:II.1 (bottom row, far left sagittal T2w image) at 3.5 years shows mild vermis atrophy, while the cerebrum appears normal, whereas in F3:II.1 (right and far right coronal and axial T2w images, respectively), at 7 years, the cerebellum appears normal, and only the posterior ventricles are slightly enlarged, indicating some cerebral atrophy. mths, months; yrs, years.
Figure 4
Figure 4
In vitro studies on the fuction of EEFSEC (A–C) In vitro analysis of the EEFSEC variants in comparison to wild-type EEFSEC. (A) The relative luciferase (luc) activity of a UGA/Sec-containing luc translated in a cell-free system and dependent on addition of recombinant EEFSEC variants was significantly reduced compared to the wild type for all identified EEFSEC variants (c.580C>A [p.Pro194Thr]; c.854G>A [p.Arg285Gln]; c.1169G>A [p.Asp390Ala]; c.1278C>A [p.Cys426]; and c.1751_1752dup [p.Val585Metfs104]) except for one likely benign variant, c.104C>T (p.Ala35Val) (supplemental information). (B and C) Relative luc activity of an EEFSEC-luc in HEK293 cells (B) or SH-SY5Y cells (C) carrying either wild-type or mutated initiation codons. One-way ANOVA, followed by Dunnett's multiple comparisons test. n = 3 experiments; n.s., not significant; p < 0.05, ∗∗p < 0.01, ∗∗∗p < 0.001. Reduced EEFSEC-luc translation is observed for both start-loss variants, but the c.1A>G (p.Met1?) variant identified in families F1, F2, and F3 shows cryptic initiation of translation. The data of (A)–(C) are represented as mean ± SEM. Representative 75Se incorporation of selenoprotein (SP) expression in EFFSEC-deficient fibroblast cell lines. (D) Human fibroblasts were metabolically labeled with 75SeO32-. Major 75Se-labeled bands are indicated and identified as TXNRD1, GPX1, GPX4, and small SPs. Patient-derived fibroblasts showed a significant reduction of incorporation of 75Se compared to control cell lines in total protein and TXNRD1. n = 3 experiments. (E) Western blots against representative SPs in human fibroblasts. n = 3 experiments. Graphs show the percentage of protein expression relative to healthy control cells (set at 100%). The signals are normalized to b-ACTIN expression.
Figure 5
Figure 5
Functional analyses of eEFSec in Drosophila (A–C) Quantification of climbing performance of flies expressing eEFSec-RNAi in motor neurons. Climbing score analysis at 5 s. (A and B) Climbing score means of 5 (A) and 15 days of age (B). (C) Graph shows the mean differences between day 5 and 15 for each genotype. (two-way ANOVA, Bonferroni’s multiple comparisons test). Note that flies expressing eEFSec-RNAi 42805 display a progressive reduction of climbing performance. Repeated-measure (RM) one-way ANOVA, with the Geisser-Greenhouse correction, followed by Dunnett's multiple comparisons test. n.s., not significant; p < 0.05, ∗∗p < 0.01, ∗∗∗p < 0.001, and ∗∗∗∗p < 0.0001. (D) The level of cleaved caspase-3 was evaluated by immunofluorescence using an anti-cleaved caspase-3 antibody in Drosophila larval brains expressing eEFSec RNAi (42805) or its control (35785), as well as an NLS-GFP (OK6-Gal4>NLS-GFP) to visualize motor neurons. Graph shows the normalized fluorescence values between genotypes (N = 14 brains analyzed in control animals and 12 brains for eEFSec RNAi-expressing animals). Mann-Whitney test, p < 0.05. Scale bar: 10 μm. (E) Changes in synaptic boutons of motor neurons were assessed by counting the number of DLG-positive postsynaptic terminals in Drosophila larvae body wall muscle preparations expressing eEFSec RNAi (42805) in motor neurons or its control (35785). In addition, samples were stained with anti-HRP antibody to visualize the motor neuron membrane. Graph show the number of boutons (divided by the distance the analyzed motor neuron membrane) between genotypes (N = 14–18 from 8 animals per genotype). Mann-Whitney test, ∗∗p < 0.01. Scale bar: 7 μm.

References

    1. Fradejas-Villar N. Consequences of mutations and inborn errors of selenoprotein biosynthesis and functions. Free Radic. Biol. Med. 2018;127:206–214. doi: 10.1016/j.freeradbiomed.2018.04.572. - DOI - PubMed
    1. Schweizer U., Fabiano M. Selenoproteins in brain development and function. Free Radic. Biol. Med. 2022;190:105–115. doi: 10.1016/j.freeradbiomed.2022.07.022. - DOI - PubMed
    1. Berry M.J., Banu L., Chen Y.Y., Mandel S.J., Kieffer J.D., Harney J.W., Larsen P.R. Recognition of UGA as a selenocysteine codon in type I deiodinase requires sequences in the 3' untranslated region. Nature. 1991;353:273–276. doi: 10.1038/353273a0. - DOI - PubMed
    1. Bianco A.C., Dumitrescu A., Gereben B., Ribeiro M.O., Fonseca T.L., Fernandes G.W., Bocco B.M.L.C. Paradigms of Dynamic Control of Thyroid Hormone Signaling. Endocr. Rev. 2019;40:1000–1047. doi: 10.1210/er.2018-00275. - DOI - PMC - PubMed
    1. Hilal T., Killam B.Y., Grozdanović M., Dobosz-Bartoszek M., Loerke J., Bürger J., Mielke T., Copeland P.R., Simonović M., Spahn C.M.T. Structure of the mammalian ribosome as it decodes the selenocysteine UGA codon. Science. 2022;376:1338–1343. doi: 10.1126/science.abg3875. - DOI - PMC - PubMed