. 2025 Feb 10;43(2):195-212.e11.
doi: 10.1016/j.ccell.2024.12.002. Epub 2025 Jan 2.

Classification of non-TCGA cancer samples to TCGA molecular subtypes using compact feature sets

Affiliations

Classification of non-TCGA cancer samples to TCGA molecular subtypes using compact feature sets

Kyle Ellrott et al. Cancer Cell. .

Abstract

Molecular subtypes, such as defined by The Cancer Genome Atlas (TCGA), delineate a cancer's underlying biology, bringing hope to inform a patient's prognosis and treatment plan. However, most approaches used in the discovery of subtypes are not suitable for assigning subtype labels to new cancer specimens from other studies or clinical trials. Here, we address this barrier by applying five different machine learning approaches to multi-omic data from 8,791 TCGA tumor samples comprising 106 subtypes from 26 different cancer cohorts to build models based upon small numbers of features that can classify new samples into previously defined TCGA molecular subtypes-a step toward molecular subtype application in the clinic. We validate select classifiers using external datasets. Predictive performance and classifier-selected features yield insight into the different machine-learning approaches and genomic data platforms. For each cancer and data type we provide containerized versions of the top-performing models as a public resource.

Keywords: TCGA; artificial intelligence; biomarkers; cancer; classification; epigenomic; genomic; machine learning; molecular; pathology.


Conflict of interest statement

Declaration of interests A.D.C. receives research support from Bayer and consults for KaryoVerse. W.R. is currently working at Pfizer. I.T., P.C., and V.L. are or were directly or indirectly affiliated with JADBio—Gnosis DA, S.A., which offers the JADBio service commercially. V.F. is an employee and stock option owner of Bluestar Genomics Inc. L.R.R. has received grants from Bayer, Boston Scientific, Exact Sciences, FujiFilm Medical Sciences, Gilead Sciences, GlycoTest, RedHill, and Target PharmaSolutions and serves in a consulting/advising role for AstraZeneca, Bayer, Eisai, Exact Sciences, Gilead Sciences, Global Life Science Consulting, GRAIL, LLC, Hepion, MedEd Design, Medscape, Novartis Venture Fund, QED, RedHill, and The Lynx Group. A.J.L. has consulting relationships with AbbVie, Astra-Zeneca, Bayer, Bio-AI Health, BMS, Caris, Deciphera, Foghorn Therapeutics, GRAIL, GSK, Illumina, Invitae/Archer DX, Iterion Therapeutics, Merck, Novartis, Nucleai, Paige, Pfizer, Regeneron, Roche/Genentech, SpringWorks, Tempus, and ThermoFisher. W.R. and G.G. are co-inventors of a patent application related to lung adenocarcinoma expression subtypes (U.S. Provisional Patent Application No.: 63/293,349). P.W.L. serves on the Scientific Advisory Boards of FOXO Technologies, Inc., and Tagomics, LLC. J.M.S. is a stock owner of Nantomics Inc. V.U. is an employee and stock owner of Bristol Myers Squibb.

Figures
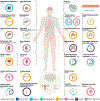
Figure 1.
Figure 1.. Cancer types and subtyping
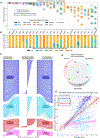
An overview of the cancer cohorts and subtypes studied as part of this project, color-coordinated by the genomic data type(s) used to define the subtypes. For a given cancer type, subtypes are indicated with a ring around the corresponding inset organ view. Breaks in each ring distinguish the subtypes. In cases where the subtype is informed by more than one data type, concentric arcs are shown. Only subtypes with two or more samples are shown; “x”s mark small subtypes that were excluded from classifier development. See also Table S1.
Figure 2.
Figure 2.. Process workflow
(A) Analysis workflow for classifier training and testing for an example cohort, using somatic mutations, copy number alterations, DNA methylation, and expression data for mRNAs and for miRNA mature strands. The (approximate) number of features for each data type in the original genomic data are provided, followed by the number in the filtered feature matrix (medians across all 26 cohorts). (B) The five ML approaches used in this study. MUT, mutation; CN, copy number; METH, DNA methylation. See also Table S2.
Figure 3.
Figure 3.. Overview of classifier performance metrics
(A) Classifier performance for each subtype in the 26 tumor type cohorts, representing the mean of the overall weighted F1 score of the most accurate model for predicting the subtypes within each tumor type (horizontal red bars). Subtype performance is plotted as round markers, numbered by subtype and colored by the data type used originally to define that subtype. (B) Proportion of model-selected feature-set data types for the top model in each cohort. At the base of each stacked bar is the number of gene-based features utilized by a cohort’s subtype classifier. (C) Concordance of the original METABRIC PAM50 calls to SK Grid (left) and AKLIMATE (right) classifications. The central horizontal bars depict the silhouette scores for each sample. (D) Venn diagram summarizing the union and intersection counts of samples across the METABRIC validation experiment. (E) Comparison of sample silhouette scores vs. the difference in confidence score between the best and second-best sample prediction confidence calls for AKLIMATE; colored by subtype. Circles indicate samples with concordant calls and triangles indicate samples with discordant calls. The linear regression trend lines for each subtype, with associated 95% confidence intervals, are shown. See also Figures S1, S2, and Tables S3, S4, and S5.
Figure 4.
Figure 4.. Performance of models using single data types vs. multi-omics
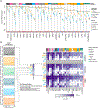
(A) The best-performing model for each data type is indicated by colored dot for each cohort, with vertical bars representing the range across subtypes. Asterisks denote cohorts where the top single data type model achieved performance equivalent to or better than the top multi-omics model performance, which is indicated by a horizontal black bar. The upper annotation track indicates the data type(s) originally used to define the subtypes. The bottom annotation bar indicates the method that produced the top models. (B) Influence of feature set size on performance. For each cancer cohort, for each method and data type, a plot of cohort performance as a function of a priori defined feature set size produces an area under the curve (AUF1C). As an example, the curves for the ESCC cohort for CloudForest multi-omics and single data type models are shown on the left. A heatmap of the AUF1C values for multi-omics and single data type models is shown on the right. Above the heatmap, the upper annotation track indicates how the subtypes were originally defined. See also Figure S3 and Table S4.
Figure 5.
Figure 5.. Feature sets of top performing models
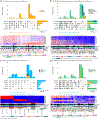
(A–D) Analysis of the overlap in feature sets among top models for each of four cancer cohorts. (A) BRCA (expression clustering-based subtyping), (B) COADREAD (DNA methylation clustering-based subtyping), (C) SKCM (mutation clustering-based subtyping), and (D) LGGGBM (DNA methylation clustering-based subtyping). For each cancer cohort, we identified the top model for each method. Models were allowed to select up to 100 features, except JADBio, which limited its feature set to a maximum of 25. Overlap among the selected feature sets is represented in Upset plots. A bar chart of model overlap indicates feature membership in the top models of the five methods. The set of features selected in two or more models for each cancer cohort is designated as the “core” feature set for that cancer cohort. The heatmaps represent a hierarchical clustering analysis of the core feature measurements for the main selected data type for all cohort samples. Sample rows in heatmaps are organized by subtype. The method annotation panels indicate min-max normalized feature importance values, with 1 indicating the most important feature (the entire model feature set was normalized regardless of platform). Gene symbols (heatmap columns) are colored red to indicate membership in the corresponding annotation list; PAM50 membership (BRCA), DNA methylation literature support (COADREAD and LGGGBM cohorts).,– See also Figure S4.
Figure 6.
Figure 6.. Pathways and biology of classifier features
(A) Pathway space representation of PathwayCommons V12 (gray background graph). Left panel: pathway space location of cancer-associated genes from the COSMIC-CGC database (release v95, tier 1 collection) (red circles). Labels represent the top 30 “hub” genes in the graph. Right panels: pathway space locations of BRCA, LGGGBM, and COADREAD classifier feature lists (colored circles). Dark diamonds indicate intersections in ≥2 ML methods; text labels indicate intersections in ≥3 machine-learning methods. (B) Density of selected genes in the pathway space depicted in (A). Summits represent dense collections of genes, and are numbered from the most to the least dense. Left panel: COSMIC-CGC summits. Right panels: single cohort summits. White outlines indicate the locations of COSMIC-CGC summits in the left panel. (C) Distances between classifier feature lists in pathway space. The x axis shows the average shortest-path distance to nearest neighbors between gene lists. Top panel: Distance from TCGA-subtype classifier features to COSMIC-CGC genes. Lower panels: Distance from the classifier feature list of one method to the gene lists of the other methods, expressed as z-scores, using the distribution of random gene list distances. (D) Enrichment analysis of BRCA, LGGGBM, and COADREAD summits. Genes in each summit were ranked by a signal-to-noise ratio (SNR) metric. Tracks below the summits show the distribution of feature lists from the top-performing models. Feature lists enriched in summits are indicated in red. See also Figure S5 and Tables S6 and S7.
Figure 7.
Figure 7.. Factors influencing accurate subtype classification
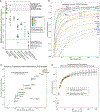
(A) Correlation between meta-features and subtype classifier performance in 26 TCGA cohorts. Meta-features are grouped into seven meta-feature groups (MFG1–7) by hierarchical clustering. Two horizontal dashed lines mark significance thresholds (FDR-corrected Spearman correlation p values ≤0.05). PCs, principal components. (B) Learning curves for 26 TCGA cohorts. Cohort performance as a function of sample size; each cohort was randomly sampled 100 times at each sample size-increment, and predictive accuracy was averaged across the sub-samplings. (C) Predicted vs. actual cohort performance for the 15 cohorts with at least 250 tumor samples. The predicted performance at a sample size of 250 was estimated from the power-law curve fit to the sample-size range of 35 through 70 for each cohort. (D) Representative extension of power-law accuracy prediction for a smaller TCGA cohort (adrenocortical carcinoma, 76 total samples). See also Figure S6 and Table S8.
Figure 8.
Figure 8.. Guide to selection of the best model for a new sample
Decision chart to guide the selection of data and model to assign a TCGA subtype label to a non-TCGA patient sample. If genomic data exists for a new sample as indicated in the upper branch, then the best-performing model can be selected from Table S5 for the existing data type. In the lower branch the best overall model in Table S5 will dictate the type of data required for that model.

References

    1. Kumar V, Abbas AK, and Aster JC (2021). Robbins & Cotran Pathologic Basis of Disease, 10th Edition (Elsevier; ), pp. 1–1392.
    1. Kleihues P, and Sobin LH (2000). World Health Organization classification of tumors. Cancer 88, 2887. 10.1002/1097-0142(20000615)88:12<2887::aid-cncr32>3.0.co;2-f. - DOI - PubMed
    1. Sobin LH, Gospodarowicz MK, and Wittekind C (2011). TNM Classification of Malignant Tumours, 7th Edition (John Wiley & Sons; ), pp. 1–336.
    1. Hoadley KA, Yau C, Hinoue T, Wolf DM, Lazar AJ, Drill E, Shen R, Taylor AM, Cherniack AD, Thorsson V, et al. (2018). Cell-of-Origin Patterns Dominate the Molecular Classification of 10,000 Tumors from 33 Types of Cancer. Cell 173, 291–304.e6. 10.1016/j.cell.2018.03.022. - DOI - PMC - PubMed
    1. Penson A, Camacho N, Zheng Y, Varghese AM, Al-Ahmadie H, Razavi P, Chandarlapaty S, Vallejo CE, Vakiani E, Gilewski T, et al. (2020). Development of Genome-Derived Tumor Type Prediction to Inform Clinical Cancer Care. JAMA Oncol. 6, 84–91. 10.1001/jamaoncol.2019.3985. - DOI - PMC - PubMed

Substances