. 2025 Jun;19(6):1737-1750.
doi: 10.1002/1878-0261.13791. Epub 2025 Jan 3.

Targeted metabolomics reveals novel diagnostic biomarkers for colorectal cancer

Affiliations

Targeted metabolomics reveals novel diagnostic biomarkers for colorectal cancer

Zuojian Hu et al. Mol Oncol. 2025 Jun.

Abstract

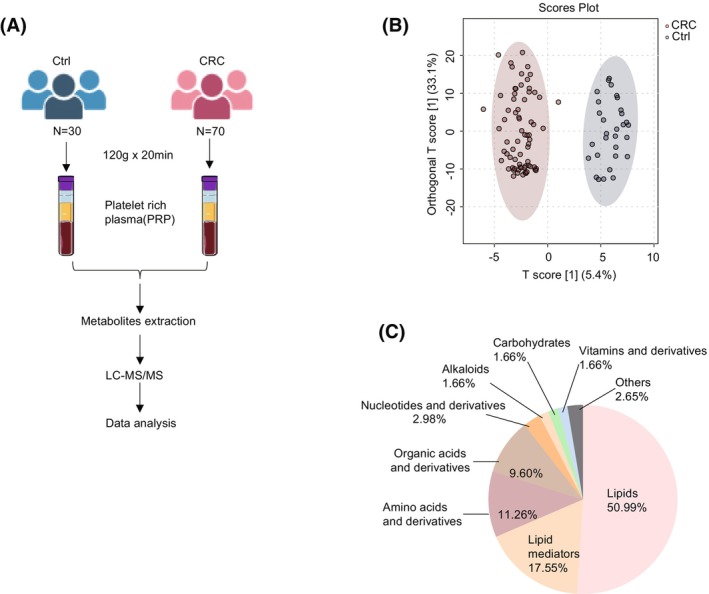
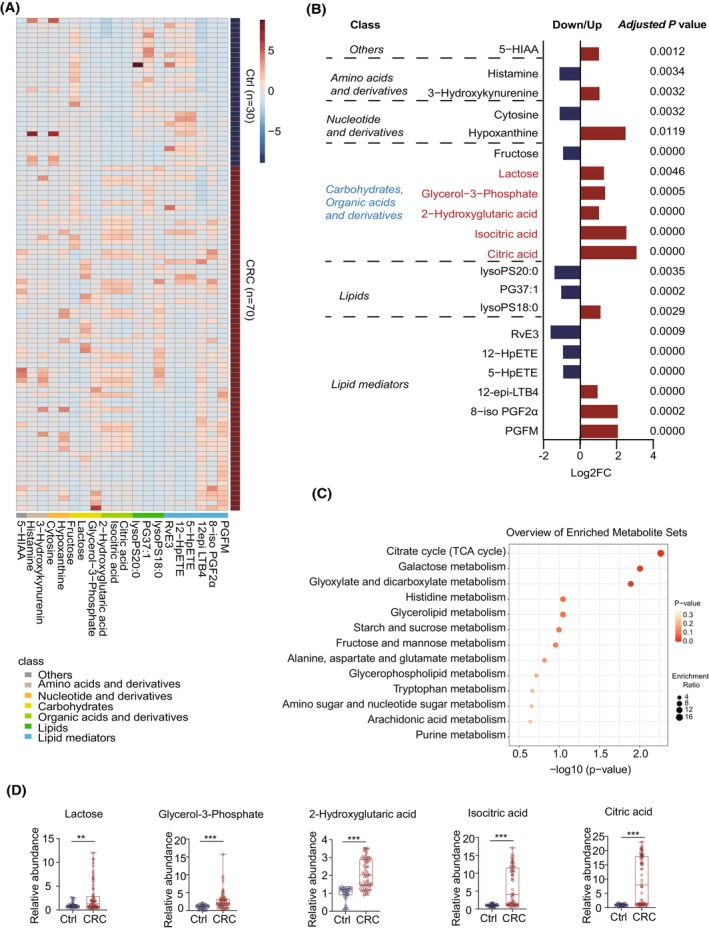
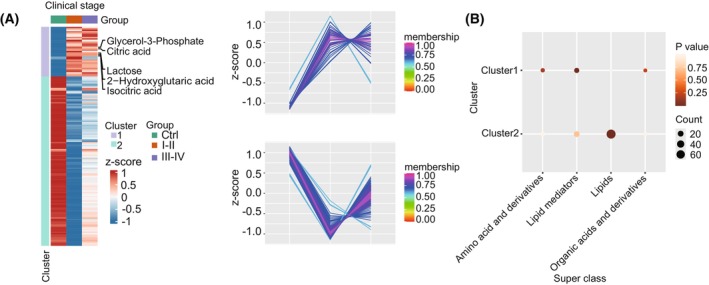
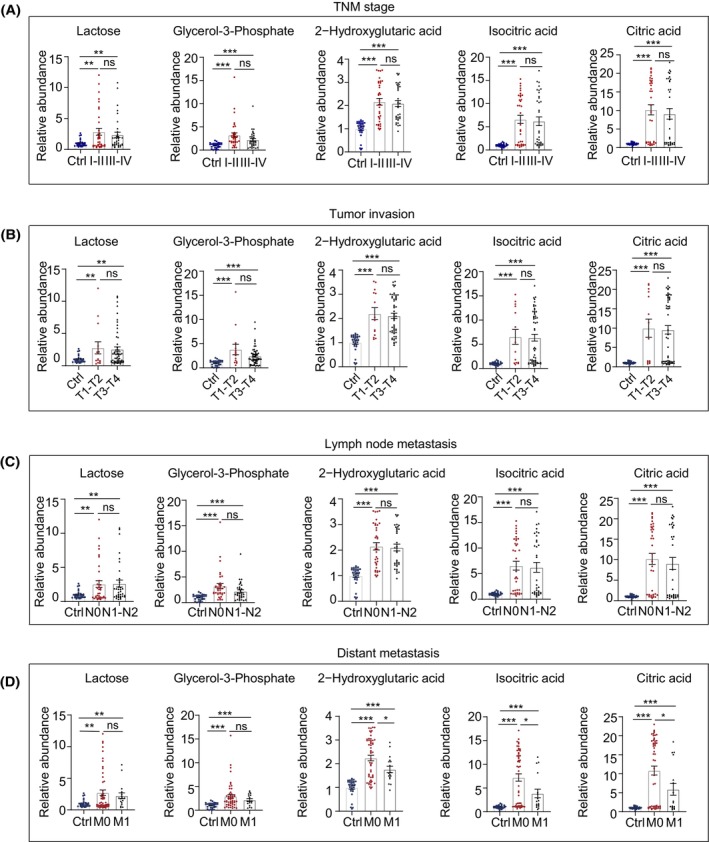
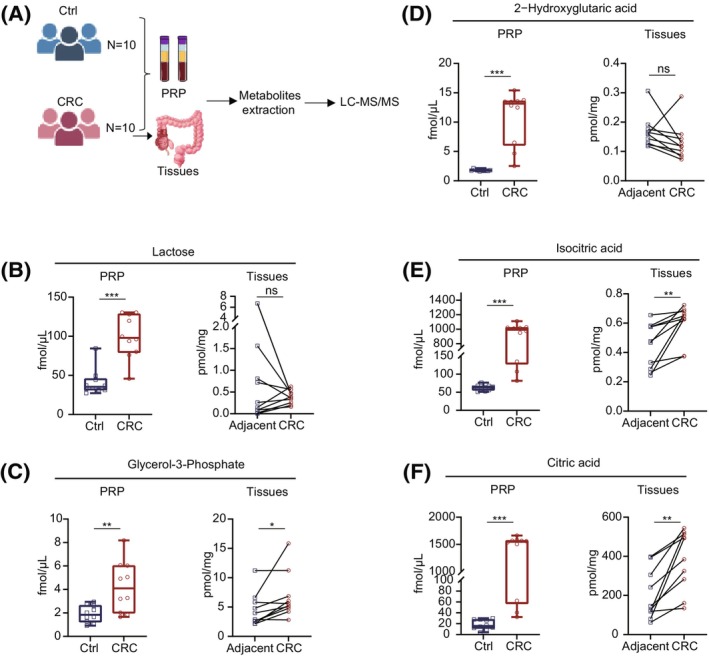
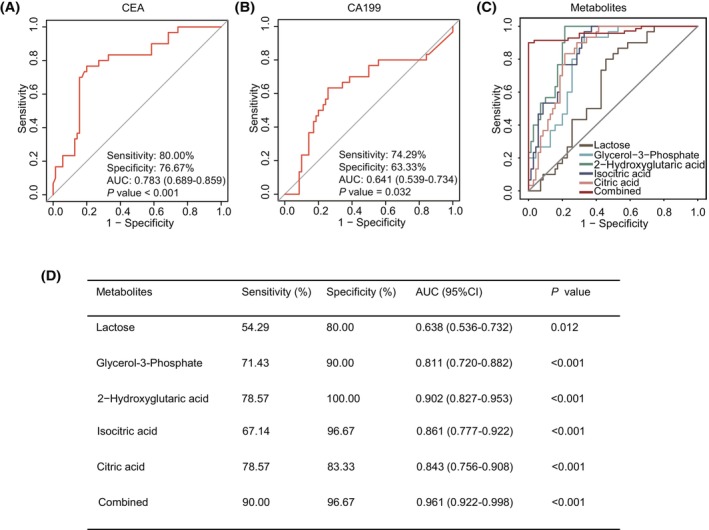
Colorectal cancer (CRC) is a prevalent malignant tumor worldwide, with a high mortality rate due to its complex etiology and limited early screening techniques. This study aimed to identify potential biomarkers for early detection of CRC utilizing targeted metabolite profiling of platelet-rich plasma (PRP). Based on multiple reaction monitoring (MRM) mode, liquid chromatography tandem mass spectrometry (LC-MS/MS) analysis identified metabolites in PRP collected from patients with CRC (n = 70) and healthy controls (n = 30). A total of 302 metabolites were identified and quantified in this study, including various categories such as lipids, lipid mediators, amino acids, and derivatives, organic acids and derivatives, nucleotides and derivatives, alkaloids, carbohydrates, vitamins and derivatives, and others. The differential analysis revealed that five carbohydrates and organic acids (lactose, glycerol-3-phosphate, 2-hydroxyglutaric acid, isocitric acid, and citric acid) involved in the carbohydrate metabolism pathway displayed consistent upregulation within PRP derived from patients with CRC. To further validate the abundance of differential metabolites, 10 pairs of CRC tissues, adjacent tissues, and matched PRP were collected. Ultimately, five carbohydrate metabolites were validated in PRP, and compared with carcinoembryonic antigen (CEA) and cancer antigen 19-9 (CA199), the five carbohydrate metabolites significantly improved the specificity of differentiating patients with CRC from healthy controls. Furthermore, the diagnostic efficacy of the combined five-carbohydrate metabolite panel was superior to that of individual metabolites, CEA and CA199. The sensitivity, specificity, and AUC of the metabolite panel in distinguishing patients with CRC from healthy controls were 90.00%, 96.67%, and 0.961 (95% CI 0.922-0.998), respectively. Collectively, metabolomics was used to identify and validate differential metabolites in the PRP of CRC, which may serve as potential early screening markers for patients with CRC.

Keywords: carbohydrate metabolites; colorectal cancer; diagnostic model; metabolomics; platelet rich plasma.


Conflict of interest statement

The authors declare no conflict of interest.

Figures

Fig. 1
Fig. 1
Targeted metabolomics analysis of platelet‐rich plasma (PRP) in colorectal cancer (CRC) patients. (A) Schematic illustration of targeted metabolomics method used to identify characteristic metabolites. (B) Orthogonal partial least squares‐discriminant analysis (OPLS‐DA) score plot for metabolites of PRP samples collected from CRC and healthy controls by liquid chromatography tandem mass spectrometry (LC–MS/MS). (C) Pie chart of metabolite classification identified by metabolomics in CRC and healthy controls.
Fig. 2
Fig. 2
Platelet‐rich plasma (PRP) metabolic profiles in patients with colorectal cancer (CRC) (n = 70) and healthy controls (n = 30). (A) The heatmap showed the levels of 20 PRP differential metabolites between the CRC group and the control group. (B) Classification and fold changes of differential metabolites between two groups. (C) Pathway enrichment analysis of differential metabolites between two groups. (D) Relative abundance of five upregulated metabolites related to carbohydrate metabolism was observed in CRC patients. **P value < 0.01 and ***P value < 0.001. Error bars indicate SEM. The P values indicate results from Student's t‐test or BH‐adjusted P value. TCA, tricarboxylic acid cycle.
Fig. 3
Fig. 3
Platelet‐rich plasma (PRP) metabolic profiles unveil metabolic dysregulation in colorectal cancer (CRC) patients. (A) Heatmap of 158 differential metabolites (the one‐way analysis of variance (ANOVA) test, P < 0.05) clustered using mFuzz into two discrete significant clusters. (B) Superclass enrichment based on the differential metabolites.
Fig. 4
Fig. 4
The relative abundance of five carbohydrate metabolites in different stages of colorectal cancer (CRC) progression. (A–D) The relative abundance of lactose, glycerol‐3‐phosphate, 2‐hydroxyglutaric acid, isocitric acid, and citric acid in tumor node metastasis (TNM) staging (A), tumor invasion degree (B), lymph node metastasis (C), or distant metastasis (D) of patients with CRC. *P value < 0.05, **P value < 0.01, ***P value < 0.001, and ns, non‐significant. Error bars indicate SEM. The P values indicate results from Student's t‐test.
Fig. 5
Fig. 5
Validation results of five potential metabolic markers in tissues and platelet‐rich plasma (PRP) of colorectal cancer (CRC) patients. (A) Schematic illustration of targeted metabolomics method used to identify metabolites. (B–F) The concentrations of lactose (B), glycerol‐3‐phosphate (C), 2‐hydroxyglutaric acid (D), isocitric acid (E), and citric acid (F) in CRC tissues, adjacent tissues, and PRP. *P value < 0.05, **P value < 0.01, ***P value < 0.001, and ns, non‐significant. Error bars indicate SEM. The P values indicate results from Student's t‐test. LC‐MS/MS, liquid chromatography tandem mass spectrometry.
Fig. 6
Fig. 6
Receiver operating characteristic (ROC) curve analysis of five potential metabolic markers in platelet‐rich plasma (PRP) of colorectal cancer (CRC) patients. (A, B) The diagnostic efficacy of carcinoembryonic antigen (CEA) (A) and cancer antigen 19‐9 (CA199) (B) in distinguishing CRC patients from healthy controls. (C) ROC curve analysis of lactose, glycerol‐3‐phosphate, 2‐hydroxyglutaric acid, isocitric acid, and citric acid in PRP of CRC patients. (D) The sensitivity, specificity, and area under the curve (AUC) of lactose, glycerol‐3‐phosphate, 2‐hydroxyglutaric acid, isocitric acid, and citric acid in distinguishing CRC patients from healthy controls. The P values indicate results from the Delong‐method. CI, confidence interval.

Similar articles

Cited by

References

    1. Wu W, Chen X, Fu C, Wong MCS, Bao P, Huang J, et al. Risk scoring systems for predicting the presence of colorectal neoplasia by fecal immunochemical test results in Chinese population. Clin Transl Gastroenterol. 2022;13(10):e00525. - PMC - PubMed
    1. Sung H, Ferlay J, Siegel RL, Laversanne M, Soerjomataram I, Jemal A, et al. Global cancer statistics 2020: GLOBOCAN estimates of incidence and mortality worldwide for 36 cancers in 185 countries. CA Cancer J Clin. 2021;71(3):209–249. - PubMed
    1. Yang Y, Wang Z, Li X, Lv J, Zhong R, Gao S, et al. Profiling the metabolic disorder and detection of colorectal cancer based on targeted amino acids metabolomics. J Transl Med. 2023;21(1):824. - PMC - PubMed
    1. Olsson L, Sjöberg D. Accuracy of a faecal immunochemical test in patients under colonoscopy surveillance of colorectal adenoma and cancer. Ups J Med Sci. 2023;128. 10.48101/ujms.v128.8869 - DOI - PMC - PubMed
    1. Bagheri R, Ghorbian M, Ghorbian S. Tumor circulating biomarkers in colorectal cancer. Cancer Treat Res Commun. 2024;38:100787. - PubMed

Substances