. 2025 Jan 3;16(1):289.
doi: 10.1038/s41467-024-55170-5.

Macrophage STING signaling promotes fibrosis in benign airway stenosis via an IL6-STAT3 pathway

Affiliations

Macrophage STING signaling promotes fibrosis in benign airway stenosis via an IL6-STAT3 pathway

YiLin Chen et al. Nat Commun. .

Abstract

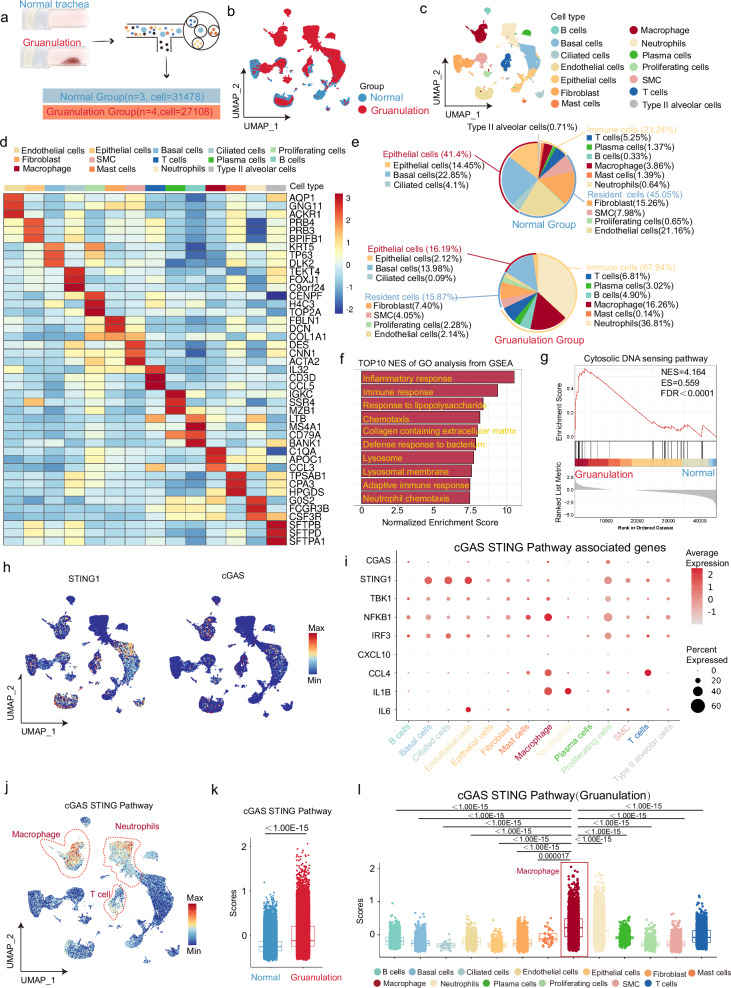
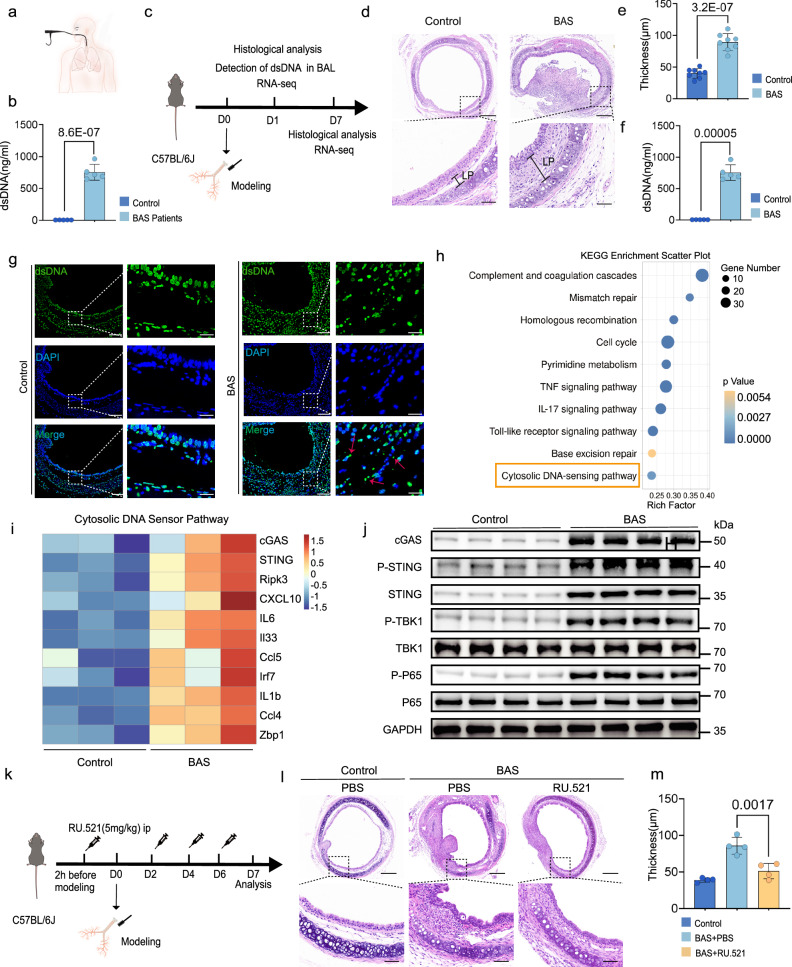
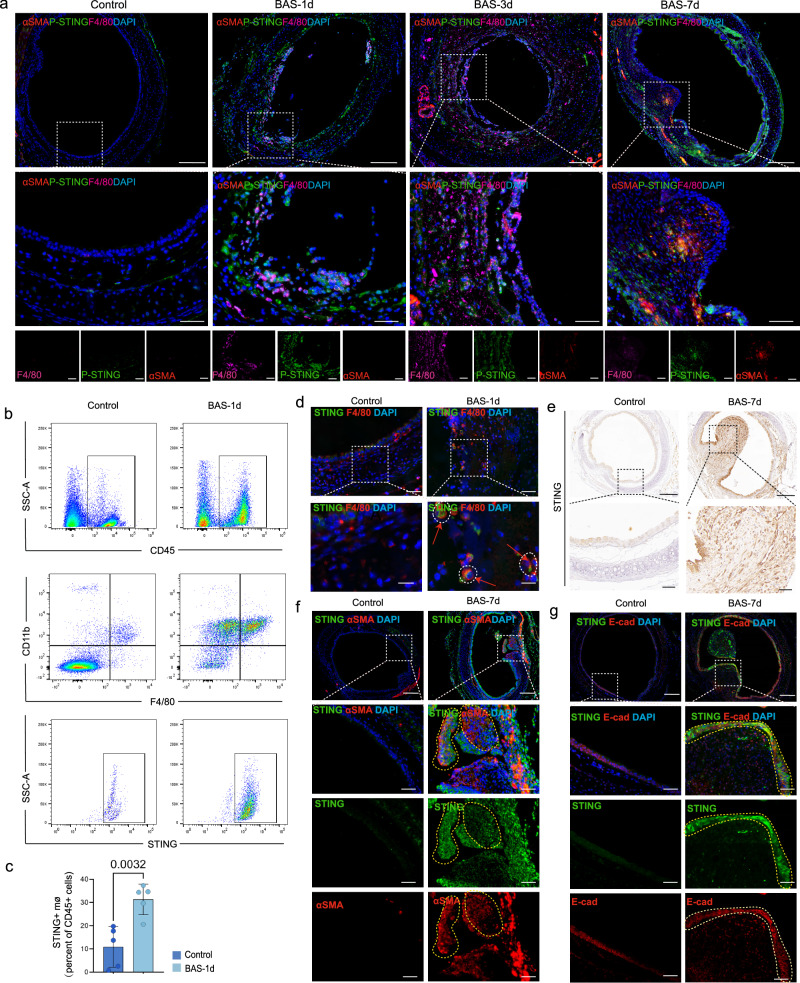
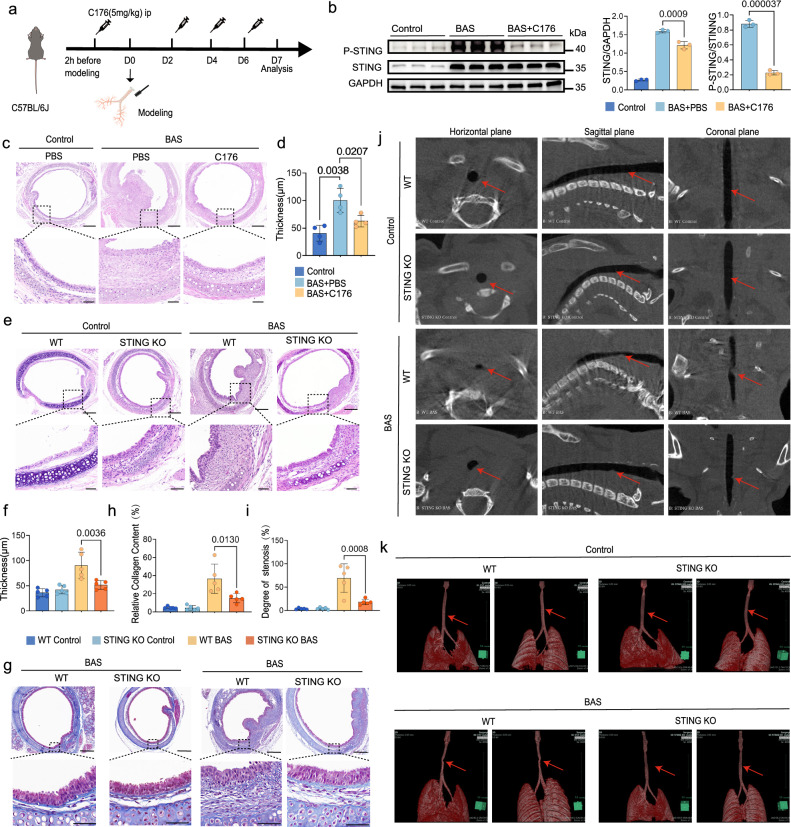
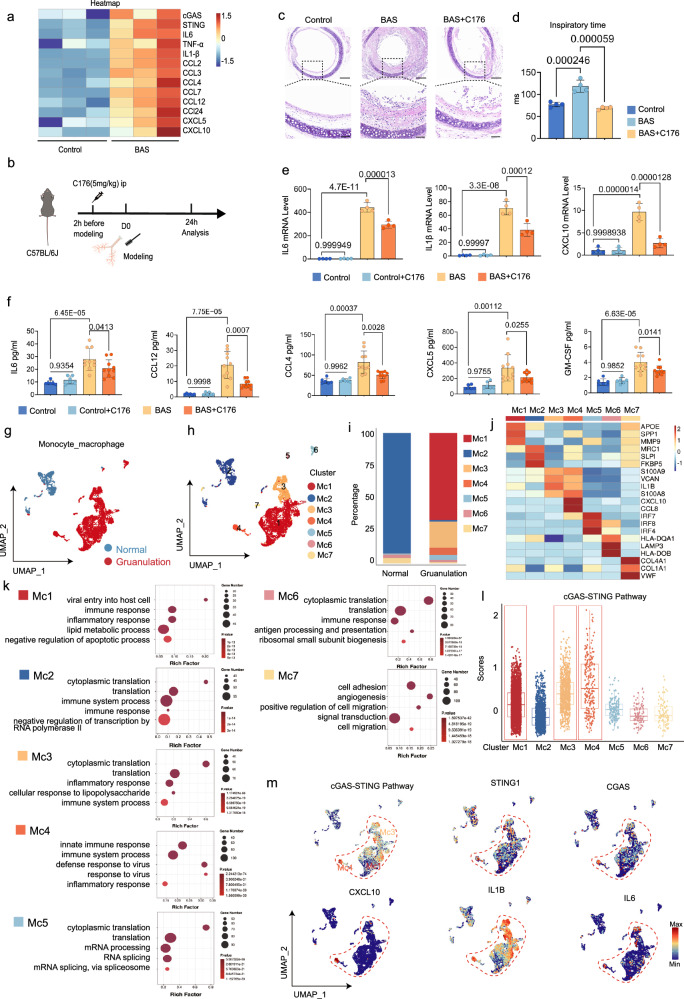
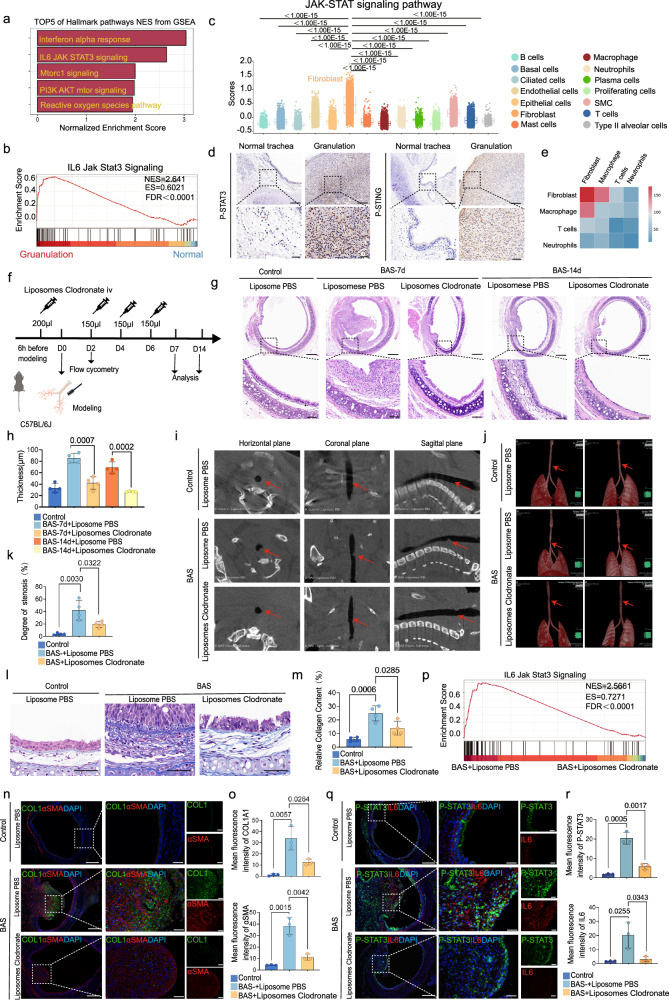
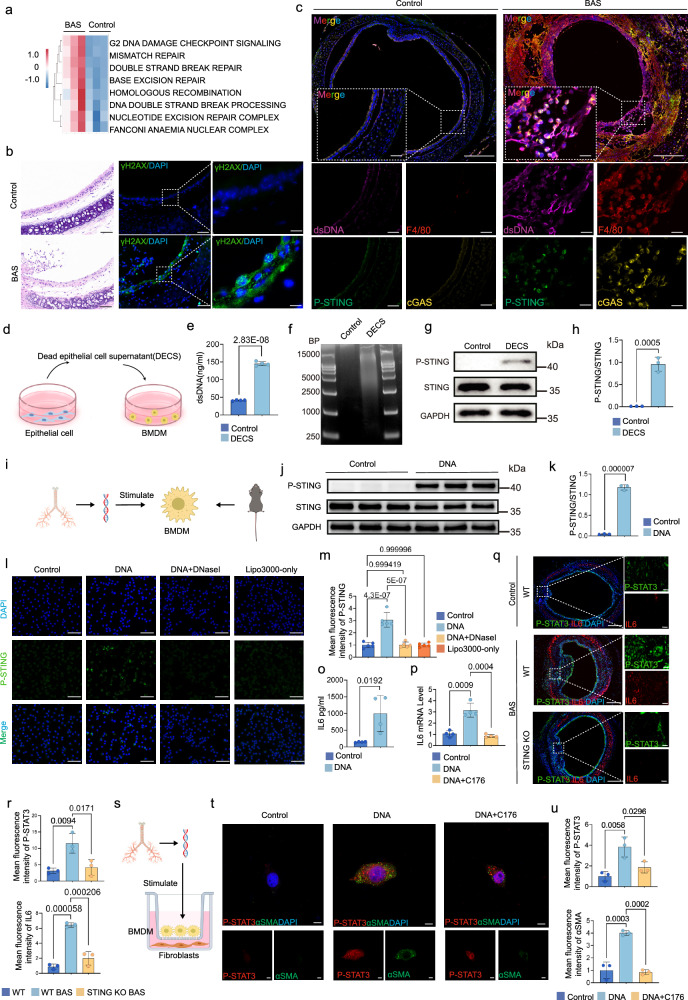
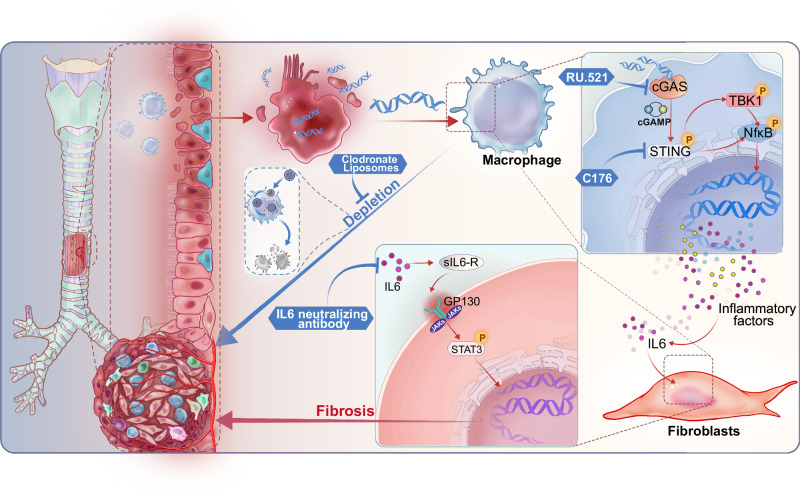
Acute and chronic inflammation are important pathologies of benign airway stenosis (BAS) fibrosis, which is a frequent complication of critically ill patients. cGAS-STING signalling has an important role in inflammation and fibrosis, yet the function of STING in BAS remains unclear. Here we demonstrate using scRNA sequencing that cGAS‒STING signalling is involved in BAS, which is accompanied by increased dsDNA, expression and activation of STING. STING inhibition or deficiency effectively alleviates tracheal fibrosis of BAS mice by decreasing both acute and chronic inflammation. Macrophage depletion also effectively ameliorates BAS. Mechanistically, dsDNA from damaged epithelial cells activates the cGAS-STING pathway of macrophages and induces IL-6 to activate STAT3 and promote fibrosis. In summary, the present results suggest that cGAS-STING signalling induces acute inflammation and amplifies the chronic inflammation and tracheal fibrosis associated with benign airway stenosis, highlighting the mechanism and potential drug target of BAS.


Conflict of interest statement

Competing interests: The authors declare no competing interests.

Figures

Fig. 1
Fig. 1. Expression of the cGAS-STING pathway in BAS patients by single-cell RNA sequencing.
a Schematic overview of the experimental design. Single-cell RNA sequencing of Normal group (n = 3, cell=31,478) and Granulation group (n = 4, cell=27108). b UMAP visualization of Normal group and Granulation group (58586 cells in total). c UMAP visualization of 14 cell types (58586 cells in total). d Heatmap of expression for three representative marker genes of each cell type. e Pie chart of the total proportion of each cell type identified in Normal group and Granulation group. f GSEA analysis of increasingly expressed genes showing TOP 10 of enriched GO terms in Granulation group compared with Normal group. g GSEA analysis showing significant enrichment of gene sets associated with cytosolic DNA sensor pathway in Granulation group compared with Normal group. h UMAP visualization of STING and cGAS expression in all clusters. i Dot plot showing the expression of cGAS-STING pathway 9 associated genes (cGAS, STING, TBK1,NFKB1, IRF3, CXCL10,CCL4,IL1B,IL6) in all clusters. j UMAP visualization of cGAS-STING pathway score in all clusters. k Box Plot showing the cGAS-STING pathway score in Normal group (n = 31,478 cells) and Granulation group (n = 27,108 cell). l Box Plot showing the cGAS-STING pathway score in all clusters of Granulation group: B cells (n = 1329), basal cells (n = 3790), ciliated cells (n = 25), endothelial cells (n = 580), epithelial cells (n = 574), fibroblasts (n = 2004), mast cells (n = 39), macrophages (n = 4409), neutrophils (n = 9977), plasma cells (n = 819), proliferating cells (n = 619), SMCs (n = 1097) and T cells (n = 1846). n represents the number of cells in cluster. In (k, l), box bounds shows 25th and 75th percentiles, whiskers shows 25th percentiles minus 1.5*IQR(Interquartile Range, the value is 75th percentiles minus 25th percentiles) to 75th percentiles plus 1.5*IQR and box center shows the median.The two-sided Mann Whitney test was used in (k). One-way ANOVA analysis followed by Duncan multiple- range test was used in (l). Source data are provided as a Source Data file.
Fig. 2
Fig. 2. cGAS-STING signalling is activated in mouse tracheal upon injury.
a Schematic diagram of tracheal lavage of the patient. b Quantification analysis of dsDNA in tracheal lavage fluid in control group (n = 5) and BAS patients’ group (n = 5). c Schematic diagram describing experimental strategies in mice with benign airway stenosis. d H&E staining showing Intratracheal and LP conditions in control and BAS mice at 7th day. Scale bars indicate 200μm and 50μm.e Quantitative analysis of LP thickness in control group and BAS group (n = 8 mice per group). fj Tracheal tissues were collected from mice with BAS at 24 h after tracheal injury. f Quantitative detection of dsDNA in tracheal lavage fluid of mice in control group and BAS group (n = 5 mice per group). g Representative tracheal immunofluorescence images of dsDNA(green) in the BAS group and control group. Scale bars indicate 100μm and 20 μm (n = 3 mice per group). h Kyoto Encyclopedia of Genes and Genomes (KEGG) analysis showing that tracheal injury upregulated genes involved in several biological process. i Heatmap showing that the BAS group upregulated genes involved in cytosolic DNA sensor pathway compare to control group (n = 3 mice per group). j Western blot analysis showing the levels of cGAS, P-STING, STING, P-TBK1, TBK1, P-P65, and P65 in the trachea of BAS group and control group (n = 4 mice per group) at 24 h. k Schematic of Ru.521(5 mg/kg, ip) administration in mice. l H&E staining showing Intratracheal and LP conditions in control and BAS mice at 7th day. Scale bars indicate 200 μm and 50 μm.m Quantitative analysis demonstrated decreased lamina propria thickness in BAS group treated with Ru.521 compared to BAS group treated with PBS (n = 4 mice per group). Data are presented as the mean ± SEM. A two-sided student’s T-test was used in (b, e, f). hypergeometric test was used in (h). One-way ANOVA analysis followed by Tukey post hoc multi-comparison test was used in (m). Source data are provided as a Source Data file.
Fig. 3
Fig. 3. STING was expressed at different stages of BAS.
a Tracheal specimens were collected from control group of mice and BAS group of mice at 24 h, 3 days, and 7 days after modeling, and representative immunofluorescence images of P-STING (green), macrophages (marked with F4/80, pink), fibroblasts (marked with aSMA, red) in mice tracheal tissues. Scale bars indicate 200 μm and 50 μm (n = 3 mice per group). bd Tracheal tissues were collected from mice with BAS at 24 h after tracheal injury. b, c Flow cytometry plots demonstrate percentage of STING+ macrophages in tracheal leukocytes (CD45+ cells), and the results showed that the percentage was significantly higher in the BAS group compare to control group (n = 5 mice per group). d Representative tracheal immunofluorescence images of STING(green), and macrophages (marked with F4/80, red) in mice (n = 4 mice per group). Scale bars indicate 50 μm and 20 μm. Red arrows indicate STING+ macrophages. eg Tracheal tissues were collected from mice with BAS at 7 d after tracheal injury. e Immunohistochemical results suggested that STING expressing in the trachea of BAS mice at the granulation stage on the 7th day (n = 3 mice per group). Scale bars indicate 200 μm and 50 μm. f Representative tracheal immunofluorescence images of STING (green), and fibroblasts (marked with aSMA, red) in mice (n = 3 mice per group). Yellow dashed line: Areas of co-expression of STING and aSMA. Scale bars indicate 200 μm and 50 μm. g Representative tracheal immunofluorescence images of STING (green), and epithelial cells (marked with E-cad,red) in mice (n = 3 mice per group). Yellow dashed line: Areas of co-expression of STING and E-cad. Scale bars indicate 200μm and 50μm. Data are presented as the mean ± SEM. A two-sided student’s T-test was used in (c). Source data are provided as a Source Data file.
Fig. 4
Fig. 4. Suppression of the STING attenuates the development of BAS.
a Schematic of C176 administration in mice. b Western blot analysis showing the P-STING and STING expression in mouse trachea at 24 h after modeling in control group, BAS group treated with PBS and BAS group treated with C176 (n = 3 mice per group). c H&E staining showing Intratracheal and lamina propria conditions in control group, BAS group treated with PBS and BAS group treated with C176 (n = 4 mice per group). Scale bars indicate 200 μm and 50 μm. d Quantitative analysis demonstrated decreased lamina propria thickness in BAS group treated with C176 compared to BAS group treated with PBS (n = 4 mice per group). e H&E staining showing Intratracheal and lamina propria conditions in WT control group,STING KO control group, WT BAS group, STING KO BAS group (n = 5 mice per group). Scale bars indicate 200 μm and 50 μm. f Quantitative comparison of tracheal LP showed reduced thickness at STING KO BAS group compare to WT BAS group (n = 5 mice per group). g, h Tracheal sections stained with Masson trichromatic staining of different groups of mice, and relative collagen content were reduced in STING KO BAS group compare to WT BAS group (n = 5 mice per group).Scale bars indicate 200 μm and 50 μm. i The CT diagram of the area of tracheal stenosis measured by SYNPASE 3D, and results showed that the area of tracheal stenosis in STING KO BAS group was significantly smaller than that in WT BAS group (n = 5 mice per group). j Micro CT scans of different groups in Horizontal, Coronal and Sagittal plane with red arrows indicating the stenosis site. k SYNPASE 3D reconstruction of mouse trachea with red arrows indicating the stenosis site. Data are presented as the mean ± SEM. Two-sided student’s T-test were used in (b). One-way ANOVA analysis followed by Tukey post hoc multi-comparison test was used in (b, d). Two-way ANOVA analysis followed by Tukey post hoc multi-comparison test was used in (f, h, i). Source data are provided as a Source Data file.
Fig. 5
Fig. 5. STING expression in macrophages in BAS is associated with inflammation.
a Heatmap showing that the BAS group upregulated genes involved in cGAS,STING and inflammation factors compare to control group at 24 h after tracheal injury (n = 3 mice per group). bf Mice were divided into three groups: control, BAS + PBS and BAS + C176. b Schematic of C176 administration in mice. c Representative images of H&E staining in different groups. Scale bars indicate 200 μm and 50 μm. d Quantitative comparison of lung function indices (Inspiratory time) in different groups (n = 4 mice per group). e mRNA levels of IL6, IL1β and Cxcl10 in trachea from different groups (n = 4 mice per group). f Protein levels of inflammation factors (IL6,CCL12,CCL4,CXCL5 and GM-CSF)in trachea from different groups (n = 6 mice per control group, n = 8 mice per BAS group). gm sc-RNA seq analysis of macrophage clusters. g UMAP visualization of macrophage clusters in Normal group (1216 cells in total) and Granulation group (4409 cells in total). h UMAP visualization of Seven types of macrophages (5625 cells in total). i Barplot of the percentage of each type in Normal group and Granulation group. j Heatmap of expression for three representative marker genes of each cell type. k Dot plot of the enriched Gene ontology (GO) biological processes of highly expressed genes in each cluster. Dot size corresponds to the proportion of cells within the group expressing each gene, and dot color correspond to GO enrichment p-value. l Box Plot showing the cGAS-STING pathway score in all clusters:Mc1 (n = 2945), Mc2(n = 1176), Mc3 (n = 881), Mc4 (n = 245), Mc5 (n = 172), Mc6 (n = 110), Mc7 (n = 96). n represents the number of cells in cluster. m UMAP visualization of cGAS-STING pathway score and the expression of STING,cGAS,IL1B,IL6 and CXCL10 in all clusters. In (l), box bounds shows 25th and 75th percentiles, whiskers shows 25th percentiles minus 1.5*IQR to 75th percentiles plus 1.5*IQR and box center shows the median. Data are presented as the mean ± SEM. One-way ANOVA analysis followed by Tukey post hoc multi-comparison test was used in (d, e). Kruskal waliis test used in (f). Hypergeometric test was used in (k). Source data are provided as a Source Data file.
Fig. 6
Fig. 6. Macrophages promote fibroblast activation via the IL6-STAT3 axis.
a GSEA analysis showing TOP5 enriched hallmark pathways in Granulation group compared with Normal group. b GSEA analysis show IL6 jak STAT3 pathway enrichment in Granulation group. c Box Plot showing the JAK-STAT pathway score in all clusters in Normal group and Granulation group: B cells (n = 1434), basal cells(n = 10982), ciliated cells (n = 1317), endothelial cells (n = 7241), epithelial cells (n = 5123), fibroblasts (n = 6808), mast cells (n = 475), macrophages (n = 5625), neutrophils (n = 10178), plasma cells (n = 1249), proliferating cells (n = 824), SMCs (n = 3608), T cells (n = 3500) and Type II alveolar cells (n = 222). n represents the number of cells in cluster. d Representative images of P-STAT3 and P-STING immunohistochemical staining. (n = 3 sample per group). e Heatmap illustrates ligand-receptor interactions between Macrophages, T cells, neutrophils, and fibroblasts. fr Mice were divided into three groups: control, BAS + PBS and BAS + Clodronate Liposomes. f Schematic of Clodronate Liposomes administration in mice. g Representative images of H&E staining in different groups at days 7 and 14. h Quantitative analysis of LP thickness in different groups. (n = 4 mice per group). i Micro CT scans of different groups in Horizontal, Coronal and Sagittal plane. j SYNPASE 3D reconstruction of mouse trachea. Red arrows indicating the stenosis site in (ik). The CT diagram of the area of tracheal stenosis measured by SYNPASE 3D and quantitative analysis of area in different groups(n = 4 mice per group). l Representative images of Masson staining in different groups. m Quantitative analysis of collagen area in different groups (n = 4 mice per group). n, o Representative tracheal immunofluorescence images and mean fluorescence intensity of αSMA(red) and COL1(green) in different groups (n = 3 mice per group). p GSEA analysis show IL6 jak STAT3 pathway enrichment in BAS + PBS group. q, r Representative tracheal immunofluorescence images and mean fluorescence intensity of P-STAT3(green) and IL6(red) in different groups (n = 3 mice per group). Scale bars in (d, g, n, q) indicates 200 μm and 50 μm. Scale bars in (l) indicate 50 μm. In (c), box bounds shows 25th and 75th percentiles, whiskers shows 25th percentiles minus 1.5*IQR to 75th percentiles plus 1.5*IQR and box center shows the median. Data are presented as the mean ± SEM. One-way ANOVA analysis followed by Tukey post hoc multi-comparison test was used in (h, k, m, o, r). One-way ANOVA analysis followed by Duncan multiple- range test was used in c. Source data are provided as a Source Data file.
Fig. 7
Fig. 7. dsDNA activates the STING pathway in macrophages thereby promoting fibroblast activation via the IL6-STAT3 axis.
a Gene ontology (GO) functional enrichment analysis showed that the enriched DNA damage and repair genes in the BAS group at 24 h after tracheal injury compare to control group (n = 3 mice per group). b Representative images of H&E staining and immunofluorescence of γH2AX(green) in mouse trachea(n = 3 mice per group). Scale bars indicate 50 μm in H&E staining images, 50 μm and 10 μm in immunofluorescence images. c Representative tracheal immunofluorescence images of dsDNA(pink), F4/80(red), P-STING (green), cGAS(yellow) in mouse trachea (n = 3 mice per group). Scale bars indicate 200 μm and 50 μm. d Schematic of use DECS to stimulate BMDMs. e Quantification analysis of dsDNA in cell culture supernatant in control group and DECS group (n = 4 independent experiments). f Representative images of AGAR gel electrophoresis of cell supernatants from control and DECS groups (n = 3 independent experiments). g, h Protein levels of phosphorylated STING in BMDM group stimulated with or without DECS, n = 3 independent experiments. i Schematic of BMDMs from WT mice stimulated by transfection of mouse tracheal DNA by lipo3000. j, k Protein levels of phosphorylated STING in the BMDM group stimulated with or without DNA (n = 3 independent experiments). l Representative immunofluorescence images of P-STING(green) in BMDM, Scale bars indicate 50 μm. m Quantitative analysis of relative Mean fluorescence intensity of P-STING (n = 5 independent experiments). o Protein levels of IL6 in the supernatant of BMDM group stimulated with or without DNA (n = 4 independent experiments). p mRNA levels of IL6 in control group, DNA stimulated group and DNA stimulated group treated with C176 (n = 4 independent experiments). q, r Representative tracheal immunofluorescence images of and quantitative analysis of mean fluorescence intensity of P-STAT3(green) and IL6(red) in the different groups (n = 3 mice per group). Scale bars indicate 200 μm and 20 μm. s Schematic diagram depicting in-vitro co-culture model. t, u Representative immunofluorescence images of and quantitative analysis of mean fluorescence intensity of P-STAT3(red) and αSMA(green) in fibroblasts (n = 3 independent experiments). Scale bars indicate 10 μm. Data are presented as the mean ± SEM. A two-sided student’s T-test was used in (e, h, k, o). One-way ANOVA analysis followed by Tukey post hoc multi-comparison test was used in (m, p, r, u). Source data are provided as a Source Data file.
Fig. 8
Fig. 8. Schematic diagram of tracheal dsDNA activating cGAS-STING pathway of macrophages to promote fibrosis in BAS.
Upon injury, dsDNA released from the tracheal epithelium activates the STING pathway in macrophages, leading to the release of the inflammatory cytokine IL-6. IL-6 then activates STAT3 signaling in fibroblasts, contributing to the fibrosis of granulation tissue. Treatment with the cGAS inhibitor RU.521, the STING inhibitor C176, or IL-6 neutralizing antibody alleviates granulation tissue fibrosis. Additionally, depletion of macrophages using bisphosphonate liposomes reduces the extent of fibrosis in the granulation tissue.

Similar articles

Cited by

References

    1. Oberg, C. L., Holden, V. K. & Channick, C. L. Benign Central Airway Obstruction. Semin Respir. Crit. Care Med.39, 731–746 (2018). - PubMed
    1. Piazza, C. et al. Long-term intubation and high rate of tracheostomy in COVID-19 patients might determine an unprecedented increase of airway stenoses: a call to action from the European Laryngological Society. Eur. Arch. Otorhinolaryngol.278, 1–7 (2021). - PMC - PubMed
    1. Guibert, N., Saka, H. & Dutau, H. Airway stenting: Technological advancements and its role in interventional pulmonology. Respirology25, 953–962 (2020). - PubMed
    1. Sun, K. et al. Long-term prognostic factors of clinical success after interventional bronchoscopy in patients with scarring central airway stenosis. BMC Pulm. Med.21, 73 (2021). - PMC - PubMed
    1. Chen, N. et al. Inhibitory effect of mitomycin C on proliferation of primary cultured fibroblasts from human airway granulation tissues. Respiration85, 500–504 (2013). - PubMed

Publication types

MeSH terms

LinkOut - more resources