. 2025 Jan 3;16(1):1.
doi: 10.1038/s41419-024-07306-0.

Endothelial-Ercc1 DNA repair deficiency provokes blood-brain barrier dysfunction

Affiliations

Endothelial-Ercc1 DNA repair deficiency provokes blood-brain barrier dysfunction

Cathrin E Hansen et al. Cell Death Dis. .

Abstract

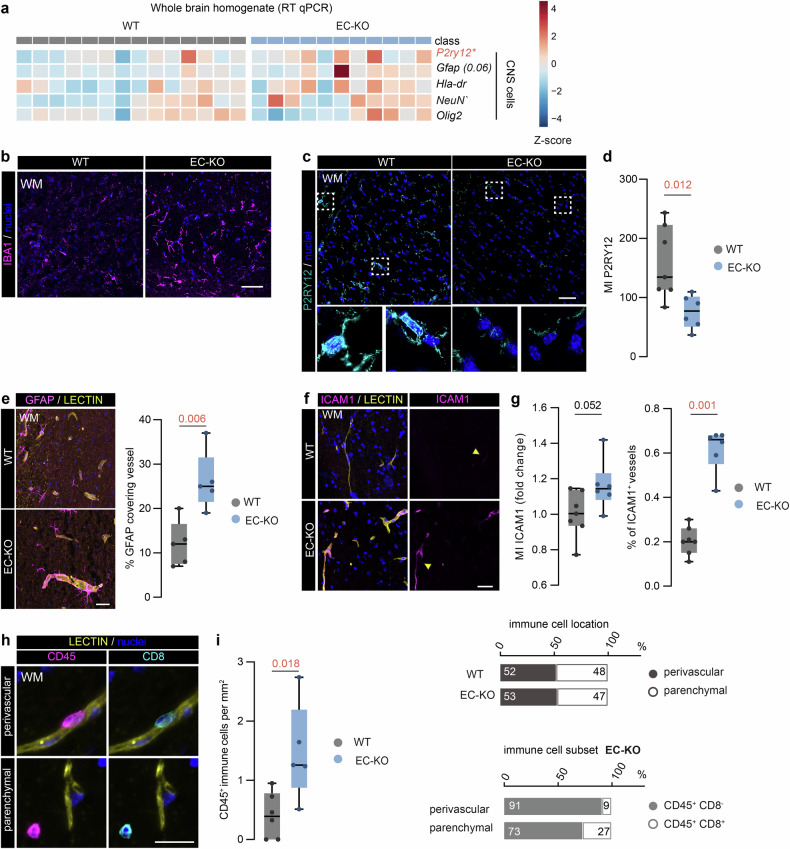
Aging of the brain vasculature plays a key role in the development of neurovascular and neurodegenerative diseases, thereby contributing to cognitive impairment. Among other factors, DNA damage strongly promotes cellular aging, however, the role of genomic instability in brain endothelial cells (EC) and its potential effect on brain homeostasis is still largely unclear. We here investigated how endothelial aging impacts blood-brain barrier (BBB) function by using excision repair cross complementation group 1 (ERCC1)-deficient human brain ECs and an EC-specific Ercc1 knock out (EC-KO) mouse model. In vitro, ERCC1-deficient brain ECs displayed increased senescence-associated secretory phenotype expression, reduced BBB integrity, and higher sprouting capacities due to an underlying dysregulation of the Dll4-Notch pathway. In line, EC-KO mice showed more P21+ cells, augmented expression of angiogenic markers, and a concomitant increase in the number of brain ECs and pericytes. Moreover, EC-KO mice displayed BBB leakage and enhanced cell adhesion molecule expression accompanied by peripheral immune cell infiltration into the brain. These findings were confined to the white matter, suggesting a regional susceptibility. Collectively, our results underline the role of endothelial aging as a driver of impaired BBB function, endothelial sprouting, and increased immune cell migration into the brain, thereby contributing to impaired brain homeostasis as observed during the aging process.


Conflict of interest statement

Competing interests: The authors declare no competing interests.

Figures

Fig. 1
Fig. 1. ERCC1 deficiency induces cellular aging phenotype and impairs BBB function in brain ECs.
a mRNA levels of ERCC1 in non-targeting control (NTC) and ERCC1 knock down (shERCC1) human brain ECs (hCMEC/D3), n = 4. b Nuclear fraction of ERCC1 in NTC and shERCC1 hCMEC/D3 evaluated by Western blot and GAPDH used as a reference protein. c Representative image of shERCC1 and NTC cells at passage one (P1) and four (P4) after virus transduction. Enlarged cells are encircled in black; scale bar: 200 µm. d Representative images of phosphorylated yH2AX in shERCC1 and NTC cells (yH2AX, white); scale bar: 25 µm. Yellow arrowheads indicate yH2AX foci and green arrowhead yH2AX pan-expression. e mRNA expression of senescent and SASP targets (P21, P16, IL-6, TNFA, IL-1B, ICAM1) in NTC and shERCC1 cells, n = 4. f mRNA expression of BBB transporters P-GP and MFSD2A in shERCC1 and NTC cells (n = 7). g mRNA expression of BBB junction marker CLND5, CDH5 and ZO-1 in shERCC1 and NTC cells (n = 7). Data have been normalized to GAPDH and presented as fold change to NTC values. Each data point represents the mean of a single experiment performed in triplicates. h Representative images of CLDN5 (white arrowheads indicate junctional immunoreactivity) and VE-cad in shERCC1 and NTC cells (scale bar: 25 µm). i Transendothelial electrical resistance shown over time and quantification of maximal resistance (box plot) in shERCC1 and NTC cells (n = 5,6). Data is shown as box plots with median ± quartiles; whiskers extend to minimum and maximum. Statistical comparison of two groups was performed using (paired) two-tailed Student’s t-test for normally distributed data, or the Wilcoxon-test/ Mann-Whitney test for non-normally distributed data. Exact p-values are reported and statistical significance is set at p < 0.05.
Fig. 2
Fig. 2. shERCC1 cells show enhanced endothelial migration and sprouting.
a mRNA expression of angiogenic markers VEGFA, SNAI2, DLL4, NOTCH1 and KDR in shERCC1 and NTC cells (n = 4). b Representative images of CD31 and DLL4 expression in shERCC1 and NTC cells. c Representative images of scratch-wound assay at t = 0 and t = 22 h in shERCC1 and NTC cells. The pink outline indicates the scratch borders. d Representative images of CD31 in sprouting shERCC1 and NTC cells with the manual analysis of sprouts marked in pink (scale bar: 150 µm). e Quantification of total number of sprouts, cumulative sprout length, and minimum sprout length per cell type (n = 16–20). Each dot represents a biological replicate and for the qPCR an average of technical triplicates, presented as box plots with median ± quartiles; whiskers extend to minimum and maximum. Statistical comparison of two groups was performed using (paired) two-tailed Student’s t test for normally distributed data, or the Mann–Whitney test for non-normally distributed data. Exact p-values are reported and statistical significance is set at p < 0.05.
Fig. 3
Fig. 3. EC-KO mice display increased number of P21+ cells and BBB transporters specifically in the white matter.
a Heatmap visualizes gene expression profile of WBH comparing EC-KO mice with WT mice. Target categories comprise senescence and BBB markers (n = 11–14). b Representative image of P21 (senescent cell identifier) and Lectin immunoreactivity in EC-KO mice brain tissue; yellow arrowhead indicates P21+ nucleus; white arrowhead indicates P21- nucleus (scale bar: 50 µm). c Quantification of total vascular P21+ cells per mm2 in WT and EC-KO (N = 6). d Representative images of MDR1A and MFSD2A reactivity in cortex (CRTX), white matter (WM), and hippocampus (HC) in WT and EC-KO brains (scale bar: 50 µm). e Quantification of mean fluorescent intensity (MI) of MDR1A and MFSD2A in Lectin+ area (transporter expression) and transporter area normalized to Lectin area (transporter density) (n = 6). f Representative images of CLDN5 reactivity in WM of WT and EC-KO mice (scale bar: 25 µm). g Quantification of CLDN5+ vessels (CLDN5+, Lectin+ objects) and MI of CLDN5 in Lectin+ area (n = 6–7). Data is shown as box plots with median ± quartiles; whiskers extend to minimum and maximum. All data have been statistically tested by unpaired student-t test with Welch’s correction when the variance of the groups was significantly different or Mann–Whitney test for non-parametric datasets. Exact p-values are reported and statistical significance is set at p < 0.05 (red).
Fig. 4
Fig. 4. EC-specific Ercc1 deficiency induces angiogenic markers and BBB leakage in vivo.
a mRNA expression of Cd31, Vegfa, Dll4, Notch1, Kdr, Snai2, Pdgfrb, and Angpt2 in WBH are plotted as box plots to visualize effect size in EC-KO and WT mice (n = 11–14). b Representative image of COLLAGEN IV and SNAI2 immunoreactivity in the WM of EC-KO and WT mice. c Representative images of LAMININ, PDGFRβ and αSMA immunoreactivity of WM brain tissue in WT and EC-KO mice; white arrowheads indicate αSMA+ vessels (arteriole, upper panel), yellow arrowheads indicate PDGFRβ+, αSMA- vessels (capillary, lower panel) (scale bar: 50 µm). d, e Quantification of capillary ECs and capillary density as well as pericyte number and coverage in EC-KO and WT mice. f Representative images of IgG immunoreactivity in EC-KO and WT mice and semi-quantification of IgG+ area (n = 5–10; scale bar: 20 µm). Data is shown as box plots with median ± quartiles; whiskers extend to minimum and maximum. All data have been statistically tested by unpaired Student’s t test with Welch’s correction when the variance of the groups was significantly different or Mann–Whitney test for non-parametric datasets. Exact p-values are reported and statistical significance is set at p < 0.05.
Fig. 5
Fig. 5. Enhanced vascular ICAM1 expression and immune cell infiltration in the white matter of EC-KO mice.
a Multiplex qPCR mRNA on WBH comparing EC-KO and WT mice (n = 11–14). b Representative images of IBA1 immunoreactivity in WM of EC-KO and WT mice (scale bar: 50 µm). c Representative images of P2RY12 immunoreactivity in WM of EC-KO and WT mice (scale bar: 50 µm). d Quantification of P2RY12 MI in EC-KO and WT mice (n = 6–7). e Representative images and quantification of GFAP+ area covering the vessel (% GFAP in Lectin+ area) in WM of EC-KO and WT mice (scale bar: 25 µm). f Representative images of ICAM1+vessels in EC-KO and WT mice (scale bar: 30 µm). g Quantification of ICAM1+ vessels and vascular ICAM1 expression in both WT and EC-KO WM brain tissue (n = 5–7). h Representative images of CD45, CD8, and Lectin immunoreactivity presenting both perivascular (top panel) and parenchymal (lower panel) location of peripheral immune cells (scale bar: 20 µm). i Quantification of CD45+ immune cells per mm2 in EC-KO and WT mice. Data is shown as box plots with median ± quartiles; whiskers extend to minimum and maximum. All data have been statistically tested by unpaired Student’s t test with Welch’s correction when the variance of the groups was significantly different or Mann–Whitney test for non-parametric datasets. Exact p-values are reported and statistical significance is set at p < 0.05 (red).

References

    1. Kadry H, Noorani B, Cucullo L. A blood–brain barrier overview on structure, function, impairment, and biomarkers of integrity. Fluids Barriers CNS. 2020;17:69. - PMC - PubMed
    1. Han L, Jiang C. Evolution of blood-brain barrier in brain diseases and related systemic nanoscale brain-targeting drug delivery strategies. Acta Pharm Sin B. 2021;11:2306–25. - PMC - PubMed
    1. Donato AJ, Magerko KA, Lawson BR, Durrant JR, Lesniewski LA, Seals DR. SIRT-1 and vascular endothelial dysfunction with ageing in mice and humans. J Physiol. 2011;589:4545–54. - PMC - PubMed
    1. Banks WA, Reed MJ, Logsdon AF, Rhea EM, Erickson MA. Healthy aging and the blood–brain barrier. Nat Aging. 2021;1:243–54. - PMC - PubMed
    1. Tarantini S, Tran CHT, Gordon GR, Ungvari Z, Csiszar A. Impaired neurovascular coupling in aging and Alzheimer’s disease: Contribution of astrocyte dysfunction and endothelial impairment to cognitive decline. Exp Gerontol. 2017;94:52–8. - PMC - PubMed

LinkOut - more resources