. 2025 Jan 3;16(1):353.
doi: 10.1038/s41467-024-54132-1.

Therapy-induced senescent cancer cells contribute to cancer progression by promoting ribophorin 1-dependent PD-L1 upregulation

Affiliations

Therapy-induced senescent cancer cells contribute to cancer progression by promoting ribophorin 1-dependent PD-L1 upregulation

Hyun Jung Hwang et al. Nat Commun. .

Abstract

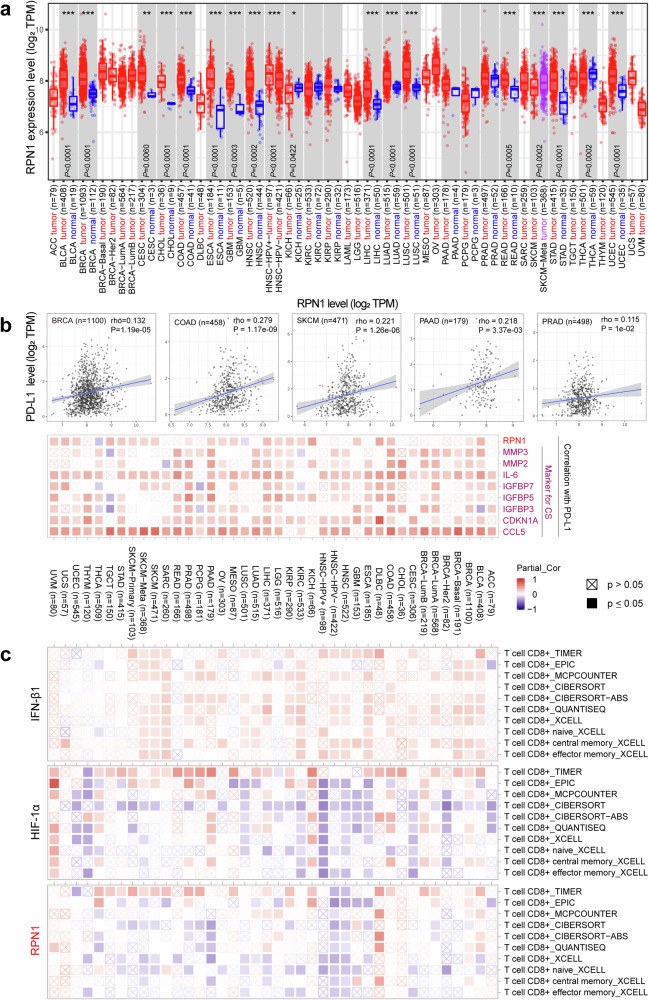
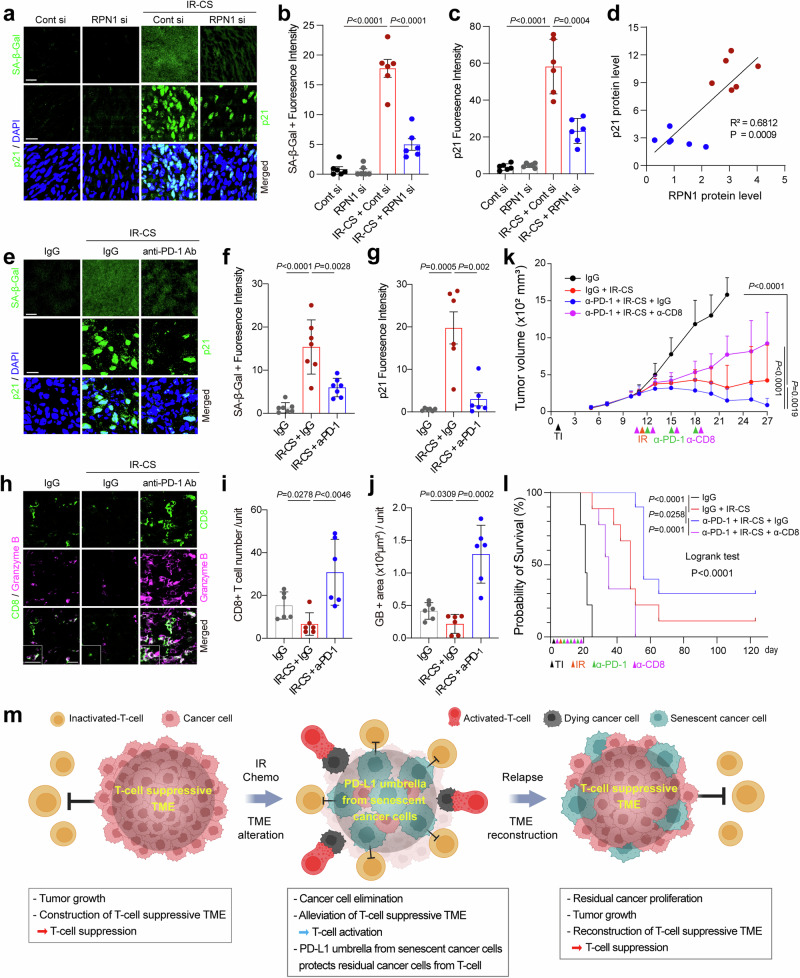
Conventional chemotherapy- and radiotherapy-induced cancer senescence, which is characterized by poor proliferation, drug resistance, and senescence-associated secretory phenotype, has gained attention as contributing to cancer relapse and the development of an immunosuppressive tumor microenvironment. However, the association between cancer senescence and anti-tumor immunity is not fully understood. Here, we demonstrate that senescent cancer cells increase the level of PD-L1 by promoting its transcription and glycosylation. We identify ribophorin 1 as a key regulator of PD-L1 glycosylation during cancer senescence. Ribophorin 1 depletion reduces this elevated level of PD-L1 through the ER-lysosome-associated degradation pathway, thereby increasing the susceptibility of senescent cancer cells to T-cell-mediated killing. Consistently, ribophorin 1 depletion suppresses tumor growth by decreasing PD-L1 levels and boosting cytotoxic T lymphocyte activity in male mice. Moreover, ribophorin 1-targeted or anti-PD-1 therapy reduces the number of senescent cancer cells in irradiated tumors and suppresses cancer recurrence through the activation of cytotoxic T lymphocytes. These results provide crucial insights into how senescent cancer cells can escape T-cell immunity following cancer treatment and thereby contribute to cancer recurrence. Our findings also highlight the therapeutic promise of targeting senescent cancer cells for cancer treatment.


Conflict of interest statement

Competing interests: The authors declare no competing interests.

Figures

Fig. 1
Fig. 1. Cancer cell senescence decreases T-cell susceptibility by increasing PD-L1.
a OT-cell infiltration assay in Control (Cont) or IR-induced senescent B16/F10-OVA melanoma spheroids (IR-CS). OT-cells and cancer spheroids are represented by green and red fluorescence, respectively (right). Infiltrated OT-cells in B16/F10-OVA melanoma spheroids were quantified (left). Scale bar: 200 µm. Mean ± SD of n = 3 independent samples. Two-sided Student’s t-test. b Syngeneic OT-cell killing assay of control or IR-induced Senescent B16/F10-OVA melanoma cells. Cancer cells were stained red, apoptotic cells were displayed by fluorescence of caspase-3 activity (green) (right). The percentage of apoptotic cells was quantified (left). Scale bar: 200 µm. Mean ± SD of n = 3 independent samples. Two-sided Student’s t-test. c Immunofluorescence staining of the B16/F10-OVA melanoma spheroid using an anti-PD-L1 antibody. Scale bar: 50 µm. Representative images of n = 3 independent replicates df Western blot showing the protein levels of PD-L1 in IR-induced H460 (d), Doxorubicin (50 ng/ml)-induced (Doxo) H460 (e), and PTEN loss-induced H460 (f). Representative Western blots of n = 3 independent replicates. g PD-L1 levels in various types of senescent cancer cells induced by IR. Representative Western blots of n = 3 independent replicates. h qRT-PCR analysis of PD-L1 mRNA levels in IR-induced senescent H460 cells. Mean ± SD of n = 3 independent samples. Two-sided Student’s t-test. i HEK293T cells co-transfected of pGIPz-hPD-L1sh and pCI-neo-PD-L1 Flag vectors were treated with IR. Created in BioRender. Cha, J. (2024) BioRender.com/i97z560. Representative Western blots of n = 3 independent replicates. Mean ± SD of n = 3 independent samples. Two-sided Student’s t-test. j CHX chase assay showing the degradation of exogenous PD-L1 in Cont or IR-induced senescent HEK293T cells. Western blot (upper) and the quantification (bottom) showing exogenous PD-L1 protein level. Representative Western blots of n = 3 independent replicates. Mean ± SD of n = 3 independent samples. Two-way ANOVA-Tukey multiple comparison test. Source data are provided as a Source Data file.
Fig. 2
Fig. 2. Cancer senescence could influence glycosylation, which is crucial for PD-L1 stabilization and membrane transport.
a Immunofluorescence staining of PD-L1 and markers of ER (HSP90B1) and Golgi (cis, GM130) in Control (Cont) or IR-induced cancer senescence (IR-CS). Nuclei were counterstained with DAPI. Scale bar: 10 µm. Representative images of n = 3 independent replicates. b Cell surface levels of PD-L1 were analyzed by flow cytometry in IR-induced senescent H460 cells. The gating strategies are provided in Supplementary Fig. 13a. c PD-1 binding assay: representative images showing the binding of green fluorescence-labeled PD-1/Fc protein on IR-induced senescent H460 cells. Scale bar: 50 µm. Representative images of n = 3 independent replicates. d A Venn diagram was created to compare the N-glycosyltransferase list obtained from our microarray data in this study with the list of N-glycosyltransferases known to interact with PD-L1. e Identification of N-glycosylation-related enzymes that are differentially expressed in IR-induced senescent H460 cancer cells. f Validation of increased mRNA expressions of N-glycosylation-related enzymes in IR-induced senescent H460 cells. Mean ± SD of n = 3 independent samples. One-way ANOVA-Tukey multiple comparison test. g qRT-PCR analysis of PD-L1 mRNA levels in IR-induced senescent H460 cells, which were transfected with each indicated siRNAs. Mean ± SD of n = 3 independent samples. One-way ANOVA-Tukey multiple comparison test. h Immunoblot analysis of PD-L1 levels in IR-induced senescent cancer cells, which were transfected with each indicated siRNAs. Representative immunoblots of n = 3 independent replicates. Statistical significance is represented as means ± SD. Source data are provided as a Source Data file.
Fig. 3
Fig. 3. In silico TCGA analysis indicates that RPN1 may play an important role in tumorigenesis and anti-tumor immunity.
a RPN1 expression levels between tumor and tumor-matched normal tissues in all TCGA tumors. The box plots display the distribution of expression levels in tumor (red) and adjacent normal (blue) tissues. The center line in each box plot represents the median, the bounds of the box represent the first (25th percentile) and third quartiles (75th percentile), and the whiskers extend to 1.5 times the interquartile range (IQR). Outliers are displayed as individual points. Statistical significance, calculated by the Wilcoxon test, is indicated by stars (*p-value < 0.05; **p-value < 0.01; ***p-value < 0.001). b Spearman rank correlation analysis to assess the correlation between RPN1 and PD-L1 mRNA levels, as well as between RPN1 and cancer senescence markers across all TCGA tumor samples. c Heatmap table showing multiple associations between IFN-β, HIF-1α, or RPN1 and CD8+ tumor-infiltrating T-cell levels, estimated by six algorithms across cancer types in the TCGA database. Each cell in the heatmap indicates the statistical significance of the correlation coefficient based on Spearman’s correlation analysis. Red: statistically significant positive correlation; blue: statistically significant negative correlation.
Fig. 4
Fig. 4. RPN1 is essential for N-glycosylation of PD-L1 increased by cancer senescence.
a Western blot showing the effect of RPN1 on N-glycosylation of PD-L1. A stable H460 cell line expressing both WT and 4NQ PD-L1-Flag was transfected with either control siRNA (Cont si) or RPN1 siRNA (RPN1 si) and then subjected to IR-induced cancer senescence conditions. Three days after IR treatment, the stable cell lines expressing WT and 4NQ PD-L1-Flag were treated with or without tunicamycin (TM, 5 µg/ml) and chloroquine (CQ, 40 µg/ml) for 12 h. Representative Western blots of n = 3 independent replicates. b The extracted compound chromatogram of glycans detected in PD-L1 is presented. Glycan class: Oligomannose (green); undecorated complex/hybrid (blue); fucosylated complex/hybrid (purple); sialylated complex/hybrid (orange); and fucosylated/sialylated complex/hybrid (red). Representative chromatogram of n = 3 independent replicates. cg Detailed analysis of extracted compound chromatogram based on glycan structure types (c) Oligomannose, (d) undecorated Complex/Hybrid type, (e) Fucosylated Complex/Hybrid type, (f) Sialylated Complex/Hybrid type, (g) Fucosylated and Sialylated Complex/Hybrid type. The representative structure for each glycan type is illustrated on the right side of each graph. Mean ± SD of n = 3 independent biological samples. One-sided Student’s t-test. Source data are provided as a Source Data file.
Fig. 5
Fig. 5. RPN1 plays a crucial role in enabling senescent cancer cells to evade immune surveillance by elevating PD-L1 levels.
a H460 cells transfected with three different RPN1 siRNAs prior to IR exposure were subjected to SA-β-Gal staining. Scale bar: 50 µm. Mean ± SD of n = 3 independent samples. One-way ANOVA-Tukey multiple comparison test. Representative images of n = 3 independent replicates. b Immunoblot analysis of Control (Cont) or IR-induced senescent H460 cells (IR-CS), which were transfected with Cont si or three different RPN1 siRNAs (#1-3). Representative immunoblots of n = 3 independent replicates. c Cells were transfected with either Cont siRNA (Cont si) or RPN1 siRNA (RPN1 si), followed by treatment with Doxorubicin (50 ng/ml for 4 days). d H460 cells transfected with PTEN siRNA (PTEN si) underwent further transfection with either Cont si or RPN1 si. e Immunoblot analysis of PD-L1 levels in lung, breast and colon cancer cells. f Western blot showing PD-L1 levels in H1975 and BT549 cells transfected with either Cont si or RPN1 si. g Immunoblot analysis of PD-L1 in H460, A549, and HCC827 cells transfected with either mock vectors or RPN1-HA vectors. cg Representative immunoblots of n = 3 independent replicates. h,i Immunofluorescence of PD-L1 and markers of ER (HSP90B1) (h) and Golgi (cis, GM130) (i) in IR-induced senescent H460 cells transfected with either Cont si or RPN1 si. Nuclei were counterstained with DAPI. Scale bar: 10 µm. Representative images of n = 3 independent replicates. j Median fluorescence intensity (MFI) of membrane-bound PD-L1 in IR-induced senescent H460 cells transfected with either Cont si or RPN1 si were analyzed by flow cytometry. Mean ± SD of n = 3 independent samples. One-way ANOVA-Tukey multiple comparison test. The gating strategies are provided in Supplementary Fig. 13b. k H460 cells transfected with either Cont si or RPN1 si were exposed to IR. On day 4 post-IR, the binding of green fluorescence-labeled PD-1/Fc protein was measured in each si-treated/irradiated cell group. Mean ± SD of n = 3 independent samples. One-way ANOVA-Tukey multiple comparison test. l B16/F10-OVA melanoma cells transfected with either Cont si or RPN1 si were allowed to form spheroids for 3 days and then exposed to IR. On day 4 post-IR, activated OT-cells were co-cultured with B16/F10-OVA melanoma spheroids. The next day, the number of infiltrated OT-cells in the spheroids was quantified. Mean ± SD of n = 3 independent samples. One-way ANOVA-Tukey multiple comparison test. m B16/F10-OVA melanoma cells transfected with either Cont si or RPN1 si prior to IR were co-cultured with OT-cells. After 48 hours, the quantitative ratios of dead cells to total cells were measured by the fluorescence of caspase-3 activity. Mean ± SD of n = 3 independent samples. One-way ANOVA-Tukey multiple comparison test. Source data are provided as a Source Data file.
Fig. 6
Fig. 6. RPN1 modulates PD-L1 degradation through the ERLAD pathways in senescent cancer cells.
a CHX chase assay showing the degradation of PD-L1 protein in Cont si or RPN1 si-transfected H460 cells after exposure to IR. Western blot (top) and the quantification (bottom) showing PD-L1 protein level. Representative Western blots of n = 3 independent replicates. Means ± SD of n = 3 independent samples. Two-way ANOVA-Tukey multiple comparison test. b Western blot showing the effect of RPN1 on PD-L1 protein levels in Cont si or RPN1 si-transfected cells after treatment with MG132 (20 μM), a proteasomal degradation inhibitor, or CQ (40 μg/ml), a lysosomal inhibitor. Representative Western blots of n = 3 independent replicates. c Western blot showing the depletion effects of FAM134B, Rab5, and Rab11 on PD-L1 protein levels in Cont si or RPN1 si-treated cells after exposure to IR. Representative Western blots of n = 3 independent replicates. df Immunofluorescence showing the colocalization of PD-L1 with FAM134B (d), LC3B (e), or LAMP1 (f) in cells treated with CQ after transfection with Cont si or RPN1 si. Cell nuclei were counterstained with DAPI. Scale bar: 10 µm. Representative images of n = 3 independent replicates. g A model illustrating the regulatory mechanism of PD-L1 through ERLAD pathway during cancer senescence. Senescent cancer cells have elevated expression of the glycosyltransferase RPN1, facilitating the complete glycosylation of PD-L1. This increases the levels of membrane-bound PD-L1 by enhancing the stability of PD-L1. RPN1 depletion induces incomplete glycosylation of PD-L1, leading to increased degradation by ERLAD pathway, resulting in lower overall PD-L1 levels. Created in BioRender. Kang, D. (2023) BioRender.com/e62x895. Source data are provided as a Source Data file.
Fig. 7
Fig. 7. RPN1 might facilitate cancer recurrence by inhibiting T-cell immunity through PD-L1 in an irradiated tumor model.
a CT26 cancer cells transfected with either Cont si or RPN1 si were injected into BALB/c mice on day 0 (TI: treatment initiation). On day 10, the mice received a 12 Gy IR. Intratumoral siRNA transfection was carried out as described. The tumor size (mm³) was measured at the indicated times. Data is presented as means ± SD, 6 mice per group. Two-way ANOVA with Tukey’s multiple comparison test. b,c Pictures of excised (b) and the average weights (c) of tumors harvested at the endpoint. Mean ± SD of n = 6 mice per group. Two-sided Student’s t-test. d Immunofluorescence staining of tumor sections for PD-L1 and RPN1, with DAPI used as a nuclear counterstain. Representative images from tumor sections in each group. Scale bar: 20 µm. e Relative protein levels of RPN1 and PD-L1 in tumor tissue were quantified from the results in Supplementary Fig. 8 using ImageJ. Mean ± SD of n = 6 mice per group. Two-sided Student’s t-test. f Correlation analysis between PD-L1 and RPN1 expression in Supplementary Fig. 8. Mean ± SD of n = 6 mice per group. Spearman’s correlation test. g Representative images of immunostaining of CD8, Granzyme B, and caspase-3 in tumor sections with DAPI as nuclear counterstain. Scale bar: 20 µm. hj Quantitative analysis of CD8 (h), Granzyme B (GB) (i), and cleaved caspase-3 (CCA3) (j) using ImageJ. Data is shown as means ± SD, n = 6 mice per group. Two-sided Student’s t-test. Analysis unit = 12,945 μm2. k, l On day 0 (Treatment Initiation, TI), BALB/c mice were inoculated with CT26 cancer cells transfected with either control siRNA (Cont si) or RPN1 siRNA (RPN1 si), followed by a 12 Gy dose of IR on day 10. Intratumoral siRNA transfection and injection of antibodies against CD8 + T cells (using clone 2.43) were conducted as described in the Methods section. Data are presented as means ± SD, with 6 mice per group. Tumor size (in mm³) was measured at specified intervals. Two-way ANOVA with Tukey’s multiple comparison test (k). Survival curves for each treatment group are provided. Log-rank test (l). Source data are provided as a Source Data file.
Fig. 8
Fig. 8. The elimination of therapy-induced senescent cancer cells through RPN1 depletion or PD-L1/PD-1-targeted therapy can enhance therapeutic efficacy by increasing CTL activity.
ad Tumor tissues from Fig. 6 were used for analysis. (a) Representative images of SA-β-Gal staining and p21 immunostaining in tumor tissues. DAPI was used for nuclear counterstaining. Scale bar: 20 µm (top), 50 µm (bottom). b,c (b) Quantification of SA-β-Gal staining intensity and (c) p21 protein levels in tumor sections using ImageJ. Data are presented as means ± SD; n = 6 mice per group. Analysis unit: (b) 317,850 μm2, (c) 77,428 μm2. Two-sided Student’s t-test. d Correlation analysis between p21 and RPN1 shown in Supplementary Fig. 10. Mean ± SD of n = 6 mice per group. Spearman’s correlation test. ej CT26 cancer cells were inoculated into BALB/c mice on day 1 (TI). Mice were irradiated with 12 Gy IR on day 13 and treated with 200 µg anti-PD-1 antibody (ICB) per mouse through intraperitoneal (IP) injection for 9 mice per group. The results of tumor growth are presented in Supplementary Fig. 12. e Representative images of SA-β-Gal staining and p21 immunostaining in tumor sections. DAPI was used for nuclear counterstaining. Scale bar: 20 µm (top), 50 µm (bottom). f, g Quantification of SA-β-Gal staining intensity (f) and p21 protein levels (g) in tumor sections from Supplementary Fig. 12 using ImageJ. Data are presented as means ± SD; (f) n = 7 mice per group, (g) n = 6 mice per group. Analysis unit: (f) 317,850 μm2, (g) 77,428 μm2. Two-sided Student’s t-test. h Representative images of immunostaining of CD8, Granzyme B, and caspase-3 in tumor sections with DAPI as nuclear counterstain. Scale bar: 20 µm. i, j Quantitative analysis of CD8 (i), and Granzyme B (GB) (j) using ImageJ. Data is shown as means ± SD, n = 6 mice per group. Analysis unit: 12,945 μm2. Two-sided Student’s t-test. k, l CT26 cancer cells were inoculated into BALB/c mice on day 1 (TI). The mice were treated with 250 µg of anti-CD8 antibody on day 10, administered once every three days for a total of four doses. On day 11, the mice were irradiated with 12 Gy IR and subsequently treated with 200 µg of anti-PD-1 antibody (ICB) per mouse through IP injection (n = 9 mice per group). k Tumor size (in mm³) was measured at the indicated times. Two-way ANOVA with Tukey’s multiple comparison test. l Survival rates for each group until 123 days. Log-rank test. m A model showing how senescent cancer cells suppress anti-tumor immunity by modulating PD-L1 levels, potentially leading to cancer relapse. In the absence of T-cell suppressive TME with tumor volume reduction post conventional treatments, senescent cancer cells may contribute to potential cancer recurrence by acting as primary protectors of residual cancer cells by providing a PD-L1 umbrella against attack by activated T cells. Created in BioRender. Cha, J. (2023) BioRender.com/n74o053. Source data are provided as a Source Data file.

References

    1. Wang, L., Lankhorst, L. & Bernards, R. Exploiting senescence for the treatment of cancer. Nat. Rev. Cancer22, 340–355 (2022). - PubMed
    1. Park, S. S., Choi, Y. W., Kim, J. H., Kim, H. S. & Park, T. J. Senescent tumor cells: an overlooked adversary in the battle against cancer. Exp. Mol. Med53, 1834–1841 (2021). - PMC - PubMed
    1. Wang, B., Kohli, J. & Demaria, M. Senescent cells in cancer therapy: friends or foes? Trends Cancer6, 838–857 (2020). - PubMed
    1. Coppe, J. P., Desprez, P. Y., Krtolica, A. & Campisi, J. The senescence-associated secretory phenotype: the dark side of tumor suppression. Annu Rev. Pathol.5, 99–118 (2010). - PMC - PubMed
    1. Takasugi, M., Yoshida, Y. & Ohtani, N. Cellular senescence and the tumour microenvironment. Mol. Oncol.16, 3333–3351 (2022). - PMC - PubMed

Publication types

Associated data

LinkOut - more resources