. 2025 Jan 3;16(1):372.
doi: 10.1038/s41467-024-55440-2.

A cell atlas of the human fallopian tube throughout the menstrual cycle and menopause

Affiliations

A cell atlas of the human fallopian tube throughout the menstrual cycle and menopause

Melanie Weigert et al. Nat Commun. .

Abstract

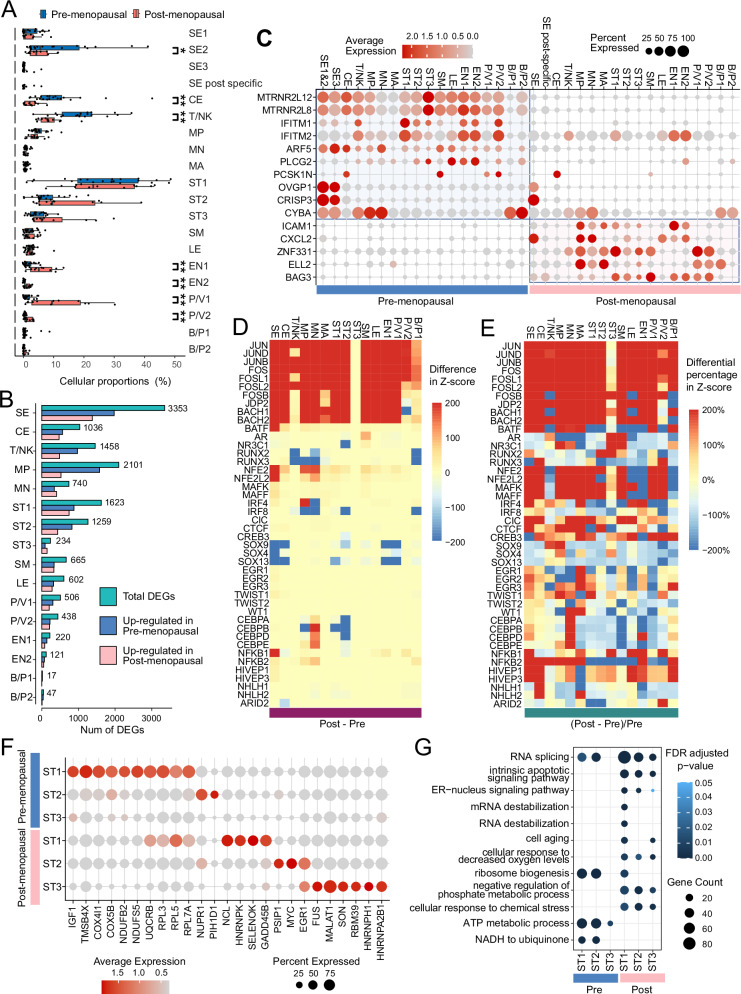
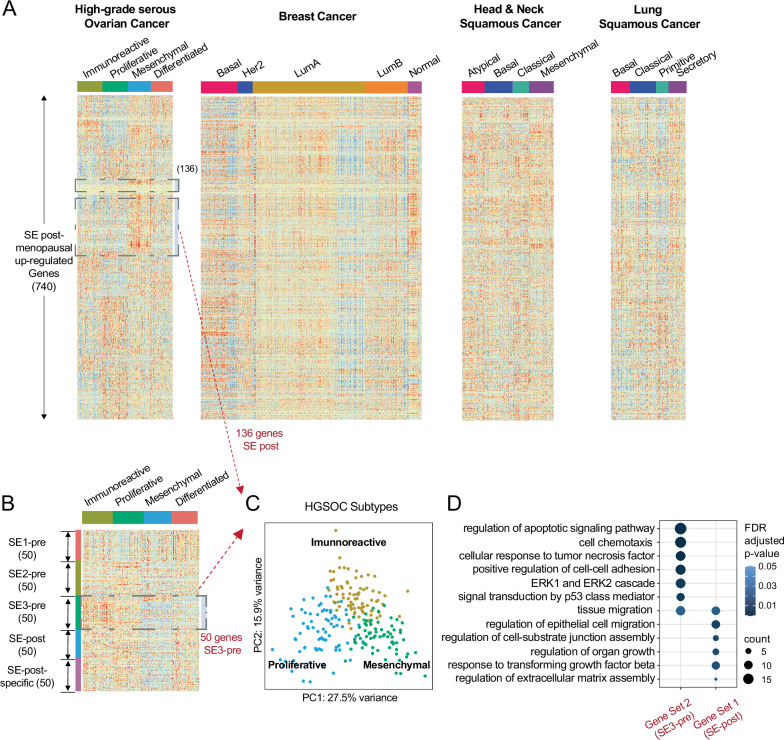
The fallopian tube undergoes extensive molecular changes during the menstrual cycle and menopause. We use single-cell RNA and ATAC sequencing to construct a comprehensive cell atlas of healthy human fallopian tubes during the menstrual cycle and menopause. Our scRNA-seq comparison of 85,107 pre- and 46,111 post-menopausal fallopian tube cells reveals substantial shifts in cell type frequencies, gene expression, transcription factor activity, and cell-to-cell communications during menopause and menstrual cycle. Menstrual cycle dependent hormonal changes regulate distinct molecular states in fallopian tube secretory epithelial cells. Postmenopausal fallopian tubes show high chromatin accessibility in transcription factors associated with aging such as Jun, Fos, and BACH1/2, while hormone receptors were generally downregulated, a small proportion of secretory epithelial cells had high expression of ESR2, IGF1R, and LEPR. While a pre-menopausal secretory epithelial gene cluster is enriched in the immunoreactive molecular subtype, a subset of genes expressed in post-menopausal secretory epithelial cells show enrichment in the mesenchymal molecular type of high-grade serous ovarian cancer.


Conflict of interest statement

Competing interests: E.L. receives research funding to study ovarian cancer from Arsenal Bioscience and AbbVie through the University of Chicago unrelated to this work. All other authors declare no competing interest.

Figures

Fig. 1
Fig. 1. Study design and fallopian tube histology.
A Pre-menopausal fallopian tube (FT) fimbria (F; n = 10), ampulla (A; n = 10) and isthmus (I; n = 5) were characterized using scATAC-seq and scRNA-seq. To study the cellular and molecular changes driven by the menstrual cycle and by menopause in the normal human fallopian tube both datasets were integrated. B Representative hematoxylin and eosin (H&E) staining of normal pre-menopausal FT fimbria. Dashed lines and roman numerals indicate principal cell compartments defined by H&E in the FT. Black lines indicate stretches of ciliated (1) or secretory (2) epithelial cells, and (3) stromal cells. Different cell types identified in the FT by H&E are at higher magnification. Specific cell types are marked with circles or by an arrowhead and annotated by numbers. Created in BioRender. Weigert, M. (2024) BioRender.com/s53z837.
Fig. 2
Fig. 2. Cellular composition of the normal pre-menopausal fallopian tube.
A Canonical cell types and subtypes found in the ampulla (n = 10) and fimbria (n = 10) of the normal pre-menopausal fallopian tube. The UMAP plot visualizes the 19 cell clusters identified using scRNA-seq. B Dot plot showing normalized gene expression levels of canonical marker genes associated with common cell types identified in the dataset (scRNA-seq). C The UMAP plot visualizing the 16 cell clusters identified in pre-menopausal ampulla (n = 5) and fimbria (n = 5) using scATAC-seq. Cell type labels were transferred from scRNA-seq data and match abbreviations described in (A). Cell types SE3, EN2 and B/P2 were not identified in this analysis. D Heatmap showing transcription factor (TF) activity enrichment by cell clusters based on scATAC-seq data. Abbreviations: SE1-3 = 3 subtypes of secretory epithelial cells; CE = ciliated epithelial cells; T/NK = T and natural killer cells; MP = macrophages; MN = monocytes; MA = mast cells; ST1-3 = 3 subtypes of stromal cells; SM = smooth muscle cells; LE = lymphatic endothelial cells; EN1-2 = 2 subtypes of endothelial cells; P/V1-2 = 2 subtypes of pericytes and vascular smooth muscle cells; B/P1-2 = 2 subtypes of B cells and plasma B cells.
Fig. 3
Fig. 3. Menopause changes the cellular composition and gene expression profiles of cell types found in the normal human fallopian tube.
A Differences in cellular composition between pre- (n = 10) and post-menopausal (n = 7) women in percentages for combined anatomical sites (ampulla and fimbria). Data are represented using a boxplot showing the median and first and third quantile. Two-sided t-test. SE2 p-value < 0.045, CE p-value < 0.00059, T/NK p-value < 0.000049, EN1 p-value < 0.0059, EN2 p-value < 0.0029, P/V1 p-value < 0.0058, P/V2 p-value < 0.014. B Number of differentially expressed genes in pre- and post-menopausal women by cell clusters using scRNA-seq. Number of DEGs is for ampulla and fimbria combined. C Dot plot showing normalized gene expression levels of selected, differentially expressed genes specific to menopausal status by individual cell clusters (scRNA-seq). D Heatmap showing absolute differences in selected transcription factor (TF) activities by cell clusters using scATAC-seq. The z-score difference is calculated by directly subtracting the average pre-menopausal TF activity from the post-menopausal activity (Post - Pre). E Heatmap showing relative changes in selected transcription factor (TF) activities by cell clusters using scATAC-seq data. The relative changes are expressed as a percentage change from the pre-menopausal levels ((Post–Pre) / Pre * 100). F Dot plot showing normalized gene expression levels of selected genes in pre- and postmenopausal ST subtypes (scRNA-seq). G Dot plot showing the enrichment of selected gene ontology (GO) terms for each ST subtype in pre- and post-menopausal women based on scRNA-seq data. FDR-corrected p-value are shown.
Fig. 4
Fig. 4. Menopause induces significant changes in gene regulation and -expression in epithelial cells.
A Pre- and post-menopausal SE cells identified using UMAP profiling. The pre-menopausal fallopian tube (n = 10) is characterized by three SE subtypes (SE1 pre, SE2 pre, and SE3 pre), while the post-menopausal fallopian tube (n = 7) is characterized by two SE subtypes (SE post and SE post-specific). The number of cells identified in each subtype is shown in the panel (scRNA-seq). B Dot plot showing normalized gene expression levels of selected markers associated with proliferation, stemness, and PEG-cells in pre- and postmenopausal SE subtypes based on scRNA-seq data. C Dot plot showing normalized gene expression levels of hormone receptors in pre- and postmenopausal SE subtypes based on scRNA-seq data. D Heatmap showing the average expression of target genes in SE pre- and post-menopausal subtypes at the individual sample level based on scRNA-seq data (ampulla and fimbria). E Heatmap showing the absolute transcription factor activities in SE subtypes using the scATAC-seq data. F Heatmap showing relative transcription factor activities in SE subtypes using scATAC-seq data. The Z-score is obtained by centering and re-scaling across SE subtypes for each TF. G Dot-plot showing the enrichment of selected gene ontology (GO) terms for each SE subtype based on scRNA-seq. FDR-corrected p-values are shown. H Spatial transcriptomics profiling of normal pre-menopausal fallopian tube fimbria (n = 1) using 10x Genomics Visium. Pre-menopausal fallopian tube fimbria were analyzed for spatial expression of KRT7, KRT15, TUBB, OVGP1 and INSR1.
Fig. 5
Fig. 5. Epithelial cells undergo significant cellular and molecular changes during the proliferative and secretory phases of the menstrual cycle.
A Differences in cellular composition between the proliferative- (n = 4) and secretory phases (n = 3) of the menstrual cycle based on scRNA-seq data (two-sided t-test). Data are represented using a boxplot showing the median and first and third quantile. N describes the number of patients/ samples for each respective menstrual cycle phase. SE1 p-value < 0.0018, SE2 p-value < 0.0035. B Representative OVGP1 immunohistochemistry in the fallopian tube of patients in the proliferative phase (n = 2) and in the secretory phase (n = 2). C Scatter plot comparing gene expression levels of pre-menopausal SE1 (secretory phase) and SE2 cells (proliferative phase) using pseudo-bulk RNA analysis. D Volcano plot derived from pseudo bulk analysis. The volcano plot shows the differential gene expression analysis of genes expressed in SE cells (SE 1/2/3-pre) based on the proliferative and secretory phases. E Number of differentially expressed genes between the proliferative- and secretory phases of the menstrual cycle by cell clusters based on scRNA-seq data. F Dot plot showing normalized scRNA-seq derived gene expression levels of selected genes that differ in the proliferative and secretory phase in ST subtypes. G Representative immunofluorescence staining of IGF1 and IGF2 in primary human stromal and epithelial fallopian cell co-culture of one patient (n = 3). The co-culture was stimulated for 8 h with estrogen (E4) or progesterone (P4). IGF1 protein in green, IGF2 protein in red and nuclei/ DAPI in blue. White dotted lines mark epithelial cells while white stars mark stromal cells. H Ligand-receptor interactions, detected by CellPhoneDB, between SE and ST subtypes (left) and between SE cells (right) separated by the menstrual phase using scRNA-seq data. I RNA velocity analysis of SE1- and SE2-pre cells. Arrows indicate the location of the estimated future cell state. Long vectors mark rapid transition events (i.e., large changes in gene expression), while short arrows indicate homeostasis. J Median latent time for pre-menopausal SE cells during the proliferative- and secretory phase of the menstrual cycle, highlighting temporal positions for SE1- and SE2-pre.
Fig. 6
Fig. 6. Characterization of molecular subtypes of ovarian cancers using secretory epithelial cell markers.
A Heatmaps showing the top 740 up-regulated genes in our post-menopausal SE cells across the various molecular subtypes of high-grade serous ovarian cancer, breast cancer (BRCA), head and neck squamous cell carcinoma (HNSC), and lung squamous cell carcinoma (LUSC) as described by TCGA. B Heatmap showing the top 50 expressed markers in pre- and post-menopausal SE subtypes across the ovarian cancer molecular subtypes as identified by TCGA. C Principal component analysis plot for TCGA samples (n = 304) using 186 SE markers (SE3; n = 50 genes, and SE post-menopausal; n = 136 genes). D Pathway enrichment analysis of selected SE marker sets derived from post-menopausal SE (gene set 1) and SE3 (gene set 2). FDR-corrected p-values are shown.

Update of

References

    1. Holdsworth-Carson, S. J., Menkhorst, E., Maybin, J. A., King, A., Girling, J. E. Cyclic processes in the uterine tubes, endometrium, myometrium, and cervix: pathways and perturbations. Mol. Hum. Reprod. 29, gaad012 (2023). - PMC - PubMed
    1. Rigby, C. H. et al. The immune cell profile of human fallopian tubes in health and benign pathology: a systematic review. J. Reprod. Immunol.152, 103646 (2022). - PubMed
    1. Crow, J., Amso, N. N., Lewin, J. & Shaw, R. W. Morphology and ultrastructure of fallopian tube epithelium at different stages of the menstrual cycle and menopause. Hum. Reprod.9, 2224–2233 (1994). - PubMed
    1. Karst, A. M. et al. Stathmin 1, a marker of PI3K pathway activation and regulator of microtubule dynamics, is expressed in early pelvic serous carcinomas. Gynecol. Oncol.123, 5–12 (2011). - PMC - PubMed
    1. Labidi-Galy, S. I. et al. High grade serous ovarian carcinomas originate in the fallopian tube. Nat. Commun.8, 1093 (2017). - PMC - PubMed

Publication types

Substances