Clinical Trial
. 2025 Jan 3;16(1):358.
doi: 10.1038/s41467-024-55308-5.

Deeper response predicts better outcomes in high-risk-smoldering-myeloma: results of the I-PRISM phase II clinical trial

Affiliations
Clinical Trial

Deeper response predicts better outcomes in high-risk-smoldering-myeloma: results of the I-PRISM phase II clinical trial

Omar Nadeem et al. Nat Commun. .

Abstract

Early therapeutic intervention in high-risk smoldering multiple myeloma (HR-SMM) has shown benefits, however, no studies have assessed whether biochemical progression or response depth predicts long-term outcomes. The single-arm I-PRISM phase II trial (NCT02916771) evaluated ixazomib, lenalidomide, and dexamethasone in 55 patients with HR-SMM. The primary endpoint, median progression-free survival (PFS), was not reached (NR) (95% CI: 57.7-NR, median follow-up 50 months). The secondary endpoint, biochemical PFS, was 48.6 months (95% CI: 39.9-NR) and coincided with or preceded SLiM-CRAB in eight patients. For additional secondary objectives, the overall response rate was 93% with 31% achieving complete response (CR) and 45% very good partial response (VGPR) or better. CR correlated strongly with the absence of SLiM-CRAB and biochemical progression. MRD-negativity (10-5 sensitivity) predicted a 5-year biochemical PFS of 100% versus 40% in MRD-positive patients (p = 0.051), demonstrating that deep responses significantly improve time to progression. Exploratory single-cell RNA sequencing linked tumor MHC class I expression to proteasome inhibitor response, and a lower proportion of GZMB+ T cells within clonally expanded CD8+ T cells associated with suboptimal outcomes.


Conflict of interest statement

Competing interests: O.N. reports research support from Takeda and Janssen; advisory board participation for Bristol Myers Squibb, Janssen, Sanofi, Takeda, and GPCR therapeutics; and honorarium from Pfizer. M.B. reports consultancy for Janssen, BMS, Takeda, Epizyme, Karyopharm, Menarini Biosystems, and Adaptive. G.B. reports consultancy for Prothena. E.O. reports advisory board participation and/or honoraria from Janssen, BMS, Sanofi, Pfizer, Exact; consulting for Takeda; and steering committee participation with Natera. K.A. reports consultancy for AstraZeneca, Janssen, and Pfizer; and board participation and stock options for Dynamic Cell Therapies, C4 Therapeutics, Next RNA, Oncopep, Starton, and Window. P.G.R. reports advisory board participation or consulting for Celgene (BMS), GSK, Karyopharm, Oncopeptides, Regeneron, Sanofi, and Takeda; and research grants from Oncopeptides and Karyopharm. R.S.P. is a co-founder, equity holder, and consultant for PreDICTA Bioscience. I.M.G.: Consulting/Advisory role: AbbVie, Adaptive, Amgen, Aptitude Health, Bristol Myers Squibb, GlaxoSmithKline, Huron Consulting, Janssen, Menarini Silicon Biosystems, Oncopeptides, Pfizer, Sanofi, Sognef, Takeda, Binding Site a part of Thermo Fischer Scientific, Window Therapeutics, and 10X Genomics; speaker fees from Vor Biopharma and Veeva Systems, Inc., and is a co-founder of PreDICTA Bioscience. I.M.G.’s spouse is the CMO and an equity holder of Disc Medicine. All other authors declare no conflicts of interest. Inclusion and ethics: One or more of the authors of this paper self-identifies as an underrepresented ethnic and/or gender minority in science. One or more of the authors of this paper self-identifies as a member of the LGBTQIA+ community. We support inclusive, diverse, and equitable conduct of research.

Figures

Fig. 1
Fig. 1. Study design, patients’ cytogenetic abnormalities, and responses.
A CONSORT diagram. B Primary events such as translocations and hyperdiploidy and secondary events such as copy number alterations identified by FISH, WGS, scRNA, and response to therapy. WGS whole genome sequencing, scRNA single-cell RNA sequencing. scRNA-seq revealed a more complex aberration in Patient 41 (HRD with trisomies of chromosomes 5, 9, 11, 15, 19, and 21) compared to WGS which only detected trisomies on chromosomes 9 and 15. This explains the apparent discrepancy between WGS finding “no primary event” and scRNA-seq identifying HRD (homologous recombination deficiency) in that case. ND not determined, CR complete response, VGPR very good partial response, PR partial response, MR minimal response, SD stable disease. Source data are provided as a Source Data file.
Fig. 2
Fig. 2. Swimmer’s plot of responses deepening over time.
Each lane represents one participant. Source data are provided as a Source Data file.
Fig. 3
Fig. 3. Progression-free and overall survival.
Progression defined by A SLiM-CRAB criteria B Biochemical progression C Overall survival. NR not reached. Source data are provided as a Source Data file.
Fig. 4
Fig. 4. Progression-free survival.
A Kaplan-Meier curve of response duration stratified by 20/2/20 risk groups. B Kaplan-Meier curve of progression stratified by 20/2/20 risk groups. Survival distributions were compared using two-sided log-rank tests. Outcomes stratified by the presence of evolving disease prior to treatment. C Overall survival D Biochemical progression-free survival E Time-to-progression and F Duration of response. NR not reached. Survival distributions were compared using two-sided log-rank tests. Source data are provided as a Source Data file.
Fig. 5
Fig. 5. Kaplan Meier curve of progression-free survival.
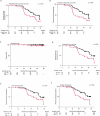
Based on (A) Time to progression based on depth of response of VGPR of greater. p = 8.0e-4 VGPR = Very good partial response (B) PFS by depth of response of VGPR of greater amongst cytogenetically high-risk patients (high-risk cytogenetics identified by FISH alone). C PFS by depth of response of VGPR of greater amongst cytogenetically high-risk patients (High-risk patients identified by FISH, WGS, or single-cell RNA sequencing.) p = 3.1e-4. D Kaplan-Meier curve of progression-free-survival stratified by patients who achieved sustained CR with progression defined by SLiM-CRAB criteria. CR complete response. E Kaplan-Meier curve of duration of response stratified by patients who achieved sustained CR. F Kaplan-Meier curve of Biochemical progression-free-survival stratified by sustained CR status. G Kaplan Meier curve of progression-free survival based on MRD status. NR not reached. Survival distributions were compared using two-sided log-rank tests. Source data are provided as a Source Data file.
Fig. 6
Fig. 6. Single-cell RNA sequencing results.
A Time to progression or last follow-up for patients with sequencing data (one patient per row, grouped by progression status). Green boxes indicate baseline sequencing data available for each patient. Vertical dotted line denotes end of treatment. B Uniform manifold approximation and projection (UMAP) of patient and HD plasma cells that passed quality filtering. Colors indicate individual patients or HD as a group C UMAP colored by malignancy status (tumor vs normal cells). D UMAP colored by biochemical progression status. E Volcano plot of differential gene expression in tumor cells of progressors (n = 10) and non-progressors (n = 3). Two-sided p values were computed with Wilcoxon rank-sum test and corrected using the Benjamini-Hochberg approach. Stars = top 30 genes on either side of the volcano with q < 0.05. F Mean HLA class I gene expression from tumor bulk RNA-seq from the PADIMAC cohort who responded (Bortezomib_good, n = 13) or did not respond (Bortezomib_standard, n = 31) to Bortezomib treatment. Box: 1st quartile, median, 3rd quartile; whiskers: ±1.5*interquartile range. The p value was computed with two-sided Wilcoxon rank-sum test. G UMAP of T cell subtypes (H) Average proportion of clonotypes belonging to four clone size categories (rare, <1%; small,1% and <5%; medium,5% and <10%; large:10%) per patient in baseline BM CD138- samples. Error bars = SD from 100 iterations. P values were obtained using two-sided bootstrapping test to compare the mean proportion of rare clones between progressors and non-progressors. In all types of statistical analysis values of p < 0.05 were considered significant (*p < 0.05; **p < 0.01; ***p < 0.001; ****p < 0.0001). I GZMB+ CD8+ T effector memory cell abundance in expanded clones from non-progressors and progressors. Plot statistics same as (F). J UMAP of baseline BM T cells from progressors and non-progressors with matched TCR data. T cells with expanded clones (frequency > 1%) are colored by cell type. Gray = cells with rare clonotypes K Volcano plot of differential gene expression of clonally expanded CD8+ TEM in progressors and non-progressors. Statistics same as (E). HD healthy donors, P patient, WGS whole-genome sequencing, HRD hyperdiploidy. Source data are provided as a Source Data file.

Similar articles

Cited by

References

    1. Kyle, R. A. et al. Clinical course and prognosis of smoldering (asymptomatic) multiple myeloma. N. Engl. J. Med.356, 2582–2590 (2007). - PubMed
    1. Mateos, M. V. et al. International Myeloma Working Group risk stratification model for smoldering multiple myeloma (SMM). Blood Cancer J.10, 102 (2020). - PMC - PubMed
    1. Dispenzieri, A. et al. Immunoglobulin free light chain ratio is an independent risk factor for progression of smoldering (asymptomatic) multiple myeloma. Blood111, 785–789 (2008). - PMC - PubMed
    1. Perez-Persona, E. et al. New criteria to identify risk of progression in monoclonal gammopathy of uncertain significance and smoldering multiple myeloma based on multiparameter flow cytometry analysis of bone marrow plasma cells. Blood110, 2586–2592 (2007). - PubMed
    1. Rajkumar, S. V., Landgren, O. & Mateos, M. V. Smoldering multiple myeloma. Blood125, 3069–3075 (2015). - PMC - PubMed

Publication types

MeSH terms

Associated data