. 2025 Jan 2;16(1):348.
doi: 10.1038/s41467-024-55718-5.

Structures of Saccharolobus solfataricus initiation complexes with leaderless mRNAs highlight archaeal features and eukaryotic proximity

Affiliations

Structures of Saccharolobus solfataricus initiation complexes with leaderless mRNAs highlight archaeal features and eukaryotic proximity

Gabrielle Bourgeois et al. Nat Commun. .

Abstract

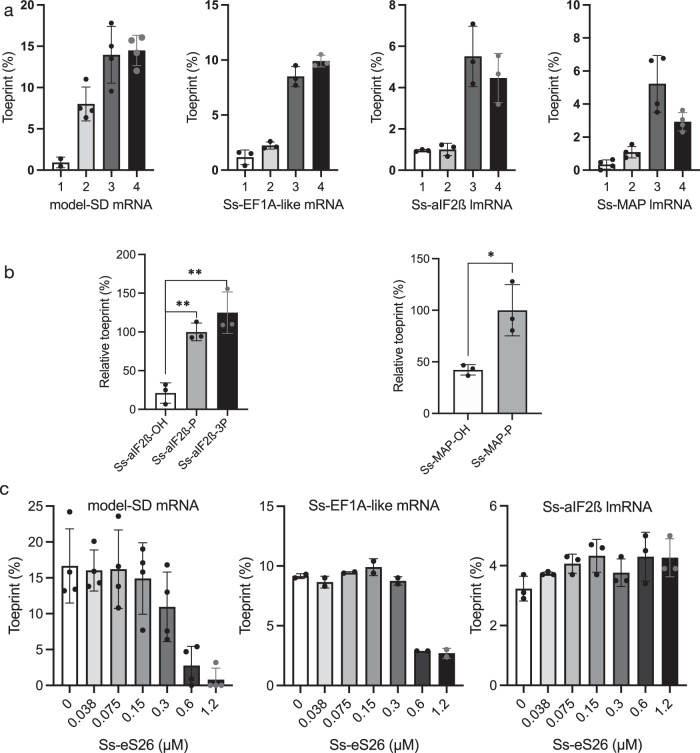
The archaeal ribosome is of the eukaryotic type. TACK and Asgard superphyla, the closest relatives of eukaryotes, have ribosomes containing eukaryotic ribosomal proteins not found in other archaea, eS25, eS26 and eS30. Here, we investigate the case of Saccharolobus solfataricus, a TACK crenarchaeon, using mainly leaderless mRNAs. We characterize the small ribosomal subunit of S. solfataricus bound to SD-leadered or leaderless mRNAs. Cryo-EM structures show eS25, eS26 and eS30 bound to the small subunit. We identify two ribosomal proteins, aS33 and aS34, and an additional domain of eS6. Leaderless mRNAs are bound to the small subunit with contribution of their 5'-triphosphate group. Archaeal eS26 binds to the mRNA exit channel wrapped around the 3' end of rRNA, as in eukaryotes. Its position is not compatible with an SD:antiSD duplex. Our results suggest a positive role of eS26 in leaderless mRNAs translation and possible evolutionary routes from archaeal to eukaryotic translation.


Conflict of interest statement

Competing interests: The authors declare no competing interest.

Figures

Fig. 1
Fig. 1. Toeprinting signal of 30S complexes assembled on various mRNAs.
aToeprint signals for (1) 30S:mRNA, (2) 30S:mRNA:Met-tRNAiMet, (3) 30S:mRNA:aIF2:Met-tRNAiMet (4) 30S:mRNA:aIF2:Met-tRNAiMet:aIF1A were measured as described in Methods. Data are presented as means ± SD from independent experimental units (Methods). Dots show individual data points. Typical experiments and the sequences of the mRNAs are shown in Supplementary fig. 3 and Supplementary Table 1. Ss-MAP mRNA has a 5’OH extremity whereas the Ss-aIF2β mRNA has a 5’ triphosphate group. Experimental toeprinting conditions were the same for model-SD mRNA (n = 4), Ss-EF1A-like mRNA (n = 3) and Ss-aIF2β lmRNA (n = 3). With Ss-MAP lmRNA (n = 4), the molar excesses of IF and tRNA with respect to 30S were increased by factors of 4 and 2.5, respectively. b Importance of the 5’-triphosphate end. Relative toeprinting signals were measured for 5’-triphosphate (Ss-aIF2β only), 5’ monophosphate or 5’-OH versions of the Ss-aIF2β and Ss-MAP lmRNAs. The values represented are the means and standard deviations from 3 independent experiments. For each mRNA, values were normalized to the mean obtained with the monophosphorylated mRNA which was given the arbitrary value of 100%. Two-tailed P values were calculated from unpaired t tests in PRISM (P values were 0.0014 and 0.0038 for Ss-aIF2β and 0.017 for Ss-MAP). Typical experiments are shown in Supplementary fig. 17. c Influence of Ss-eS26 concentration on the main toeprinting signal intensity obtained with 30S:mRNA:aIF2:Met-tRNAiMet complexes. Ss-eS26 concentrations ranged from 0 to 1.2 µM. 30S concentration in all experiments was 0.1 µM (Supplementary fig. 20). The means from independent experiments (left: n = 4; middle: n = 2; right: n = 3) with the calculated standard deviations are represented. Dots show individual data points. Source data are provided as a Source Data file.
Fig. 2
Fig. 2. Cryo-EM analysis of S. solfataricus 30S:mRNA:aIF2:Met-tRNAiMet complexes.
a Cryo-EM map (3.02 Å resolution) of a 30S IC complex assembled on model-SD mRNA (DS1). The Cryo-EM map is colored according to the structural model using the volume zone command in ChimeraX. The rRNA is in light green, except for the anti-SD sequence at the 3’-end which is in orange. R-proteins are in dark green except eS25, eS30 and eS6 which are in cornflower blue, and aS32, aS33 in Indian red. tRNA is in kaki and mRNA is in blue. The same color code is used in the four panels. b Cryo-EM map (2.8 Å resolution) of a 30S IC complex assembled on Ss-MAP lmRNA (DS2). A second mRNA molecule bound to the anti-SD sequence (see text) is colored in magenta and labeled mRNA2. c Cryo-EM map (2.94 Å resolution) of a 30S IC complex assembled on Ss-aIF2β lmRNA (DS3). d Cryo-EM map (3.72 Å resolution) of a 30S IC complex assembled on Ss-EF1A-like lmRNA (DS4). In views (c) and (d), eS26 bound to the mRNA exit channel is colored in cornflower blue. e The structure of S. solfataricus 30S bound to Ss-aIF2β lmRNA and Met-tRNAiMet as observed in view (c). The view shows all 30S ribosomal proteins as discussed in the text. In the left view, Met-tRNAiMet is shown in light yellow cartoon. aS33, aS34 and domain 2 of eS6 were identified in this work.
Fig. 3
Fig. 3. Comparison of 16S rRNAs from S. solfataricus and P. abyssi.
a h16 and eS30 binding site. The cryo-EM structure of Ss-30S is shown on the left with the rRNAs helices of interest colored in red (S. solfataricus) or in light yellow (P. abyssi). eS6 is colored in cornflower blue. b Region of h10, h6, h44 and eS6 (cornflower blue) binding site. c Position of eS6 in the human ribosome (8QOI). See also Supplementary fig. 8 for a description of eS6 in eukaryotes and archaea.
Fig. 4
Fig. 4. 3D structures and phylogenetic distribution of Ss-aS33, Ss-aS34 and Ss-eS6-domain 2.
a 3D structures of aS33, aS34 and eS6 as observed here in S. solfataricus 30S. eS6 is composed of two domains (see also Supplementary fig. 8). The N-domain is present in all eukaryotes and archaea, while domain 2 is present only in Thermoprotei (see below). b BlastP and Hmmer searches show that of Ss-aS33, Ss-aS34, Ss-eS6-domain 2 orthologs are found only in Thermoprotei and more precisely in the Acidilobales, Desulfurococcales, Fervidicoccales and Sulfolobales orders. Ss-aS33, Ss-aS34, Ss-eS6-domain 2 are not found in Thermoproteales and Thermofilales. Note that eS6 N-domain is present in all archaea.
Fig. 5
Fig. 5. Archaeal versions of eS25, eS26, eS30 and herein identified 30S ribosomal proteins.
a Cartoon representation showing the positions of eS25 and eS30. Two close-up views show the DS2 cryo-EM map around the N-tails of eS30 and eS25. The cryo-EM map suggests interaction of eS25-Gly2 with residues A1189 and C1191 and the carbonyl group of uS13-T135 as well as an interaction between eS25-G3 and the carbonyl group of uS13-G136. b Same as part A but the view is rotated by 180°, showing the positions of eS26, aS33 and aS34. On the right, the close-up views compare the S. solfataricus case (top) with the human case (bottom; PDB 8G5Y or 8QOI). Note that eS26 is only visible in IC-DS3 and IC-DS4.
Fig. 6
Fig. 6. mRNA exit channel.
a View of the mRNA exit channel of IC-DS1. The SD duplex is bound to the channel. The mRNA is in dark blue and the rRNA is in orange. Peripheral proteins are indicated. b View of the mRNA exit channel of IC-DS3. eS26 (cornflower blue) is bound to the channel wrapped around the 3’ end of the rRNA. Superimposition of the two structures shows that SD duplex and eS26 bindings are not compatible.
Fig. 7
Fig. 7. Interactions at the P site.
a Network of interactions at the P site in IC-DS1. The proximal part of the h44 helix is in orange. The h24 loop and parts of h45 interacting with h44 are in red. mRNA is in blue and the initiator tRNA is in yellow. Modified nucleotides are colored by atoms and labeled. Parts of the rRNA located close to the codon-anticodon duplex are in aquamarine. The same color code is used in the three views. b Close-up of the codon:anticodon interaction in IC-DS1. c Same as view a but for IC-DS2. d Same as view b but for IC-DS2. The cryo-EM map is also shown to highlight the network of water molecules located above G889. The view shows that the water network mimicks base −1, as observed in the leadered mRNA shown in view b (base −1 in pink). A zoomed view on the region above G889 nucleobase studied by molecular dynamics is shown in the right-hand corner. The view shows that the GIST predicted water oxygens (red) and hydrogen (white) densities fit with the experimentally placed water molecules (red spheres) (see also “Methods” and Supplementary figs. 15, 16).
Fig. 8
Fig. 8. Determination of the 3’ and 5’ ends of the 16S rRNA.
a DNA sequencing electrophoregrams of the amplified 16S gene from S. solfataricus cells. Regions around the putative 3’-end of the 16S rRNA are boxed. 16S rDNA shows a CCTCA sequence. b Mapping of the 5’-end of the 16S rRNA using reverse transcription (RT). Lanes 1 to 4: DNA sequencing ladder of the amplified 16S gene using the reverse transcription primer. The complementary RNA sequence is shown on the left. Line 5: reverse transcription analysis of the 16S rRNA using the 5’ mapping reverse transcription primer. The arrest is indicated by an arrow. This experiment shows that the 5’-end of the 16S rRNA starts with the 5’-AAUCC sequence. The first base is indicated by a star. This experiment was performed twice (n = 2). c Identification of the 3’-end of the 16S rRNA. The 16S rRNA was first circularized using T4 RNA ligase, RT-PCR amplified (n = 1) and sequenced (n = 2). Left: sequencing of the RT-PCR amplified ligated 16S rRNA fragment. This qualitative experiment identified that the major sequence of the 3’ end is CCUCC. This result is consistent with the rRNA oligonucleotide catalogs that were early published. In parallel, a XhoI-BamHI fragment from the RT-PCR material, containing the 3’ and 5’ regions, was cloned into a pBS plasmid. Thirty-two independent clones were sequenced. The results show heterogeneity in the length of the 16S rRNA, as discussed in the text. Source data are provided as a Source Data file.

References

    1. Forterre, P., Brochier, C. & Philippe, H. Evolution of the Archaea. Theor. Popul Biol.61, 409–422 (2002). - PubMed
    1. Borrel, G., Brugère, J. F., Gribaldo, S., Schmitz, R. A. & Moissl-Eichinger, C. The host-associated archaeome. Nat. Rev. Microbiol18, 622–636 (2020). - PubMed
    1. Garcia, P. S., Gribaldo, S. & Borrel, G. Diversity and evolution of methane-related pathways in Archaea. Annu Rev. Microbiol76, 727–755 (2022). - PubMed
    1. Wang, H. et al. Distinct distribution of archaea from soil to freshwater to estuary: implications of archaeal composition and function in different environments. Front Microbiol11, 576661 (2020). - PMC - PubMed
    1. Adam, P. S., Borrel, G., Brochier-Armanet, C. & Gribaldo, S. The growing tree of Archaea: new perspectives on their diversity, evolution and ecology. Isme j.11, 2407–2425 (2017). - PMC - PubMed

Publication types

MeSH terms

LinkOut - more resources