. 2025 Jan 3;11(1):3.
doi: 10.1038/s41531-024-00858-0.

Enhanced glycolysis-derived lactate promotes microglial activation in Parkinson's disease via histone lactylation

Affiliations

Enhanced glycolysis-derived lactate promotes microglial activation in Parkinson's disease via histone lactylation

Qixiong Qin et al. NPJ Parkinsons Dis. .

Abstract

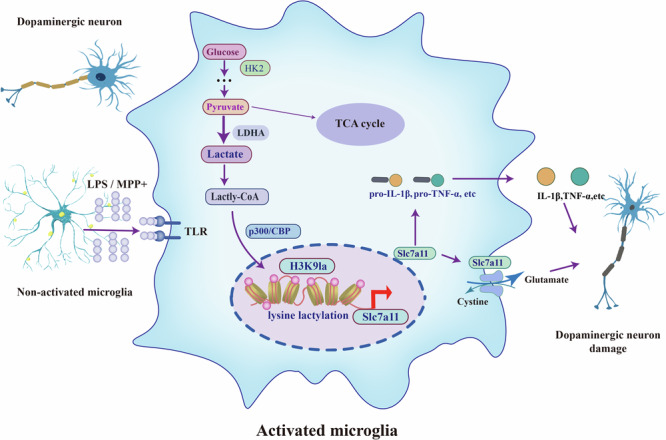
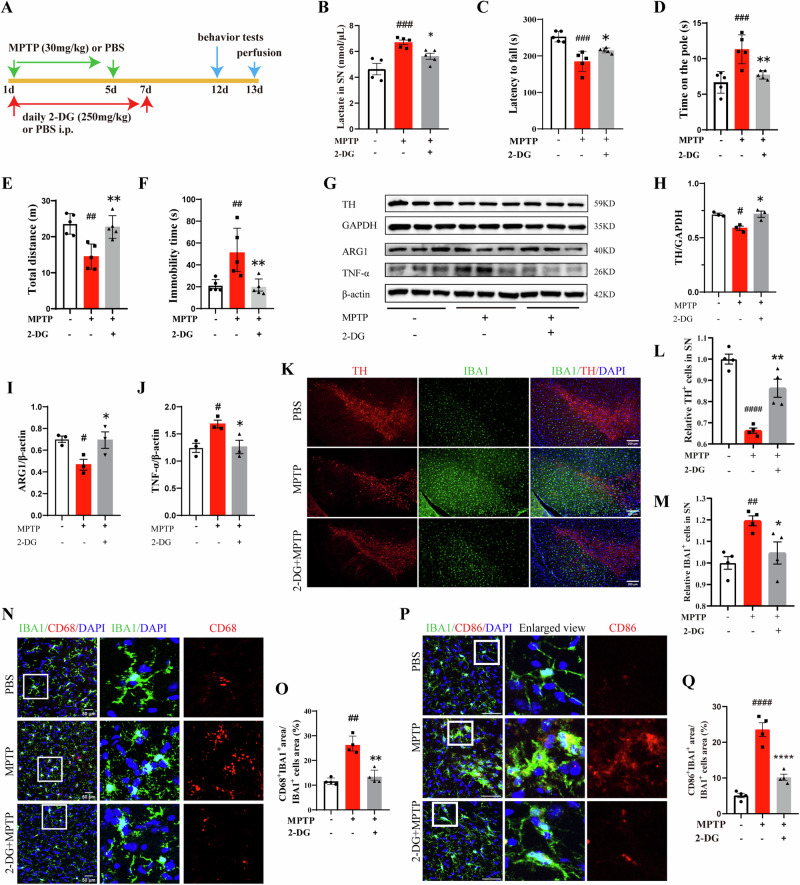
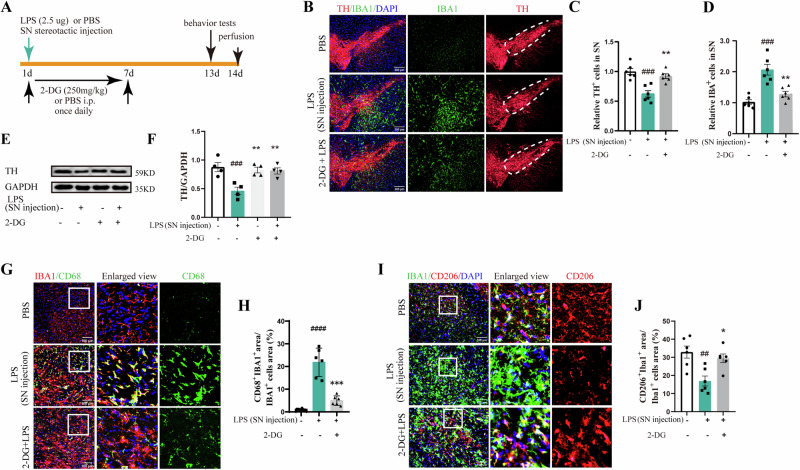
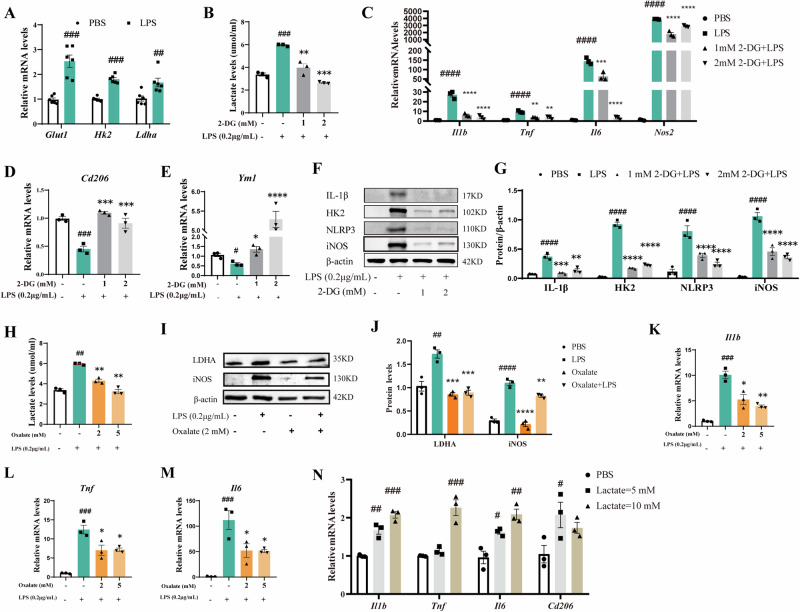
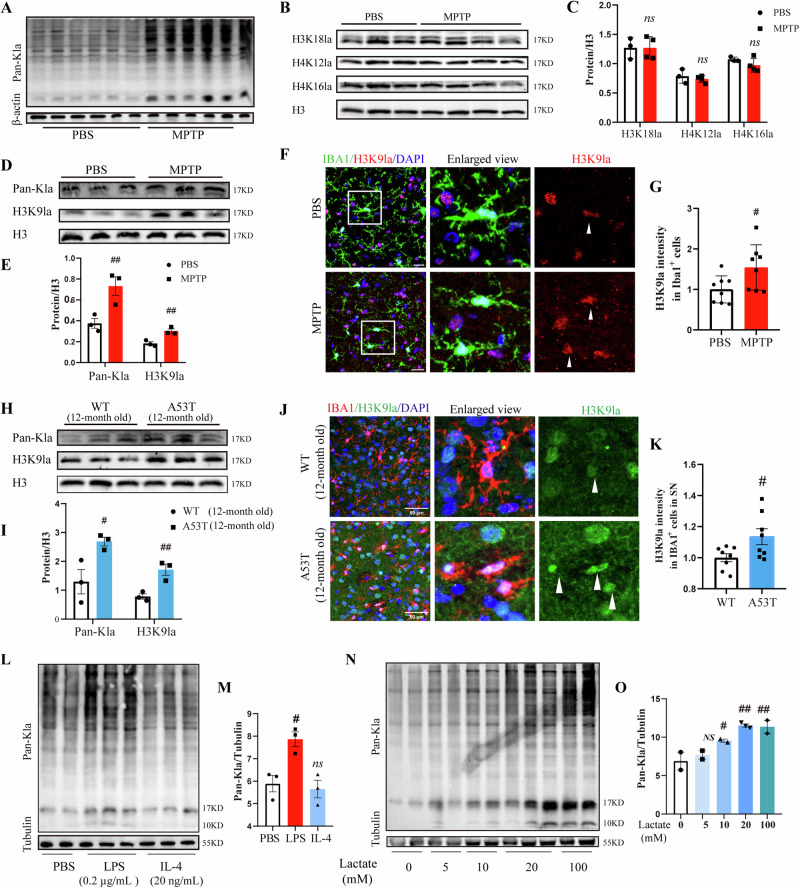
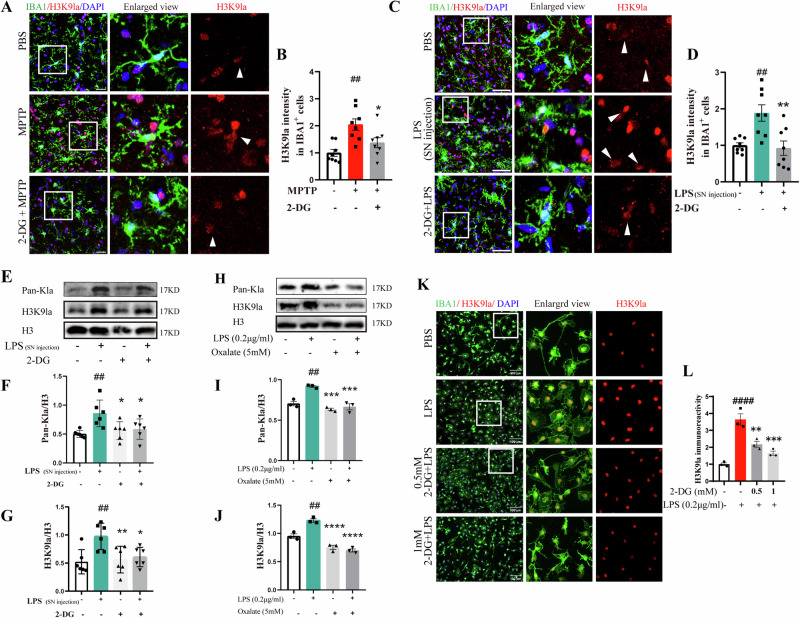
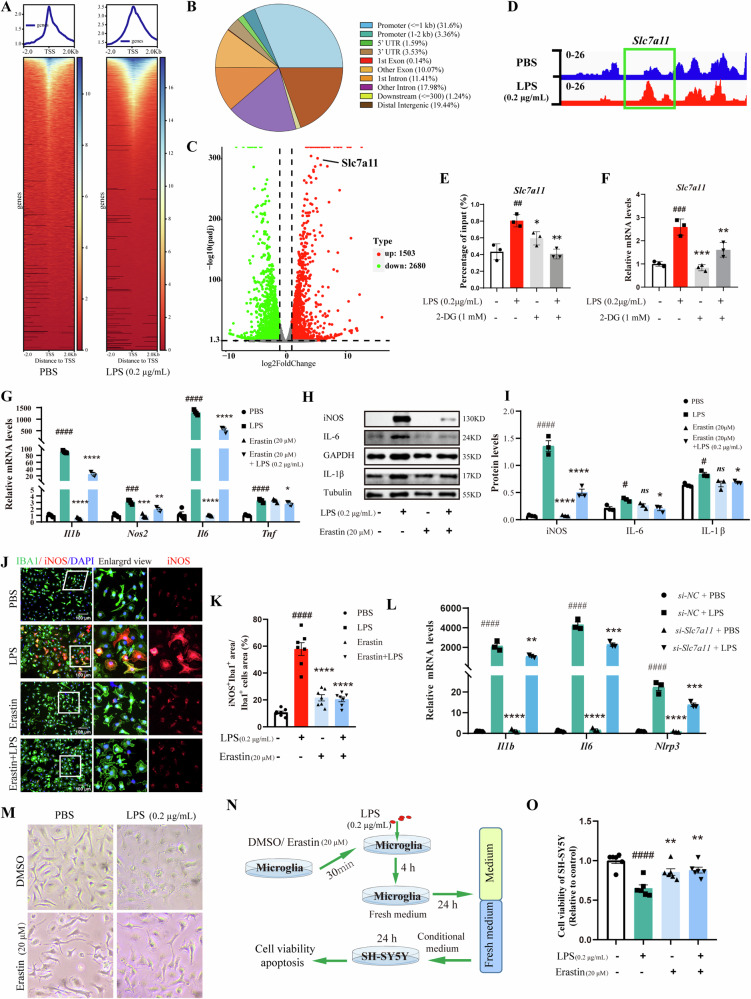
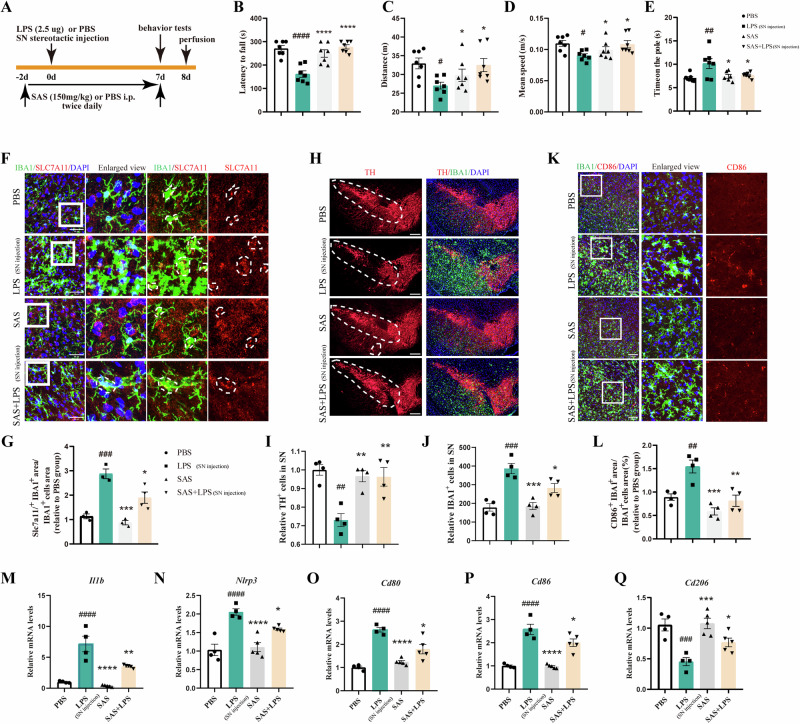
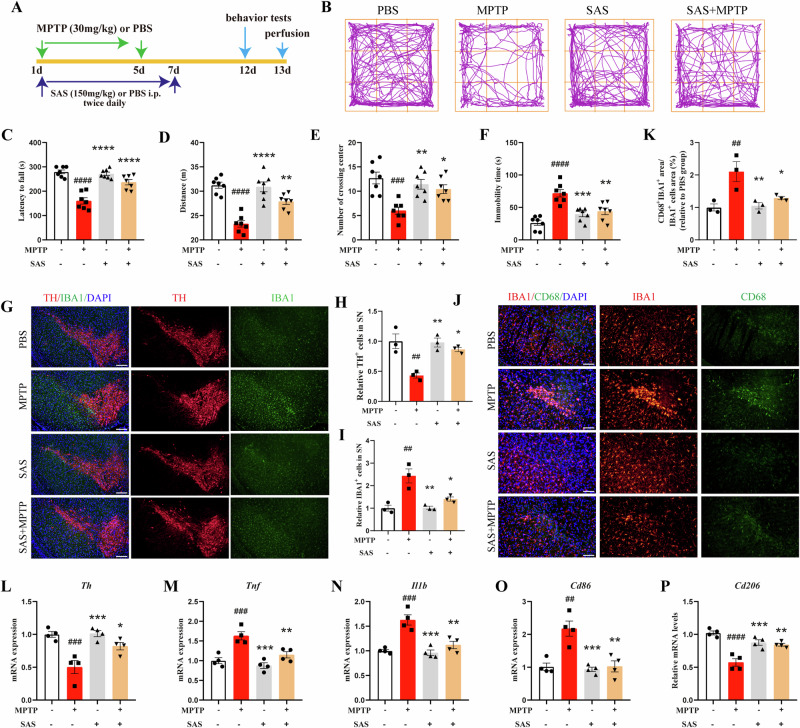
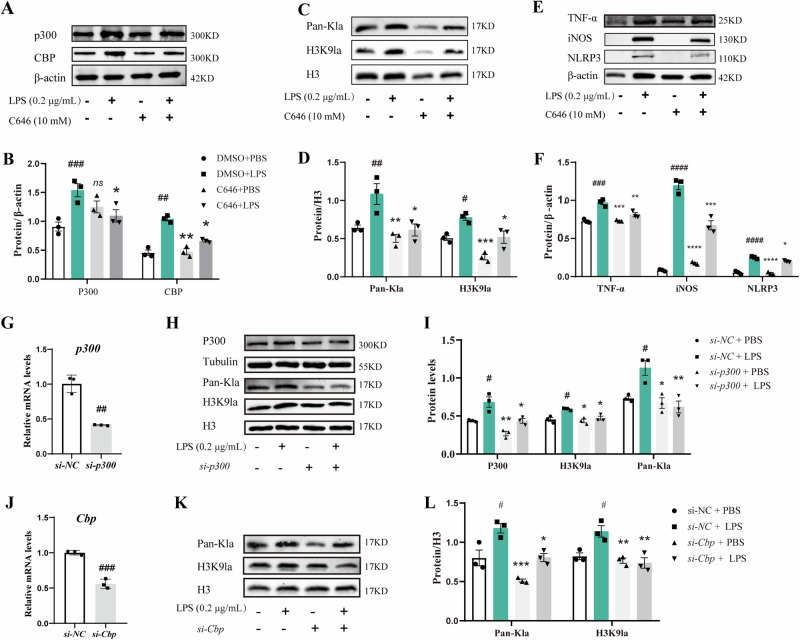
The switch from oxidative phosphorylation to glycolysis is crucial for microglial activation. Recent studies highlight that histone lactylation promotes macrophage homeostatic gene expression via transcriptional regulation, but its role in microglia activation in Parkinson's disease (PD) remains unclear. Here, we demonstrated that inhibiting glycolysis with 2-deoxy-D-glucose alleviates microgliosis, neuroinflammation and dopaminergic neurons damage by reducing lactate accumulation in PD mice. Notably, we observed a marked increase in histone lactylation, particularly H3K9 lactylation, in microglia in the substantia nigra of PD mice. Mechanistically, CUT&Tag and Chip-qPCR analyses revealed that H3K9 lactylation enriched at the SLC7A11promoter and activated its expression. Importantly, inhibiting SLC7A11 by sulfasalazine mitigated microglia-mediated neuroinflammation and improved motor function in PD mice. Moreover, we found that lactate-induce histone lactylation is dependent on P300/CBP. Collectively, our findings demonstrate that glycolysis-derived lactate promotes microglial activation via histone lactylation and provide a potential therapeutic strategy for PD.


Conflict of interest statement

Competing interests: The authors declare no competing interests.

Figures

Fig. 1
Fig. 1. The role of histone lactylation in microglial activation in Parkinson’s disease.
Enhanced glycolysis-derived lactate promotes H3K9 lactylation and activates the expression of SLC7A11. This cascade triggers microglial activation and neuroinflammation, ultimately resulting in DA neuron damage and contributing to the onset and progression of PD. Inhibiting glycolysis, P300/CBP, or SLC7A11 may offer protective effects in PD by disrupting the lactate/P300/H3K9 lactylation/SLC7A11 signaling pathway.
Fig. 2
Fig. 2. Inhibition of glycolysis alleviates microglial activation and improves motor function of MPTP-induced mice.
A Experimental schedule. B Lactate concentration in the SN of Control, MPTP, and 2-DG + MPTP mice. N = 4–5 per group. C–F Quantification of latency to fall in rotarod test, time on the pole in pole test, total distance and immobility time in OFT of Control, MPTP, and 2-DG + MPTP mice. N = 5 per group. G–J Representative western blotting and quantification of TH, ARG1, and TNF-α in the SN of Control, MPTP, and 2-DG-MPTP mice. N = 3 per group. K Representative images staining of TH (red) and IBA1 (green) in the SN of Control, MPTP, and 2-DG + MPTP mice. Scale bar, 200 µm. L Quantification of TH+ cells. N = 4 per group. M Quantification of IBA1+ cells. N = 4 per group. N Representative confocal images of IBA1 (green) and CD68 (red) in the SN of Control, MPTP, and 2-DG MPTP mice. Scale bar, 50 µm. O Quantification of the ratio of CD68+IBA1+ area to IBA1+ cells areas. N = 4 per group. P Representative confocal images of IBA1 (green) and CD86 (red) in the SN of Control, MPTP, and 2-DG MPTP mice. Scale bar, 50 µm. Q Quantification of the ratio of CD86+IBA1+ area to IBA1+ cells areas. N = 4 per group. Data are shown as the means ± SEM. Data were analyzed using one-way ANOVA followed by Tukey’s multiple comparisons test. Compared to Control group, #P < 0.05, ##P < 0.01, ###P < 0.001, ####P < 0.0001; compared to MPTP group, *P < 0.05, **P < 0.01, ***P < 0.001, ****P < 0.0001.
Fig. 3
Fig. 3. Inhibition of glycolysis alleviates microglial activation in the SN of LPS-injected mice.
A Experimental schedule. B Representative images staining of IBA1 (green) and TH (red) in the SN of Control, LPS (SN injection) and 2-DG + LPS (SN injection) mice. Scale bar, 200 µm. C and D Quantification of TH+ cells and IBA1+ cells. N = 6 per group. E and F Representative western blotting and quantification of TH in the SN of Control, LPS (SN injection) and 2-DG + LPS (SN injection) mice. N = 4 per group. G Representative confocal images of IBA1 (red) and CD68 (green) in the SN of Control, LPS (SN injection), and 2-DG + LPS (SN injection) mice. Scale bar, 50 µm. H Quantification of the ratio of CD68+IBA1+ area to IBA1+ cells areas. N = 6 per group. I Representative images of IBA1 (green) and CD206 (red) in the SN of Control, LPS (SN injection) and 2-DG + LPS (SN injection) mice. Scale bar, 100 µm. J Quantification of the ratio of CD206+IBA1+ area to IBA1+ cells area. N = 6 per group. Data are shown as the means ± SEM. Data were analyzed using one-way ANOVA followed by Tukey’s multiple comparisons test. Compared to Control group, #P < 0.05, ##P < 0.01, ###P < 0.001, ####P < 0.0001; compared to LPS (SN injection) group, *P < 0.05, **P < 0.01, ***P < 0.001, ****P < 0.0001.
Fig. 4
Fig. 4. Enhanced glycolysis-derived lactate promotes microglial activation.
Primary microglia pretreated with or without 2-DG (1 or 2 mM) for 30 min, then stimulated with 0.2 μg/mL LPS for 24 h. A mRNA expression of Glut1, Hk2 and Ldha. N = 6 per group. B Lactate concentration. N = 3 per group. C–E mRNA expression of Il1b, Tnf, Il6, Nos2, Cd206, and Ym1. N = 3 per group. F and G Representative western blotting and quantification of IL-1β, HK2, NLRP3, and iNOS in LPS stimulated primary microglia treated with or without 2-DG. N = 3 per group. Primary microglia pretreated with or without sodium oxalate (2 or 5 mM) for 30 min, then stimulated with 0.2 μg/mL LPS for 24 h. H Lactate concentration. N = 3 per group. I and J Representative western blotting and quantification of iNOS and LDHA. N = 3 per group. K–M mRNA expression of Il1b, Tnf and Il6. N = 3 per group. N mRNA expression of Il1b, Tnf, Il6 and Cd206 in primary microglia stimulated with or without sodium lactate. N = 3 per group. Data are shown as the mean ± SEM and analyzed with one-way ANOVA followed by Tukey’s multiple comparisons test. Compared to PBS group, #P < 0.05, ##P < 0.01, ###P < 0.001, ####P < 0.0001; compared to LPS group, *P < 0.05, **P < 0.01, ***P < 0.001, ****P < 0.0001.
Fig. 5
Fig. 5. Histone lactylation increases in microglia of PD mice and LPS-stimulated primary microglia.
A Representative western blotting of Pan-Kla in the SN of Control and MPTP mice. N = 6 per group. B–E Representative western blotting and quantification of H3K18la, H4K12la, H4K16la, Pan-Kla, and H3K9la in the SN of Control and MPTP mice. N = 3–4 per group. F Representative images of IBA1 (green) and H3K9la (red) in the SN of Control and MPTP. Scale bar, 50 μm. G Quantification of fluorescence intensity of H3K9la in microglia in the SN of Control and MPTP. N = 8 per group. H and I Representative western blotting and quantification of Pan-Kla and H3K9la in the SN tissues of WT and A53T mice. N = 3 per group. J Representative images of IBA1 (red) and H3K9la (green) in the SN of WT and A53T mice. Scale bar, 50 μm. K Quantification of fluorescence intensity of H3K9la in IBA1+ cells. N = 8 per group. L and M Representative western blotting and quantification of Pan-Kla in primary microglia treated with PBS, LPS (0.2 μg/mL) and IL-4 (20 ng/mL) for 24 h. N = 3 per group. N and O Representative western blotting and quantification of Pan-Kla in primary microglia treated with exogenous lactate (0, 5, 10, 20, 100 mM) for 24 h. N = 2–3 per group. Data were analyzed using two-tailed unpaired Student’s t-test or one-way ANOVA followed by Tukey’s multiple comparisons test. Compared to Control group, #P < 0.05, ##P < 0.01, ###P < 0.001; compared to MPTP group or A53T group or LPS group, *P < 0.05, **P < 0.01, ***P < 0.001, ****P < 0.0001. ns indicates no statistical significance.
Fig. 6
Fig. 6. Inhibition of glycolysis decreased the levels of histone lactylation in microglia of PD mice and LPS-stimulated primary microglia.
A Representative images of IBA1 (green) and H3K9la (red) in the SN of Control, MPTP, and 2-DG + MPTP mice. Scale bar, 50 μm. B Quantification of fluorescence intensity of H3K9la in microglia in the SN of Control, MPTP, and 2-DG + MPTP mice. N = 8 per group. C Representative images of IBA1 (green) and H3K9la (red) in the SN of Control, LPS (SN injection) and 2-DG + LPS (SN injection) mice. Scale bar, 50 μm. D Quantification of fluorescence intensity of H3K9la in microglia in the SN of Control, LPS (SN injection) and 2-DG + LPS (SN injection) mice. N = 8 per group. E–G Representative western blotting and quantification of Pan-Kla and H3K9la in the SN of Control, LPS (SN injection), 2-DG and 2-DG + LPS (SN injection) mice. N = 6 per group. H–J Representative western blotting and quantification of Pan-Kla and H3K9la in primary microglia treated with or without sodium oxalate (5 mM) for 30 min, then stimulated with 0.2 μg/mL LPS for 24 h. N = 3 per group. (K) Representative images of IBA1 (green) and H3K9la (red) in primary microglia treated with or without 2-DG (0.5 or 1 mM) for 30 min, then stimulated with 0.2 μg/mL LPS for 24 h. Scale bar, 100 μm. (L) Quantification of fluorescence intensity of H3K9la. N = 3 per group. Data were analyzed using one-way ANOVA followed by Tukey’s multiple comparisons test. Compared to the Control group, #P < 0.05, ##P < 0.01, ###P < 0.001, ####P < 0.0001; compared to the MPTP group or LPS (SN injection) group or LPS group, *P < 0.05, **P < 0.01, ***P < 0.001, ****P < 0.0001.
Fig. 7
Fig. 7. SLC7A11 is the downstream target of H3K9la in microglia according to Genome-wide analysis.
A The heatmap presents CUT&Tag tag counts at H3K9la binding peaks in primary microglia treated with or without 0.2 μg/mL LPS for 24 h, ordered by signal strength. B Genome-wide distribution of upregulated H3K9la-binding peaks. C Volcano plots illustrate differentially expressed genes in primary microglia stimulated with or without 0.2 μg/mL LPS for 24 h. N = 3 per group. D Genome browser tracks of CUT&Tag signal at target gene loci, with green rectangles marking H3K9la peaks on Slc7a11 promoters. E ChIP-qPCR was performed on microglia treated with or without 1 mM 2-DG for 30 min then stimulated with 0.2 μg/mL LPS for 24 h, using anti-H3K9la antibody. N = 3 per group. (F) Slc7a11 mRNA expression in primary microglia treated with 2-DG (1 mM) for 30 min then stimulated with 0.2 μg/mL LPS for 24 h. N = 3 per group. G Il1b, Nos2, Il6, and Tnf mRNA expression in primary microglia treated with erastin (20 μM) for 30 min then stimulated with 0.2 μg/mL LPS for 24 h. N = 4 per group. H and I Representative western blotting and quantification of iNOS, IL-6 and IL-1β. N = 3 per group. J Representative images of IBA1 (green) and iNOS (red) in primary microglia treated with erastin (20 μM) for 30 min then stimulated with 0.2 μg/mL LPS for 24 h. Scale bar, 100 μm. K Quantification of the ratio of iNOS+IBA+ area to IBA+ cells area. N = 7 per group. L Il1b, Il6, Nlrp3 mRNA expression in primary microglia transfected with si-NC or si-Slc7a11 for 24 h then stimulated with or without 0.2 μg/mL LPS for 24 h. N = 3 per group. M Morphological assessment of microglia after treatments. N Experimental schedule of SH-SY5Y cells stimulated with MCM. O Survival rate of SH-SY5Y cells was assessed by CCK8 assay. N = 6 per group. Data are shown as the mean ± SEM. Data were analyzed with one-way ANOVA followed by Tukey’s multiple comparisons test. Compared to PBS group, #P < 0.05, ##P < 0.01, ###P < 0.001, ####P < 0.0001; compared to LPS group, *P < 0.05, **P < 0.01, ***P < 0.001, ****P < 0.0001. ns indicates no statistical significance.
Fig. 8
Fig. 8. Inhibition of SLC7A11 attenuates microglial activation and improves motor dysfunction in LPS-injected mice.
A Experimental schedule. B–E Quantification of latency to fall in rotarod test, total distance and immobility time in OFT, time on the pole in pole test of Control, LPS (SN injection), SAS, and SAS + LPS (SN injection) mice. N = 7 per group. F Representative confocal images staining of IBA1 (green) and SLC7A11 (red) in the SN of Control, LPS (SN injection), SAS, and SAS + LPS (SN injection) mice. Scale bar, 50 µm. G Quantification of the ratio of SLC7A11+IBA1+ area to IBA1+ cells area. N = 3 per group. H Representative images staining of IBA1 (green) and TH (red) in the SN of Control, LPS (SN injection), SAS, and SAS + LPS (SN injection) mice. Scale bar, 200 µm. I and J Quantification of TH+ cells and IBA1+ cells. N = 4 per group. K Representative images staining of IBA1 (green) and CD86 (red) in the SN of Control, LPS (SN injection), SAS, and SAS + LPS (SN injection) mice. Scale bar, 100 µm. L Quantification of the ratio of CD86+IBA1+ area to IBA1+ cells area. N = 4 per group. M–Q Il1b, Nlrp3, Cd80, Cd 86 and Cd206 mRNA expression in the SN tissues of Control, LPS (SN injection), SAS, and SAS + LPS (SN injection) mice. N = 4 per group. Data are shown as the mean ± SEM. Data were analyzed with one-way ANOVA followed by Tukey’s multiple comparisons test. Compared to PBS group, #P < 0.05, ##P < 0.01, ###P < 0.001, ####P < 0.0001; compared to LPS (SN injection) group, *P < 0.05, **P < 0.01, ***P < 0.001, ****P < 0.0001.
Fig. 9
Fig. 9. Inhibition of SLC7A11 reduces microglial activation and improves motor function in MPTP-treated mice.
A Experimental schedule. B Open field experiment showing representative images of mouse movement trajectories. C–F Quantification of latency to fall in rotarod test, total distance and immobility time in OFT, time on the pole in pole test of PBS, MPTP, SAS, and SAS + MPTP mice. N = 7 per group. G Representative images staining of IBA1 (green) and TH (red) in the SN of PBS, MPTP, SAS, and SAS + MPTP mice. Scale bar, 200 µm. H and I Quantification of TH+ cells and IBA1+ cells. N = 3 per group. J Representative images staining of CD68 (green) and IBA1 (red) in the SN of PBS, MPTP, SAS, and SAS + MPTP mice. Scale bar, 200 µm. K Quantification of the ratio of CD68+IBA1+ area to IBA1+ cells area. N = 3 per group. L–P Th, Tnf, Il1b, Cd86 and Cd206 mRNA expression in the SN tissues of PBS, MPTP, SAS, and SAS + MPTP mice. N = 4 per group. Data are shown as the mean ± SEM. Data were analyzed with one-way ANOVA followed by Tukey’s multiple comparisons test. Compared to PBS group, #P < 0.05, ##P < 0.01, ###P < 0.001, ####P < 0.0001; compared to MPTP group, *P < 0.05, **P < 0.01, ***P < 0.001, ****P < 0.0001.
Fig. 10
Fig. 10. P300/CBP mediates lactate-induced histone lactylation and microglial activation.
A and B Representative western blotting and quantification of P300 and CBP in primary microglia treated with or without C646 (10 mM) for 30 min then stimulated with 0.2 μg/mL LPS for 24 h. N = 3 per group. C and D Representative western blotting and quantification of Pan-Kla and H3K9la in primary microglia treated with or without C646 (10 mM) for 30 min then stimulated with 0.2 μg/mL LPS for 24 h. N = 3 per group. E and F Representative western blotting and quantification of TNF-α, iNOS, and NLRP3 in primary microglia treated with or without C646 (10 mM) for 30 min then stimulated with 0.2 μg/mL LPS for 24 h. N = 3 per group. G p300 mRNA expression in primary microglia transfected with si-NC or si-p300. N = 3 per group. H and I Representative western blotting and quantification of P300, Pan-Kla and H3K9la in primary microglia transfected with si-NC or si-p300 stimulated with or without 0.2 μg/mL LPS for 24 h. N = 3 per group. J Cbp mRNA expression in primary microglia transfected with si-NC or si-Cbp. N = 3 per group. K and L Representative western blotting and quantification of Pan-Kla and H3K9la in primary microglia transfected with si-NC or si-Cbp then stimulated with or without 0.2 μg/mL LPS for 24 h. N = 3 per group. Data are shown as the mean ± SEM. Data were analyzed using one-way ANOVA followed by Tukey’s multiple comparisons test. Compared to PBS group, #P < 0.05, ##P < 0.01, ###P < 0.001, ####P < 0.0001; compared to LPS group, *P < 0.05, **P < 0.01, ***P < 0.001, ****P < 0.0001.

References

    1. Kalia, L. V. & Lang, A. E. Parkinson’s disease [J]. Lancet386, 896–912 (2015). - PubMed
    1. Feigin, V. L. et al. Global, regional, and national burden of neurological disorders, 1990–2016: a systematic analysis for the Global Burden of Disease Study 2016 [J]. Lancet Neurol.18, 459–480 (2019). - PMC - PubMed
    1. Stokholm, M. G. et al. Assessment of neuroinflammation in patients with idiopathic rapid-eye-movement sleep behaviour disorder: a case-control study [J]. Lancet Neurol.16, 789–796 (2017). - PubMed
    1. Harms, A. S., Ferreira, S. A. & Romero-Ramos, M. Periphery and brain, innate and adaptive immunity in Parkinson’s disease [J]. Acta Neuropathol.141, 527–545 (2021). - PMC - PubMed
    1. Long-Smith, C. M., Sullivan, A. M. & Nolan, Y. M. The influence of microglia on the pathogenesis of Parkinson’s disease [J]. Prog. Neurobiol.89, 277–287 (2009). - PubMed

LinkOut - more resources