. 2025 Jan;10(1):144-157.
doi: 10.1038/s41564-024-01886-5. Epub 2025 Jan 3.

Bacteria use exogenous peptidoglycan as a danger signal to trigger biofilm formation

Affiliations

Bacteria use exogenous peptidoglycan as a danger signal to trigger biofilm formation

Sanika Vaidya et al. Nat Microbiol. 2025 Jan.

Abstract

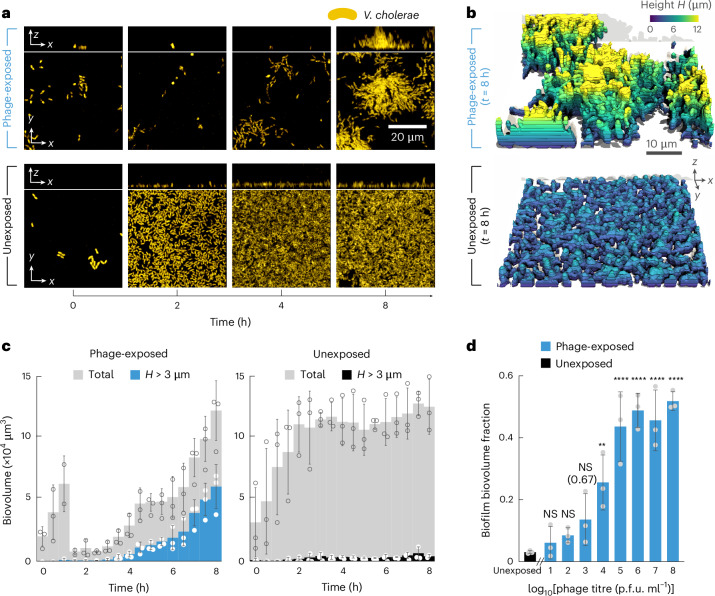
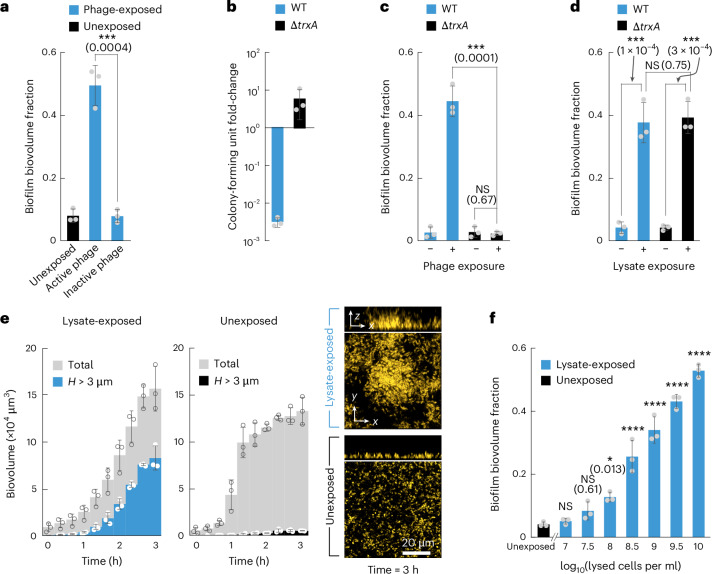
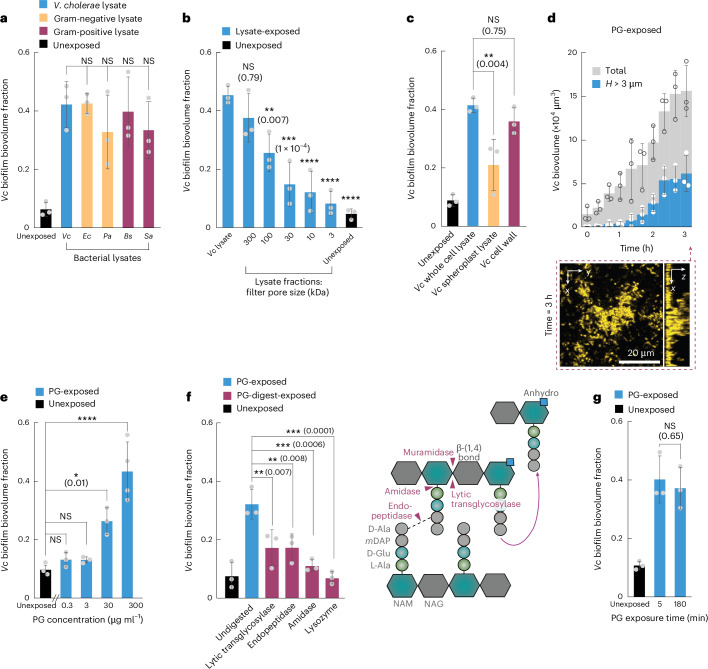
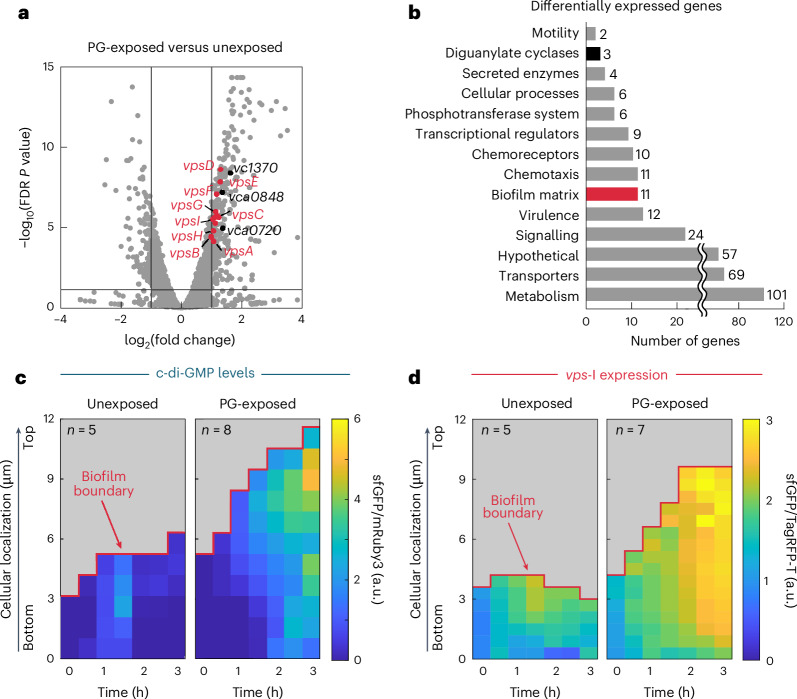
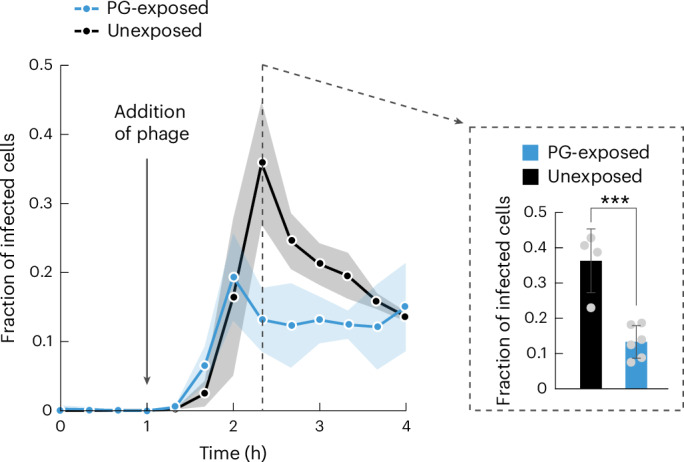
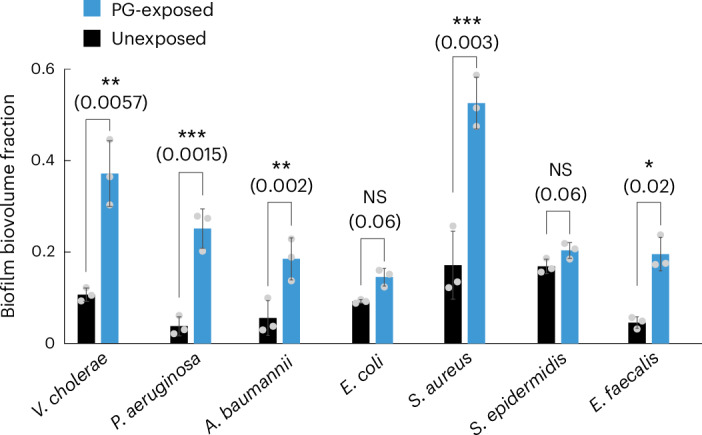
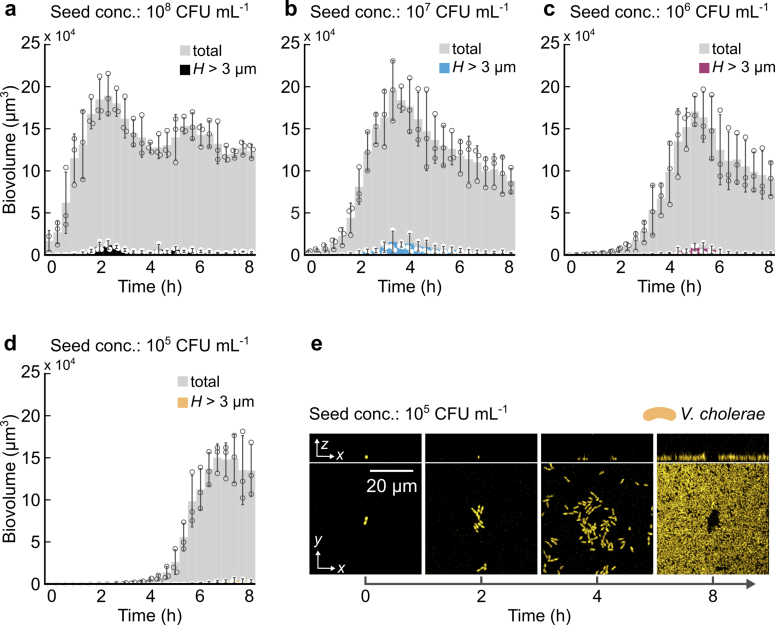
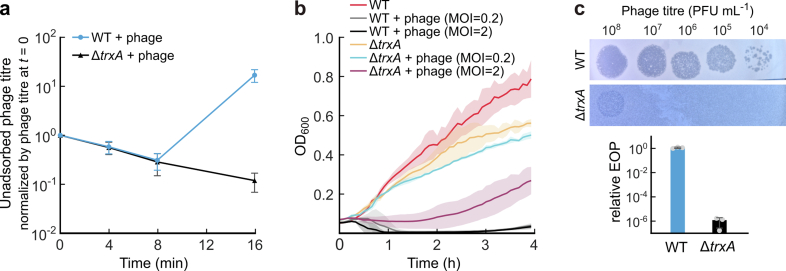
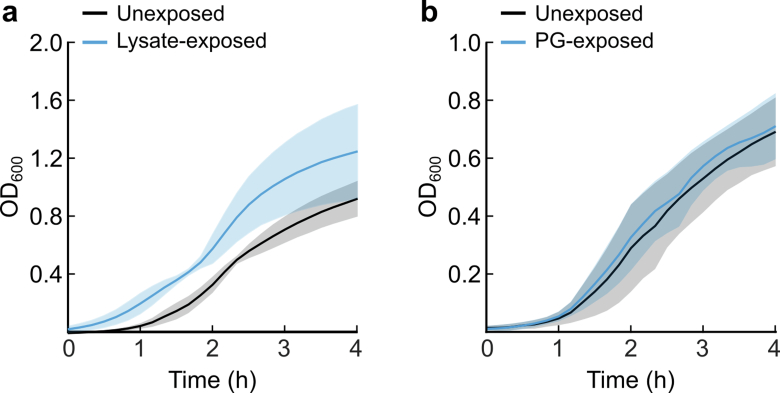
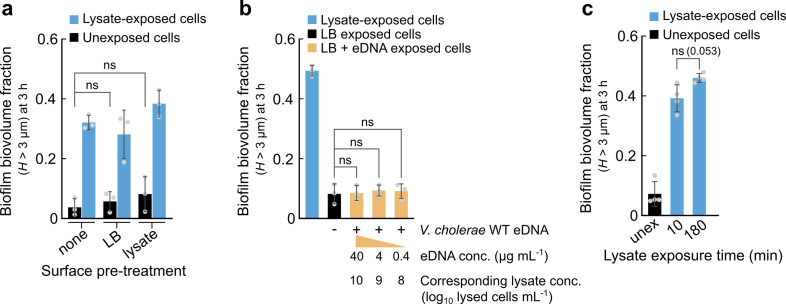
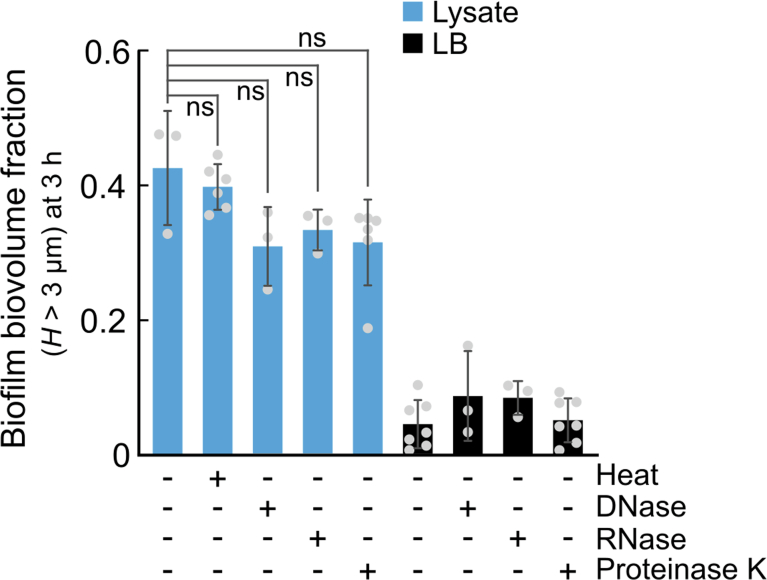
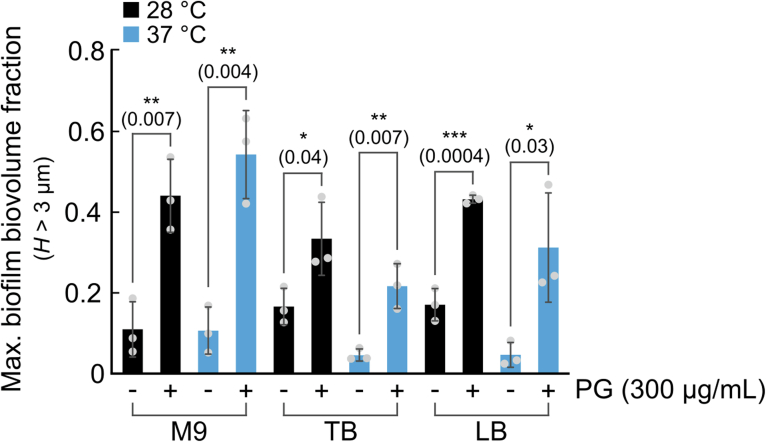
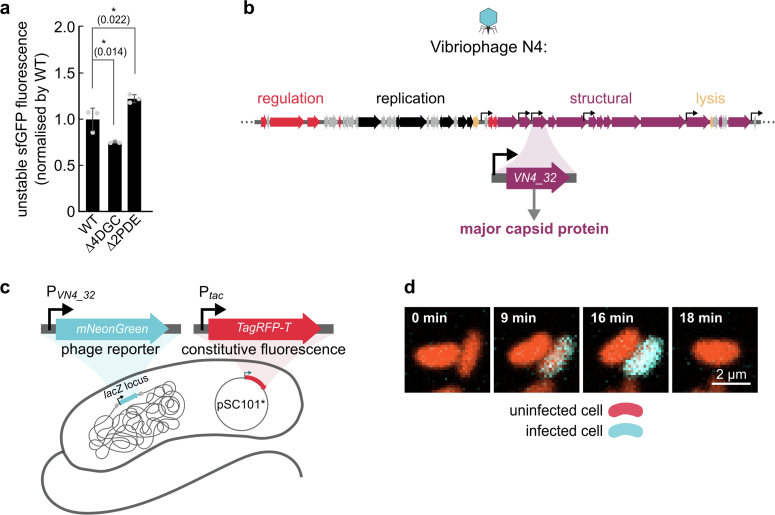
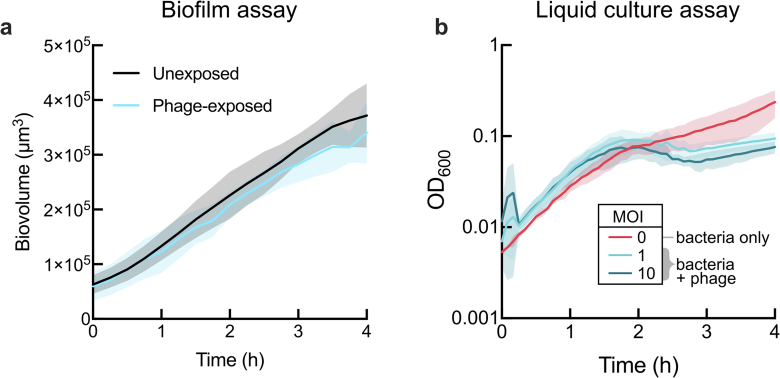
For any organism, survival is enhanced by the ability to sense and respond to threats in advance. For bacteria, danger sensing among kin cells has been observed, but the presence or impacts of general danger signals are poorly understood. Here we show that different bacterial species use exogenous peptidoglycan fragments, which are released by nearby kin or non-kin cell lysis, as a general danger signal. Using microscopy and gene expression profiling of Vibrio cholerae, we find that even brief signal exposure results in a regulatory response that causes three-dimensional biofilm formation, which protects cells from a broad range of stresses, including bacteriophage predation. A diverse set of species (Pseudomonas aeruginosa, Acinetobacter baumannii, Staphylococcus aureus, Enterococcus faecalis) also respond to exogenous peptidoglycan by forming biofilms. As peptidoglycan from different Gram-negative and Gram-positive species triggered three-dimensional biofilm formation, we propose that this danger signal and danger response are conserved among bacteria.


Conflict of interest statement

Competing interests: The authors declare no competing interests.

Figures

Fig. 1
Fig. 1. V. cholerae forms 3D biofilms following phage exposure.
a, Confocal image time series of V. cholerae (shown in yellow, constitutively expressing sfGFP) grown in a flow chamber. At time t = 0 h, cells were exposed to a continuous flow of Vibriophage N4 (phage-exposed, 106 p.f.u. ml−1, top row of images) or medium without phages (unexposed, bottom row). Bacterial cells that are continuously exposed to phages show an initial decrease in total biovolume due to phage infection, followed by growth as 3D biofilms. In the absence of phage exposure, cells grow as a surface-covering 2D lawn without 3D structure. b, Rendered images of phage-exposed (top) and unexposed (bottom) V. cholerae cells at t = 8 h. Cells are coloured according to their height H above the bottom surface of the microfluidic chamber. c, Quantification of the total bacterial biovolume (grey) and biovolume with height H > 3 µm over time, when the cells are exposed (blue, left panel) or unexposed (black, right panel) to Vibriophage N4 (106 p.f.u. ml−1). Biovolume is quantified using BiofilmQ as the volume (µm3) occupied by fluorescent bacterial cells. d, 3D biofilm formation increases with increasing phage titre. 3D biofilm formation is quantified here as the ‘biofilm biovolume fraction’, measured after 8 h. The ‘biofilm biovolume fraction’ is defined as the biovolume with height H > 3 µm, divided by the total biovolume. In panels c and d, bars are mean values of n = 3 independent biological replicates, circles indicate individual measurements and error bars indicate the standard deviation. Statistical significances in panel d were calculated relative to the unexposed condition, using a one-way ANOVA (analysis of variance) with Bonferroni’s correction; NS, not significant (P > 0.99, except for unexposed versus phage titre 103 where P = 0.67); **P = 0.0081; ****P < 0.0001. Source data
Fig. 2
Fig. 2. V. cholerae 3D biofilm formation is induced by cell lysate.
a, V. cholerae forms biofilms during exposure to active Vibriophage N4 (106 p.f.u. ml−1; see also Fig. 1d) but not when phages were inactivated by heat treatment (65 °C for 15 min). Biofilm formation is quantified as the 3D biofilm biovolume fraction (biovolume with height H > 3 µm divided by the total biovolume). Measurements were performed after 8 h of exposure to active or inactive virions. b, Following 60 min of phage exposure in liquid shaking culture with MOI = 1, the bacterial colony-forming unit count dropped substantially for the WT due to phage-induced lysis, whereas the ∆trxA mutant was unaffected by phage exposure. c, The ∆trxA mutant did not form 3D biofilms after 8 h of phage exposure (106 p.f.u. ml−1). The WT or ∆trxA mutant did not form 3D biofilms without phage exposure. d, Both the WT and ∆trxA mutant formed biofilms when exposed to a lysate obtained by sonication of WT V. cholerae cells (1010 lysed cells per ml) for 3 h. e, Quantification of the total biovolume (grey) and biovolume with height H > 3 µm, measured in the presence (blue, left panel) or absence (black, right panel) of a lysate obtained by sonication of WT V. cholerae cells (1010 lysed cells per ml). Confocal microscopy images show V. cholerae cells expressing sfGFP (displayed in yellow) after 3 h in the lysate-exposed or unexposed condition. f, Exposure to increasing concentrations of V. cholerae lysate solutions (obtained by sonication) resulted in a higher 3D biofilm biovolume fraction. In all panels (af), bars are mean values of n = 3 independent biological replicates, circles indicate individual measurements and error bars indicate the standard deviation. Statistical significances were calculated between the groups indicated by black lines in panels ad using a two-sided Student’s t-test or relative to the unexposed condition in panel f using a one-way ANOVA with Bonferroni’s correction. Statistical results are given as exact P values in brackets in the graphs, or indicated using the following: NS, not significant (P > 0.99, unless specified otherwise in the figure), ****P < 0.0001. Source data
Fig. 3
Fig. 3. Exogenous PG triggers the V. cholerae 3D biofilm formation program.
a, V. cholerae (Vc) cells grew into 3D biofilms when exposed to lysate (1010 lysed cells per ml, obtained by sonication) of V. cholerae cells (blue bar; see also Fig. 2f) or lysates of other Gram-negative species (yellow bars: Ec, E. coli; Pa, P. aeruginosa) or lysates of Gram-positive species (purple bars: Bs, B. subtilis; Sa, S. aureus). Biofilm formation was quantified as the 3D biofilm biovolume fraction after 3 h of exposure to lysate (or unexposed control). b, Different fractions of a V. cholerae lysate, obtained by filtration with different pore sizes (3–300 kDa), showed reduced biofilm induction capacity for smaller filter pore sizes. The lysate was obtained by sonicating 1010 Vc cells per ml, followed by sterilization using a 0.22 µm filter, followed by fractionation with filters of different pore sizes. c, Comparison of the biofilm induction capacity of different V. cholerae lysates: lysate of WT whole cells (blue, similar to a and Fig. 2f), lysate of cells that lacked a cell wall (spheroplasts, yellow) or cell wall fragments purified from a lysate of WT whole cells (purple), relative to the unexposed condition (black). d, Exogenously added pure PG (300 µg ml−1) induced 3D biofilm formation of V. cholerae. Confocal microscopy image shows V. cholerae cells (yellow, constitutively expressing sfGFP) exposed to PG for 3 h. e, V. cholerae biofilm formation after 3 h of PG exposure increased with increasing concentration of PG. Biofilm formation was quantified as the fraction of 3D biofilm biovolume with height H > 3 µm. We estimate that a PG concentration of 300 µg ml−1, solubilized by sonication, approximately corresponds to the PG concentration in lysate of 1010 lysed cells per ml. f, V. cholerae WT cells were exposed to purified V. cholerae PG (300 µg ml−1 in LB) which was either undigested or treated with enzymes that cleave specific bonds in PG. The scheme illustrates which bonds are cleaved by each enzyme. g, Exposure of V. cholerae WT cells to PG (300 µg ml−1) for only 5 min followed by 175 min of exposure to medium without PG, or exposure to PG for 180 min induced similar levels of 3D biofilm formation. In all panels (ag), bars are mean values of n = 3 independent biological replicates, circles indicate individual measurements and error bars indicate the standard deviation. Statistical significances were calculated as indicated by the black lines (in a, e and f) or relative to the lysate condition (in b) using a one-way ANOVA with Bonferroni’s correction; in panels c and g, a two-sided Student’s t-test was used. Statistical results are given as exact P values in brackets in the graphs or indicated using the following: NS, not significant (P > 0.99, unless specified otherwise in the figure), ****P < 0.0001. Source data
Fig. 4
Fig. 4. The transcriptional response to exogenous PG increases c-di-GMP levels and biofilm matrix production.
a, Transcriptome comparison of V. cholerae WT cells that were exposed to PG for 10 min (300 µg ml−1 in LB) or to the control condition (LB medium without PG) for the same time (n = 3 for each condition). Genes with absolute fold changes >2 and a FDR-adjusted P < 0.05 were considered to be differentially expressed (see Source Data Fig. 4 for a complete list). Genes were functionally categorized using annotations from UniProt, Kyoto Encyclopedia of Genes and Genomes and MicrobesOnline. b, Quantification of the number of genes upregulated during 10 min of PG exposure, for different functional categories, using the same colour scheme as in a. c, Spatiotemporal measurements of a fluorescent c-di-GMP reporter in V. cholerae WT cells treated with PG-exposure (300 µg ml−1, blue) or the control condition (LB without PG, black) over 3 h. The c-di-GMP reporter was quantified as the fold change in unstable sfGFP fluorescent intensity levels normalized by the fluorescence intensity of a constitutive reporter (Ptac-mRuby3). High levels of sfGFP indicate high c-di-GMP levels (see calibration in Extended Data Fig. 9a). The spatiotemporal heat maps indicate averages of n = 5 (unexposed) and n = 8 (PG-exposed) biological replicates. d, Spatiotemporal measurements of a sfGFP-based fluorescence reporter for vps-I operon transcription in V. cholerae WT. Measurements were performed over 3 h in the presence or absence of pure PG (300 µg ml−1). The fluorescence of the sfGFP-based transcriptional reporter was normalized by the fluorescence of a constitutive reporter (Ptac-TagRFP-T). The spatiotemporal heat maps indicate averages of n = 5 (unexposed) and n = 7 (PG-exposed) biological replicates. Source data
Fig. 5
Fig. 5. Biofilm formation in response to exogenous PG protects against phage predation.
Using a phage infection reporter and microscopy, the fraction of infected cells was quantified. PG-exposed cells were less susceptible to infection by 106 p.f.u. ml−1 Vibriophage N4 than unexposed cells. PG exposure was initiated at time t = 0 h, phage exposure was initiated at t = 1 h. Lines indicate the mean of biological replicates (n = 6 for PG-exposed, n = 4 for unexposed), and shaded regions represent the standard deviation. Bar graph shows the difference between PG-exposed and unexposed cells at the time of peak phage infection. Statistical significance was calculated using a two-sided Student’s t-test; ***P = 0.0007. Source data
Fig. 6
Fig. 6. Exogenous peptidoglycan is a conserved signal for inducing biofilm formation in different species.
Biofilm formation of different species was quantified after 3 h of exposure to PG (300 µg ml−1, blue bars) or control conditions (medium without PG, black bars). Among the species are V. cholerae (as a control, similar to Fig. 3e–g), as well as other Gram-negative pathogens (P. aeruginosa, A. baumannii, E. coli) and Gram-positive pathogens (S. aureus, S. epidermidis, E. faecalis). For E. coli and S. epidermidis, the presence or absence of PG did not result in statistically significant differences in 3D biofilm formation. All other species showed enhanced 3D biofilm formation during PG exposure. Bars are mean values of n = 3 independent biological replicates, circles indicate individual measurements, and error bars indicate the standard deviation. Statistical significances were calculated using a two-sided Student’s t-test. Statistical results are given as exact P values in brackets in the graphs. Source data
Extended Data Fig. 1
Extended Data Fig. 1. Vibriophage N4 infection of V. cholerae grown in different media and temperatures.
Each graph displays the infection dynamics in liquid shaking cultures, incubated at a particular temperature (28 °C or 37 °C) and in a particular medium (M9 minimal medium with 0.5% glucose, TB, LB). For each growth condition, phages were added to the bacterial suspension at time = 0 h at different multiplicity of infection (MOI, indicated by different line colours), and OD600 was measured using a plate reader. Thick lines indicate the mean of n = 3 biological replicates and the shaded regions represent the standard deviation. In M9 medium no drop in OD600 was observed in the presence of phages, which indicates that there was no substantial phage-induced lysis. Phage-induced lysis is stronger in LB compared with TB, and stronger at 37 °C compared with 28 °C. Source data
Extended Data Fig. 2
Extended Data Fig. 2. 3D biofilms that formed during phage exposure for 8 h are not composed of phage-resistant cells or matrix hyper-producing cells.
a, Schematic diagram of experimental workflow: Biofilms formed by V. cholerae after 8 h of phage exposure were harvested from flow chambers and separated into individual cells by strong vortexing, followed by two washes with LB to strongly reduce the concentration of phages. These harvested cells, which still contained a low concentration of adsorbed and intracellular phages, were used for the assays described in panels b, and c. b, Harvested V. cholerae cells were transferred to a 96-well plate and either fresh LB (red line) was added, or fresh LB containing purified Vibriophage N4 virions (106 PFU mL−1, blue line) was added, followed by incubation at 37 °C with shaking for 4 h. As a control experiment, exponentially growing V. cholerae WT cells (not previously exposed to phages) were also inoculated with phages (106 PFU mL−1, black line). These experiments show that most of the cells that were harvested from biofilms after 8 h of phage-exposure were still susceptible to phage infection. Lines represent the mean of n = 3 biological replicates and shaded regions indicate standard deviations. c, Harvested V. cholerae cells were isolated as individual colonies and then cultured in 96-well plates to measure their level of biofilm matrix production using the crystal violet assay. Control strains: V. cholerae WT, ∆vpsL (lacking essential matrix component VPS), rugose strain (vpvCW240R allele, resulting in matrix hyper-production). The matrix hyper-producing rugose strain displayed higher biofilm production than the WT and ∆vpsL strain, as described previously. Harvested cells produced a crystal violet biofilm signal that was similar to the WT and ∆vpsL. Bars are mean values of n = 3 independent biological replicates for the rugose, WT and ∆vpsL strains, and n = 84 independent isolates that were harvested from the channels; points denote individual measurements, and error bars represent standard deviations. Statistical significances between the harvested isolates and the WT control and the rugose control were calculated using a two-sided Student’s t-test: ns = not significant (p = 0.7097), and **** is p < 0.0001. Source data
Extended Data Fig. 3
Extended Data Fig. 3. Reduction of the V. cholerae seeding cell density in flow chambers does not result in 3D biofilm formation in the absence of phages.
Experiments were performed at 37 °C in flow chambers through which LB medium was flowed after inoculating the channel with a bacterial seeding population of a given cell concentration, as described in the Methods section. a-d, Quantification of the total biovolume (grey bars) and biovolume with height H > 3 µm (coloured bars) of V. cholerae cells grown in microfluidic chambers with continuous flow without phages. Bacteria were diluted to different starting concentrations for seeding the flow channels: a, 108 CFU mL−1 (black; represents the same condition as Fig. 1c, unexposed); b, 107 CFU mL−1 (blue); c, 106 CFU mL−1 (purple), d, 105 CFU mL−1 (yellow). None of these different seeding concentrations resulted in substantial 3D biofilm formation, that is biovolume above H > 3 µm. Bars are mean values with individual data points denoting n = 3 biological replicates and error bars indicate the standard deviation. e, Confocal image time series of V. cholerae cells (yellow, constitutively producing sfGFP), inoculated at an initial cell density of 105 CFU mL−1, grown in the absence of phages. Source data
Extended Data Fig. 4
Extended Data Fig. 4. The V. choleraetrxA mutant displays less lysis after phage exposure compared to the wild type.
a, Phage adsorption dynamics of V. cholerae WT and ∆trxA cells, following exposure to Vibriophage N4 (MOI = 0.001) at time = 0 min. Unadsorbed phage particles were enumerated by PFU assays and normalized by the initial phage titre at t = 0. Phage adsorption to the bacterial cells was unaffected by the trxA deletion, but the concentration of progeny phages at 16 min after phage exposure is ~100x diminished in the ∆trxA strain, compared to the WT. Points represent the mean of 3 biological replicates and error bars indicate the standard deviation. b, Growth curves in liquid shaking cultures of the WT and ∆trxA strain, either unexposed to phages, or exposed to phages with MOI = 0.2 or MOI = 2 at time = 0 h. Growth of the ∆trxA strain was only weakly affected by phages at MOI = 0.2, and at MOI = 2 there was a growth delay. In contrast, WT cells were strongly affected by phage exposure at both MOI levels. Lines represent the mean of 3 biological replicates and shaded regions indicate the standard deviation. c, The efficiency of plating (EOP) was assayed by spotting 10 µL of phage suspensions with different phage titres onto a lawn of bacterial cells on an LB agar plate, followed by incubation at 37 °C. Images were acquired using a stereomicroscope. The relative EOP was then calculated by dividing the plaque forming units (PFU) by the titre in a phage inoculation spot. The relative EOP measurements indicate that the ∆trxA strain displays severely attenuated phage-induced lysis compared to the WT. Bars are mean values, circles denote 3 biological replicates for each condition, and error bars indicate the standard deviation. Source data
Extended Data Fig. 5
Extended Data Fig. 5. Growth curves of V. cholerae WT in the presence of cell lysate or peptidoglycan (PG).
Cells were inoculated at OD600 = 0.04 and incubated in liquid LB under shaking conditions. Lines represent the mean of n = 3 biological replicates and shaded regions indicate the standard deviation. a, Growth curves of V. cholerae WT either with (blue) or without (black) the addition of lysate (final concentration of 109 lysed cells mL−1). b, Growth curves of V. cholerae WT either with (blue) or without (black) the addition of PG (final concentration of 300 µg mL−1). Source data
Extended Data Fig. 6
Extended Data Fig. 6. Lysate components do not serve as a scaffold for 3D biofilm formation.
a, Treating surfaces with lysate prior to inoculation of V. cholerae cells does not cause 3D biofilm formation in flow chambers. 3D biofilm formation of V. cholerae WT was measured while the cells were either exposed to lysate (109 lysed cells mL−1) or unexposed to lysate (in this case: exposed to LB medium), for flow chambers that were treated with different conditions prior to inoculation of the bacterial cells. The flow chambers were pre-treated for 60 min with either LB, or lysate (109 lysed cells mL−1), or no pre-treatment. Pre-treating the surface of the microfluidic chambers with lysate did not significantly change 3D biofilm formation. b, V. cholerae WT cells that were exposed to varying concentrations of extracellular DNA (eDNA, isolated from V. cholerae WT lysate) did not display biofilm formation, similar to the unexposed condition. c, Exposure of V. cholerae WT cells to lysate (1010 lysed cells mL−1) for only 10 min followed by 170 min of exposure to medium without lysate, or exposure to lysate for 180 min induced similar levels of biofilm formation. For all measurements in this figure, biofilm formation was quantified by calculating the 3D biofilm biovolume fraction, which is the biovolume with height H > 3 μm divided by the total biovolume of the bacterial cells. Bars are mean values with points denoting n = 3 biological replicates for panels a,b and n = 4 biological replicates for panel c. Error bars indicate the standard deviation. For panel a-b, statistical significances were calculated using a one-way ANOVA with Bonferroni’s correction (ns = not significant). In panel a, p > 0.9999 for both tests. In panel b, LB-exposed vs. 40 µg/mL eDNA-exposed yielded p > 0.9999, LB-exposed vs. 4 µg/mL eDNA-exposed yielded p = 0.803, LB-exposed vs. 0.4 µg/mL eDNA-exposed yielded p = 0.941. For panel c, statistical significance was calculated using a two-sided Student’s t test, resulting in p = 0.053. Source data
Extended Data Fig. 7
Extended Data Fig. 7. Heat, DNase, RNase, or proteinase treatment of the cell lysate did not reduce the 3D biofilm induction capacity of cell lysate.
V. cholerae WT cells in microfluidic flow chambers were exposed to lysate of V. cholerae WT cells (obtained by sonication, 1010 lysed cells mL−1 in LB medium) which was subjected to different treatments: heat (80 °C for 20 min), DNase I (1 U mL−1 at 37 °C for 30 min), RNase A (1 µg mL−1 at 37 °C for 30 min), or proteinase K (20 µg mL−1 at 37 °C for 60 min). As control conditions, LB medium that was subjected to the same treatments was flushed into flow chambers seeded with V. cholerae WT cells. The heat or enzyme treatments did not diminish the biofilm inducing capability of the lysate. Bars are mean values of n independent biological replicates, where n is as follows for the different conditions (bar1 corresponds to the left-most bar in the graph and bar9 corresponds to the right-most bar): nbar1 = 3, nbar2 = 6, nbar3 = 3, nbar4 = 3, nbar5 = 6, nbar6 = 7, nbar7 = 3, nbar8 = 3, nbar9 = 7. Circles indicate individual measurements, and error bars indicate the standard deviation. Statistical significances were calculated using a one-way ANOVA with Bonferroni’s correction, with the following results: ns = not significant, where untreated lysate vs. heat-treated lysate yielded p = 0.483, untreated lysate vs. DNase-treated lysate yielded p = 0.115, untreated lysate vs. RNase-treated lysate yielded p = 0.142, untreated lysate vs. proteinase K-treated lysate yielded p = 0.0617. Source data
Extended Data Fig. 8
Extended Data Fig. 8. Exogenous peptidoglycan induces 3D biofilm formation of V. cholerae in different media and temperatures.
V. cholerae biofilm growth in our microfluidic system was measured in the presence (+) or absence (-) of 300 µg mL−1 exogenous peptidoglycan (PG), at a particular temperature (28 °C or 37 °C) and in a particular liquid medium (M9 minimal medium with 0.5% glucose, TB, LB). As growth rates strongly differ between different media and temperatures, we measured the 3D biofilm biovolume fraction with height H > 3 µm in a given growth condition at the time of maximum biofilm height, which is a time that differed between different growth conditions. The time at which the maximum biovolume fraction at heights H > 3 µm occurs is as follows: for M9, t = 7.5-13.5 h at 28 °C and 9-11 h at 37 °C; for TB, t = 3.5-4.5 h at 28 °C and 2.5-5.0 h at 37 °C; for LB, t = 2.5-4.5 h at 28 °C and 2-3 h at 37 °C). In each growth condition, the biofilm biovolume was measured at the same time for the PG-exposed and unexposed condition. In all growth conditions, PG-exposure resulted in a statistically significant enhancement of 3D biofilm formation. Bars indicate the mean of n = 3 biological replicates, error bars indicate the standard deviation and individual data points are shown. Statistical significances were calculated using a two-sided Student’s t-test; * = p < 0.1; ** = p < 0.01; *** = p < 0.001. Exact p-values are given in brackets in the figure. Source data
Extended Data Fig. 9
Extended Data Fig. 9. Fluorescent protein-based reporters for c-di-GMP level and for Vibriophage N4 infection in V. cholerae cells.
a, Calibration results for the c-di-GMP reporter. The reporter is based on the triple-tandem riboswitch Bc3-5, which permits the transcription of the sfGFP-LAA gene, coding for an unstable superfolder-GFP with the LAA degradation tag. The bc3-5-sfGFP-LAA fragment was cloned into a low copy-number plasmid (pSC101*) harboured in V. cholerae. The bar graph shows the quantification of the unstable-sfGFP fluorescent intensity levels in microscopy images, normalized by the mean of the WT level, for three different strains that are known to have different levels of c-di-GMP, which were grown in liquid shaking culture until OD600 = 0.4. The ∆4DGC strain lacks four diguanylate cyclases (∆cdgDcdgKcdgHcdgL), which are proteins that can produce c-di-GMP. The ∆2PDE strain lacks two phosophodiesterases (∆rocScdgJ), which are proteins that can degrade c-di-GMP. The cellular c-di-GMP levels were expected to be intermediate for the WT, low for the ∆4DCG mutant, and high for the ∆2PDE mutant,. The fluorescence levels of the unstable sfGFP correspond qualitatively to the expected c-di-GMP levels. Bars are mean values with points denoting n = 3 biological replicates and error bars indicate the standard deviation. Statistical significances were calculated using a one-way ANOVA with Bonferroni’s correction, yielding p-values that are indicated in brackets in the graph underneath the * symbol. b, To construct the fluorescent protein-based reporter for Vibriophage N4 infection in V. cholerae cells, the promoter of the gene VN4_32 (encoding the major capsid protein) was identified on the Vibriophage N4 genome using PHIRE. c, Schematic drawing of the phage infection reporter system: The phage promoter PVN4_32 was fused to mNeonGreen (cyan) and inserted at the lacZ locus on the V. cholerae chromosome. Constitutive fluorescence was achieved by engineering a Ptac-TagRFP-T (red) construct on a low-copy plasmid (pSC101*). d, Confocal microscopy image time series showing the production of mNeonGreen (cyan) during phage infection, followed by cell lysis. All cells produce TagRFP-T (red). Source data
Extended Data Fig. 10
Extended Data Fig. 10. Growth curves of V. cholerae rugose strain during phage exposure in biofilm and liquid culture conditions.
The V. cholerae rugose strain (KDV1502) carries the vpvCW240R allele, resulting in matrix hyper-production and strong 3D biofilm formation in LB medium, even in the absence of exogenous peptidoglycan. a, Biofilms of the rugose strain were grown in flow chambers in LB medium at 37 °C for 3 h, resulting in 3D biofilm colonies. Then, at time t = 0 h, the inflowing medium was exchanged to LB containing purified phages (107 PFU mL−1), or LB containing no phages, and the biofilm biovolume was monitored using confocal microscopy and analysed using BiofilmQ. The presence of phages only had a small impact on the biofilm biovolume, indicating that the biofilm population is largely protected from phages. Thick lines indicate the mean of n = 3 biological replicates and the shaded regions represent the standard deviation. b, Liquid cultures of the rugose strain were grown in LB medium at 37 °C under shaking conditions. When back-diluting the pre-culture to OD600 = 0.01 at time t = 0 h, purified phages were added and the OD600 was monitored using a plate reader. The drop in OD600 within the first hour of co-incubation with phages indicates that the rugose strain is susceptible to phage infection (see also the phage adsorption and phage release dynamics for the wild type in Extended Data Fig. 4a, for comparison of timescales). The second drop in OD600 around 2 h may result from a second wave of phage infection. Thick lines indicate the mean of n = 3 biological replicates and the shaded regions represent the standard deviation. Source data

References

    1. Gottesman, S. Trouble is coming: signaling pathways that regulate general stress responses in bacteria. J. Biol. Chem.294, 11685–11700 (2019). - PMC - PubMed
    1. LeRoux, M. et al. Kin cell lysis is a danger signal that activates antibacterial pathways of Pseudomonas aeruginosa. Elife4, e05701 (2015). - PMC - PubMed
    1. Bru, J. L. et al. PQS produced by the Pseudomonas aeruginosa stress response repels swarms away from bacteriophage and antibiotics. J. Bacteriol.201, e00383-19 (2019). - PMC - PubMed
    1. Tzipilevich, E., Pollak‐Fiyaksel, O., Shraiteh, B. & Ben‐Yehuda, S. Bacteria elicit a phage tolerance response subsequent to infection of their neighbors. EMBO J.41, e109247 (2022). - PMC - PubMed
    1. Faruque, S. M. et al. Self-limiting nature of seasonal cholera epidemics: role of host-mediated amplification of phage. Proc. Natl Acad. Sci. USA102, 6119–6124 (2005). - PMC - PubMed

MeSH terms