. 2025 Jan;6(1):67-85.
doi: 10.1038/s43018-024-00882-2. Epub 2025 Jan 3.

Circulating tumor cell plasticity determines breast cancer therapy resistance via neuregulin 1-HER3 signaling

Affiliations

Circulating tumor cell plasticity determines breast cancer therapy resistance via neuregulin 1-HER3 signaling

Roberto Würth et al. Nat Cancer. 2025 Jan.

Abstract

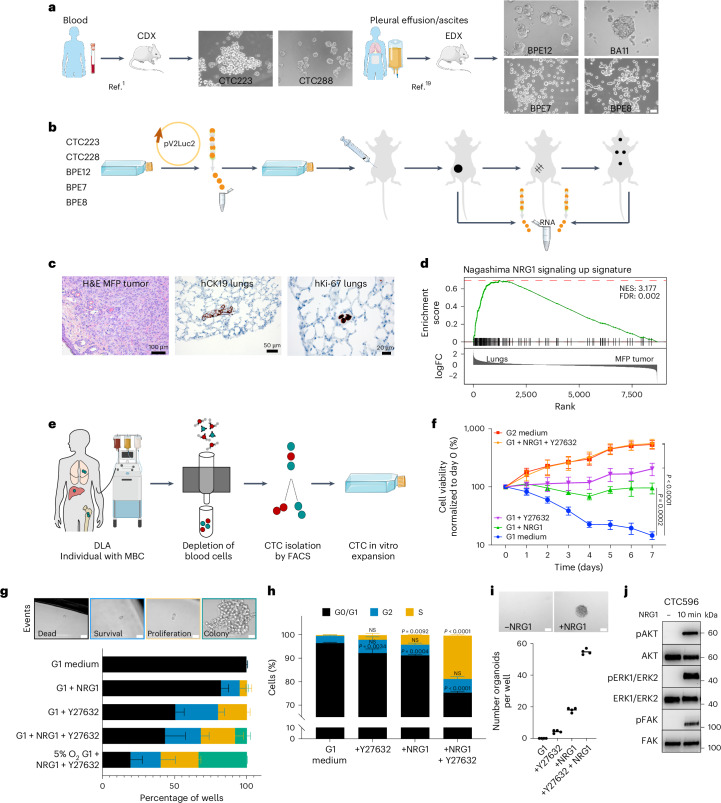
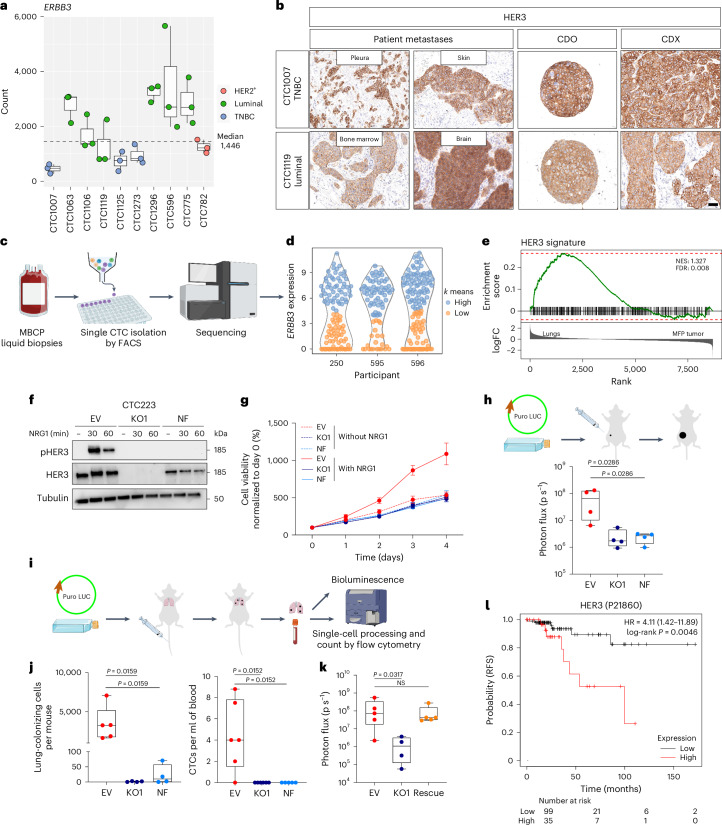
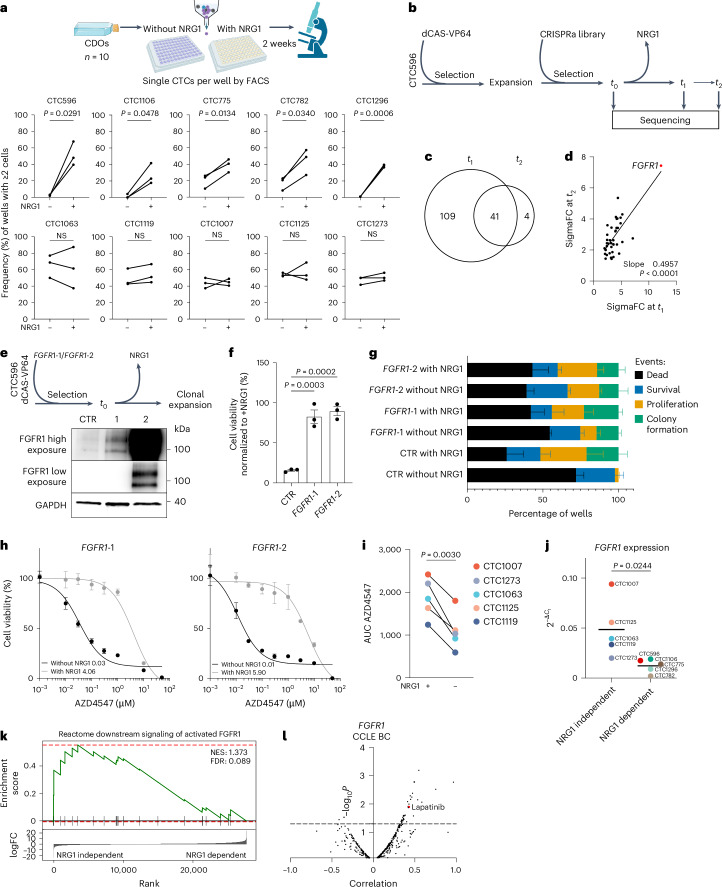
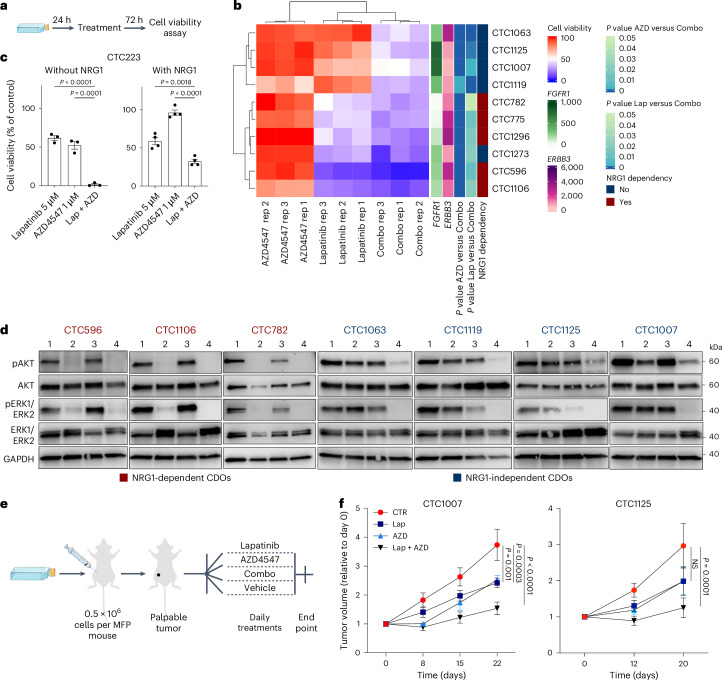
Circulating tumor cells (CTCs) drive metastasis, the leading cause of death in individuals with breast cancer. Due to their low abundance in the circulation, robust CTC expansion protocols are urgently needed to effectively study disease progression and therapy responses. Here we present the establishment of long-term CTC-derived organoids from female individuals with metastatic breast cancer. Multiomics analysis of CTC-derived organoids along with preclinical modeling with xenografts identified neuregulin 1 (NRG1)-ERBB2 receptor tyrosine kinase 3 (ERBB3/HER3) signaling as a key pathway required for CTC survival, growth and dissemination. Genome-wide CRISPR activation screens revealed that fibroblast growth factor receptor 1 (FGFR1) signaling serves a compensatory function to the NRG1-HER3 axis and rescues NRG1 deficiency in CTCs. Conversely, NRG1-HER3 activation induced resistance to FGFR1 inhibition, whereas combinatorial blockade impaired CTC growth. The dynamic interplay between NRG1-HER3 and FGFR1 signaling reveals the molecular basis of cancer cell plasticity and clinically relevant strategies to target it. Our CTC organoid platform enables the identification and validation of patient-specific vulnerabilities and represents an innovative tool for precision medicine.


Conflict of interest statement

Competing interests: B.T. and O.H. are employees of Miltenyi Biotec. Heidelberg Institute for Stem Cell Technology and Experimental Medicine (HI-STEM) has licensed the medium formulation to Miltenyi Biotec. All other authors declare no competing interests.

Figures

Fig. 1
Fig. 1. NRG1 signaling is upregulated in metastasis-initiating cells in vivo and is crucial to establish primary CDOs.
a, CDX and EDX in vitro models. Scale bar, 20 µm. BPE, pleural effusion from a patient with breast cancer; BA peritoneal effusion from a patient with breast cancer b, In vivo preclinical model of spontaneous metastatic formation. c, Representative IHC images of mammary fat pad (MFP) tumor (hematoxylin and eosin (H&E)) and matched lung-colonizing cells detected using human-specific antibodies to CK19 and Ki-67; experiments were repeated three times independently with similar results. d, Gene set enrichment analysis (GSEA) applying the ‘Nagashima NRG1 signaling up’ signature to the dataset of sorted lung-colonizing cells (Lungs) and matched primary tumor cells (MFP tumor); NES, normalized enrichment score; FDR, false discovery rate; FC, fold change. e, CTC isolation and in vitro direct expansion workflow. f, CTC596 cell growth under different medium conditions using the CellTiter Blue (CTB) assay. Mean values were normalized to day 0 for each condition and log10 transformed to enhance approximate normality. Data are shown as mean ± s.e.m.; n = 3 biological replicates for G1 + Y27632 and G1 + NRG1 + Y27632; n = 4 biological replicates for G1, G1 + NRG1 and G2. Data were analyzed by two-way analysis of variance with a Dunnett’s multiple comparisons test; G1 + NRG1, P = 0.0002; G1 + Y27632, G1 + NRG1 + Y27632 and G2, P < 0.0001, each versus G1 medium at day 7. g, Top: clonogenic assay representative brightfield images. Scale bar, 10 μm. Bottom: stacked bar plot showing the percentages of colonies (green), proliferating cells (orange), surviving cells (blue) and dead cells (black). Data are shown as mean ± s.d.; n = 2 biological replicates for 5% O2 G1 + NRG1 + Y27632, G1 + NRG1 + Y27632; n = 3 biological replicates for G1 + Y27632, G1 + NRG1 and G1. h, Cell cycle phase distribution (S (orange), G2 (blue) and G0/G1 (black)) after 48 h under different medium conditions. Data are shown as mean ± s.e.m.; n = 3 biological replicates. Data were analyzed by two-way ANOVA test with a Dunnett’s multiple comparisons test versus G1; NS, not significant; G0/G1: +Y27632, P = 0.0034; +NRG1, P = 0.0004; +NRG1 + Y27632, P < 0.0001. S: +NRG1, P = 0.0092; +NRG1 + Y27632, P < 0.0001. i, Top: representative brightfield images of CTC596 organoids without (left) or with (right) NRG1 (20 ng ml–1). Scale bars, 100 μm. Bottom: organoid quantification. Bars represent the mean, and each dot represents a technical replicate (n = 4). j, Representative western blot showing phosphorylated and total levels of AKT, ERK1/ERK2 and FAK, with or without NRG1 (20 ng ml–1, 10 min). Experiments were repeated two times independently with similar results. Source data
Fig. 2
Fig. 2. Systematic establishment and characterization of long-term CDOs directly from individuals with MBC.
a, MBCP cohort (n = 567). b, Distribution of participants according to CTC number per 7.5 ml of blood using the CellSearch system (Menarini). NA, not available. c, Probability of survival stratified by CTC count in MBCPs (n = 566 participants). Data were analyzed by log rank (Mantel–Cox) test, and the P value of each comparison is reported. d, Left: isolation of CTCs from peripheral blood or effusion products. Right: brightfield images of the CDOs are shown. Scale bar, 50 μm. e, Mutational profile of the top ten most commonly mutated genes in CDOs and matched participant lesions. f, PCA plot using RNA-seq data from CDOs. Different tumor subtypes are indicated with different shapes (HER2+, circle; luminal, triangle; TNBC, square). RNA-seq libraries were prepared in triplicates for each model. g, Representative IHC images for H&E, ER, EpCAM, vimentin and Ki-67 protein expression in CDOs from the CTC1063 luminal subtype and CTC1125 TNBC subtype; n = 1; scale bar, 50 µm. h, Area under the curve (AUC) values for dose–response to alpelisib. A CTB assay was performed after 72 h. Bars represent the median, and each dot represents the AUC mean derived from two independent experiments for each CDO. CDOs were grouped according to PIK3CA status: WT (left, n = 6) and mutated (mut; right, n = 4) CDOs. Data were analyzed by two-tailed unpaired t-test; P = 0.0097. i, CTC numbers in 7.5 ml of blood in longitudinal samples from participant CTC1106. An overview of the treatment regimen is reported; PD, progressive disease; PR, partial response. Dates are shown along the x axis. j, Plot representing the dose–response of CTC1106 (blue, t1) and CTC1106 effusion (gray, t2) CDOs to alpelisib treatment. A CTB assay was performed after 72 h. The CTB fluorescence value was normalized to the viability of cells without the drug. Dots represent the mean; n = 2 biological replicates. The average half-maximal inhibitory concentration (IC50) values are reported. Source data
Fig. 3
Fig. 3. HER3 expression is crucial for CTC growth and survival in vivo.
a, ERBB3 expression; n = 3 biological replicates. Box plots show the median and top and bottom quartiles. Whiskers denote 1.5× the interquartile range. b, Representative IHC images of HER3; n = 1; scale bar, 50 µm. c, scRNA-seq workflow. d, ERBB3 expression in CD45EpCAM+ CTCs. ERBB3hi, turquoise; ERBB3lo, orange. e, GSEA using the HER3 CTC signature on the dataset from Fig. 1b. f, Western blot showing phosphorylated and total levels of HER3 with or without NRG1 (20 ng ml–1; 30 and 60 min) in ERBB3-WT or ERBB3-KO CTC223 cells; n = 1. g, CTB assay with (solid line) or without (dotted line) NRG1. Mean values were normalized to day 0 for each condition. Error bars indicate s.e.m.; n = 4 biological replicates for all conditions but EV without NRG1 day 4 and EV with NRG1 days 2, 3 and 4 (n = 3 biological replicates). Data were analyzed by two-way ANOVA with a Tukey’s multiple comparisons test. h, Top: in vivo tumorigenic assay workflow. Puro, puromycin resistance; LUC, luciferase. Bottom: tumor growth quantification via bioluminescence. Each dot represents a mouse; n = 4 per condition. Box plots show the median and top and bottom quartiles, and whiskers indicate minimum and maximum values. Data were analyzed by two-tailed Mann–Whitney test; KO1 versus EV, P = 0.0286; NF versus EV, P = 0.0286. i, In vivo metastasis assay workflow. j, Box plot showing tumor cell number per mouse (left, EV, n = 5 mice; KO1 and NF: n = 4 mice) and CTC number per ml of blood (right, EV and KO1, n = 6 mice; NF, n = 5 mice). Each dot represents a mouse. Box plots show median values and top and bottom quartiles, and whiskers indicate minimum and maximum values. Data were analyzed by two-tailed Mann–Whitney test (left, KO1 versus EV, P = 0.0159; NF versus EV, P = 0.0159; right, KO1 versus EV, P = 0.0152; NF versus EV, P = 0.0152). k, Box plot showing ex vivo lung bioluminescence intensity. Each dot represents a mouse. Box plots show median values and top and bottom quartiles, and whiskers indicate minimum and maximum values (EV and NF, n = 5 mice; KO1, n = 4 mice). Data were analyzed by two-tailed Mann–Whitney test (KO1 versus EV, P = 0.0317; ERBB3 rescue versus EV, P = 0.8413). l, Relapse-free survival (RFS) in ER+ stage 3 BC according to HER3 protein expression interrogating TCGA RPPA cohort; low, black; high, red; HR, hazard ratio. Source data
Fig. 4
Fig. 4. FGFR1 signaling acts as a compensatory pathway and circumvents HER3–NRG1 dependency in CTCs.
a, Top: clonogenic assay workflow. Bottom: clonogenic assay quantification. Data were analyzed by two-tailed paired t-test (CTC596, P = 0.0291; CTC1106, P = 0.0478; CTC775, P = 0.0134; CTC782, P = 0.0340; CTC1296, P = 0.0006; CTC1063, P = 0.6965; CTC1119, P = 0.0848; CTC1007, P = 0.8611; CTC1125, P = 0.7429; CTC1273, P = 0.1869 with versus without NRG1; n = 3 biological replicates). b, CRISPR–dCas9 genome-wide activation screening workflow. c, Overlapping enriched genes in t1 and t2 compared to t0 (FDR < 0.05, number of gRNAs ≥ 2). d, Correlation plot between SigmaFC at t1 and t2 for overlapping genes (n = 41). A simple linear regression was calculated, and slope and P values are reported. e, Top: validation experiment workflow. Bottom: western blot analysis of CTC596 cells overexpressing FGFR1 (FGFR1-1 and FGFR1-2) and control (CTR, n = 1). f, Viability of CTC596 cells expressing dCas9 (CTR) or overexpressing FGFR1 (FGFR1-1 and FGFR1-2) without NRG1. Values were normalized to CTR cells with NRG1. Bars represent the mean, error bars indicate s.e.m., and each dot represents an experiment (n = 3 biological replicates). Data were analyzed by one-way ANOVA with a Dunnett’s multiple comparisons test (FGFR1-1 versus CTR, P = 0.0003; FGFR1-2 versus CTR, P = 0.0002). g, Clonogenic assay quantification (n = 3 biological replicates). Data were analyzed by two-way ANOVA with a Tukey’s multiple comparisons test. h, Dose–response of FGFR1-overexpressing cells treated with AZD4547 in the presence or absence of NRG1. Bars represent the mean, and error bars indicate s.e.m.; n = 3 biological replicates for all FGFR1-1 conditions but NRG1 0.001 µM (n = 2), and n = 3 for all FGFR1-2 conditions but NRG1 0.001 µM (n = 2) and NRG1 3 µM (n = 1). The average IC50 values are reported. i, AUC values for the NRG1-independent models in response to treatment with AZD4547 with (left) or without (right) NRG1. Each dot represents the AUC mean derived from two independent experiments. Data were analyzed by two-tailed paired t-test; P = 0.0030. j, FGFR1 expression in CDOs grouped according to NRG1 dependency. The bars represent the mean. Data were analyzed by two-tailed unpaired t-test; P = 0.0244. k, GSEA using the Reactome downstream signaling of activated FGFR1 signature as the dataset and RNA-seq data from NRG1-dependent and NRG1-independent CDOs as the gene set. l, Correlation plot between drug sensitivity and FGFR1 expression in BC cell lines. Source data
Fig. 5
Fig. 5. Combined inhibition of NRG1 and FGF signaling leads to CDOs elimination.
a, Experimental design of the drug screening experiment in CDOs. b, Heat map showing relative viability of different CDOs (rows) in the presence of lapatinib (Lap), AZD4547 (AZD) or lapatinb + AZD4547 (combo). Each column represents one biological replicate; each condition has three biological replicates (rep1–3). FGFR1 and ERBB3 expression (RNA-seq normalized counts) as well as statistical analyses (one-way ANOVA with a Dunnett’s multiple comparisons test) were added as additional annotation. A CTB assay was performed after 72 h of treatment. CTB fluorescence values were normalized to the viability of control cells incubated with vehicle only. c, Bar plot showing relative viability of CTC223 cells in response to lapatinib or AZD4547 alone or lapatinb + AZD4547 in the absence (left, n = 3 biological replicates) or presence (right, n = 4 biological replicates) of NRG1. A CTB assay was performed 72 h after treatment. CTB fluorescence values were normalized to the viability of control cells incubated with vehicle only. Bars represent the mean, error bars indicate s.e.m., and each dot represents an experiment. Data were analyzed by one-way ANOVA with a Tukey’s multiple comparisons test (Lap + AZD versus Lap, P < 0.0001; Lap + AZD versus AZD, P = 0.0001 without NRG1; Lap + AZD versus Lap, P = 0.0018; Lap + AZD versus AZD, P < 0.0001 with NRG1). d, Western blot analysis of whole-cell protein lysates derived from CDOs treated with DMSO, lapatinib, AZD4547 or lapatinb + AZD4547 for 12 h. Phosphorylated and total protein kinase B (AKT) and ERK1/ERK2 were detected. GAPDH was used as the loading control; n = 1; lane 1, DMSO; lane 2, 5 μM lapatinb; lane 3, 1 μM AZD4547; lane 4, lapatinb + AZD4547. e, Experimental design of drug treatment in vivo. f, Plots showing increases in tumor volume over time in PDXs treated with vehicle (red), lapatinib (blue), AZD4547 (turquoise) or lapatinib + AZD4547 (black). Tumor volume was measured with a digital caliper and normalized to the volume at baseline (day 0). Data are shown as mean ± s.e.m.; n = 6 mice per group. Data were analyzed by two-way ANOVA with a Tukey’s multiple comparisons test (CTC1007 Lap + AZD versus CTR, P < 0.0001; Lap versus CTR, P = 0.0003; AZD versus CTR, P = 0.001; CTC1125 Lap + AZD versus CTR, P = 0.0001; Lap versus CTR and AZD versus CTR, not significant). Source data
Fig. 6
Fig. 6. FGFR1 expression is functionally relevant in therapy-resistant BC cells.
a, Uniform manifold approximation and projection (UMAP) plot from scRNA-seq analysis from Fig. 3c. Each dot represents one putative CTC, and the color gradient is based on FGFR1 expression. b, Dot plot showing FGFR1, FGFR2, FGFR3 and FGFR4 expression in putative CTCs from each participant (CTC250, CTC595 and CTC596). Below each participant ID, the treatment received before collection of the liquid biopsy is specified (more details are available in Supplementary Table 1). c, Correlation dot plot of HER3, NRG1 and FGFR1 signatures. Mean z scores per CTC were computed for the HER3 signature, the Nagashima NRG1 signature and three FGFR1-related Reactome gene sets and were correlated against FGFR1 expression (exp) and the HER3 and Nagashima signature scores. Pearson correlations were computed per participant using only the non-ERBB3-expressing CTCs. d, Schematic workflow of longitudinal sample collection in the CATCH cohort for transcriptomic analysis. e, Left: box plot showing FGFR1 expression levels assessed by RNA-seq in matched biopsies before and after drug treatment. Treatments are indicated by color. Righ:, box plot showing FGFR1 expression in matched biopsies before and after drug treatment with either PI3Kα inhibitors (pink) or anti-HER2 (turquoise). Each dot represents a participant. f, Growth curve of CTC1106 cells (effusion, t2) in the reported medium. Cells were counted weekly for 1 month. Dots represent the mean; n = 3 technical replicates. g, Plot representing FGFR1 expression in CTC1106 CDOs established from the first (t1, blue; n = 3 biological replicates) and second (t2, gray; n = 2 biological replicates) time points measured. Data were analyzed by two-tailed unpaired t-test; P = 0.0101. h, GSEA using the Reactome downstream signaling of activated FGFR1 signature on data from CTC1106 CDOs established from the first (t1) and second (t2) time points. i, Plot showing the frequency of wells with two or more live cells in a clonogenic assay using CTC1106 models. Counting was performed 14 days after single-cell FACS seeding in CTC medium without NRG1. Data were analyzed by two-tailed paired t-test; P = 0.0024 (n = 4 biological replicates). j, Graphical abstract. Source data
Extended Data Fig. 1
Extended Data Fig. 1. Characterization of CDX and EDX-derived organoids.
a. Oncoprint showing the molecular alterations including the most frequent mutated genes in breast cancer. Targeted-DNA panel sequencing has been performed on longitudinal CDX and EDX-derived CDOs and from the xenograft they have been generated (labelled as ‘xeno’). Different in vitro passages of xenograft-derived CDOs are labelled with p and the number. Pink: possibly amplified; Red: amplified; Light green: possibly deleted, Green: deleted; Mustard: mutation; Azure/Red: partial gene duplication; Azure/Green: partial gene deletion. b. Representative IHC pictures of different CDX- and EDX-derived CDOs, repeated two times independently with similar results. Scale bar 50 µm.
Extended Data Fig. 2
Extended Data Fig. 2. Neuregulin 1 signaling is up-regulated in metastasis-initiating cells in vivo.
a. Heatmap showing the expression levels of the top 1000 most differentially expressed genes. Within each patient, transcriptional profiles clustered based on the sample source: primary tumor ´MFP tumor´ or different metastatic sites: lungs, adrenal gland, brain, liver, spleen. b. Top ten signatures enriched in metastatic cells, using as dataset the sorted lung-colonizing cells (Lungs) and matched cells from the primary tumor (MFP Tumor), ranked according to the -log10 p value (one side) after gene set enrichment analysis (GSEA) with gage R package using the C2 curated gene sets from MSigDB.
Extended Data Fig. 3
Extended Data Fig. 3. CTC medium and NRG1 in plasma.
a. Stacked bar plots showing the percentages of growing colonies (green), proliferating cells (orange), surviving cells (blue) and dead cells (black) in a clonogenic assay. Different media conditions are used (see Material and Methods for more details on media composition). Counting was performed 30 days after single CTC596 cells FACS sorting. Data are shown as mean ± s.d., n = 2 5%O2 G1 + NRG1 + Y27632, G1 + NRG1 + Y27632, G1 + R-spondin, G1+Noggin (NOG), Gremlin-1 (GREM), G1 + SB431542, G1+FGFs, 5%O2 Published medium, Published medium, n = 3 5%O2 G2, G2, G1 + Y27632, G1 + NRG1, G1 biological replicates. b. Stacked bar plots showing live or dead CTC596 cell distribution (healthy (green), early apoptotic (orange), late apoptotic (blue), and necrotic (black)) after 48 (left) and 120 (right) hours in either G1, G2, G2 w/o NRG1, G2 w/o Y27632, or G2 w/o both Y27632 and NRG1 medium. Cell state analysis was determined via flow cytometry after Annexin and Phosphoinositol (PI) staining. Data are mean ± s.e.m, n = 3 biological replicates. two-way ANOVA test, Dunnett´s multiple comparisons test, statistical analysis is reported in Source Data. c. Plot showing NRG1 concentration (pg/ml) in blood samples of metastatic breast cancer patients (MBCPs, n = 7) measured with the Human NRG1 ELISA kit. d. Western blot analysis of whole-cell protein lysate derived from CTC596 cells in absence or presence of NRG1 at different concentrations (0.1, 0.5, 0.8 and 20 ng/ml), including the average NRG1 concentration in the blood of MBC patients (0.8 ng/ml). Phosphorylated and total HER3 and Protein Kinase B (Akt) were detected, tubulin was used as the loading control, n = 1. Source data
Extended Data Fig. 4
Extended Data Fig. 4. Establishment and characterization of long-term CDOs.
a. Donut plot showing successful (Establishment) or unsuccessful (Failed) attempts to obtain long-term CDOs. b. Heatmap showing the logarithm of the odds (LOD) score calculated for pairwise comparisons of RNAseq data from our CDOs and publicly available cell lines (from both human breast and blood cancer). c. Heatmap showing the LOD score calculated for pairwise comparisons of WGS data from primary patient material (buffy coat and tumor lesions) and matched CDOs. d. logR plots showing copy number profiles of primary patient tumor lesions and CDOs. Matched buffy coats were used as germline controls.
Extended Data Fig. 5
Extended Data Fig. 5. Phenotyping and drug sensitivity of long-term CDOs.
a. Representative IHC pictures of different CDOs, n = 1. Scale bar 50 µm. b. Plot showing area under the curve (AUC) values for dose-response to Taselisib. Cells were grouped according to PIK3CA status (wild-type (wt) on the left, n = 6, mutated (mut) on the right, n = 4). CTB assay was performed after 72 hours. Each dot represents the AUC mean obtained from n = 5 CTC1106, n = 3 CTC1063, CTC1007, CTC1125, n = 2 CTC1119, CTC782, CTC775, CTC596, CTC1273, CTC1296 biological replicates. Two-tailed Unpaired t test: p = 0.0136. c. Plot representing the dose response of CTC1106 CDO T1 (blue) and CTC1106 CDO T2 (grey) to Taselisib. CTB assay was performed after 72 h. The CTB fluorescence value was normalized to the viability of cells without the drug. Bars represent the mean, error bars indicate standard error of the mean, n = 5 T1, n = 3 T2 biological replicates. The average IC50 values are reported (µM). d. Boxplots showing EGFR, ERBB2, ERBB4 expression using RNAseq normalized counts from CDOs, n = 3 biological replicates. Boxplots show low and upper quartiles and median line is indicated. Whiskers, 1.5 × interquartile range. Dashed line represents the median expression. RNAseq libraries have been prepared in triplicates for each of the CTC models. Source data
Extended Data Fig. 6
Extended Data Fig. 6. HER3 expression and scRNAseq of CTCs.
a. Representative IHC picture for HER3 protein expression in patient primary tumor and metastatic lesions (left), in vitro CTCs Derived Organoids (CDO) (middle) and xenograft (CDX) (right), n = 1. Scale bar, 50 μm b. UMAP plot from scRNAseq analysis. Each dot represents one putative CTC, the color gradient is based on the origin (patient) of the cells. c. UMAP plot from scRNAseq analysis. Each dot represents one putative CTC, the color gradient is based on the expression of the indicated gene. d. Violin plot representing mean z-scores per cell for ERBB3high and ERBB3low cell populations. Z-score was computed for each signature gene and the mean of all z-scores was calculated for each cell. Two side t-test. e. Scatter plot of mean z-score over HER3-signature genes against mean z-score over NRG1-signature genes (Nagashima). Each point represents a cell colored according to the patient of origin. Coefficient of determination (R2) and p-value result from Pearson´s correlation between the NRG1 mean z-scores and the HER3 mean z-scores is reported.
Extended Data Fig. 7
Extended Data Fig. 7. HER3 functional role in vivo.
a. Histogram showing representative flow-cytometry analysis for HER3 expression at the plasma membrane in CTC223 cells transduced with empty vector (EV, red) or two different gRNAs (KO in blue and NF in turquoise), n = 1. Experiments were repeated at least three times independently with similar results. b. Boxplot showing the quantification of luminescence signal from transplanted cells (CTC223 cells (EV (red), ERBB3 KO (blue), and NF (turquoise)) in the mammary fat pad (MFP) of female NSG mice at the day of injection. Each dot represents a mouse, boxs show low and upper quartiles and median line is indicated, whiskers indicate minimum and maximum value, n = 4 mice. Two-tailed Mann Whitney test, ns: not significant vs EV. c. Boxplot showing tumor weight in grams at end point. Each dot represents a tumor, n = 4 per condition, boxes show low and upper quartiles and median line is indicated, whiskers indicate minimum and maximum value. Two-tailed Unpaired t test, KO1 vs EV: p = 0.0286, NF vs EV: p = 0.0009. d. Representative flow-cytometry plots of lung-colonizing cells at end point. Tumor cells are defined as Blood Lineage and EpCAM+. HER3 expression was checked. e. Boxplot showing lung bioluminescence intensity at the day (day 0) of the intravenous (tail vein) injection of CTC223 cells. Each dot represents a mouse, boxs show low and upper quartiles and median line is indicated, whiskers indicate minimum and maximum values, n = 6 mice. Two-tailed Mann Whitney test, ns: not significant vs EV. f. Boxplot showing ex vivo lung bioluminescence intensity at end point from intravenous injection of CTC223 cells. Each dot represents a mouse, boxs show low and upper quartiles and median line is indicated, whiskers indicate minimum and maximum values, EV, KO1: n = 6, NF: n = 5 mice. Two-tailed Mann Whitney test, KO1 vs EV: p = 0.0022, NF vs EV: p = 0.0043. g. Image of ex vivo lung bioluminescence from Fig. 3i,j and Extended Data Fig. 7f. h. Plot representing the blood volume used to detected CTCs at the end point of the metastatic assay. Each dot represents one mouse, mean ± s.d. id indicated, EV, KO1: n = 6, NF: n = 5 mice. One-way ANOVA, Tukey´s multiple comparisons test, the p value of each comparison is reported. Source data
Extended Data Fig. 8
Extended Data Fig. 8. HER3 expression and breast cancer patient survival.
Kaplan-Meier curves indicating the overall survival (OS, left panels) and relapse free survival (RFS, right panels) according to HER3 protein expression (low in black and high in red) using the TCGA RPPA cohort filtered for ER positive breast cancer. First row in the plots all stages (1 + 2 + 3) are included, second row only stage 1 is included, third row only stage 2 is included, bottom plot only stage 3 is included.
Extended Data Fig. 9
Extended Data Fig. 9. FGFR1 expression and its correlation with HER3.
a. Bar plot representing the expression level of FGFR1 after overexpression in CTC596 using two independent guides (FGFR1#1, FGFR1#2). Data are shown as mean ± s.d., n = 2 biological replicates. b. Plots representing the dose response of CTC223 cells to AZD4547 in the presence (grey) or absence (black) of NRG1. CTB assay was performed after 72 h. The CTB fluorescence value was normalized to the viability of cells without the drug. Bars represent the mean, error bars indicate standard error of the mean, n = 3 biological replicates. The average IC50 values are reported (µM). c. Boxplot showing FGFR1 expression (normalized counts) from RNAseq data. Cells are grouped according to NRG1 dependency (CTC1106, CTC596, CTC1296, CTC782, CTC775 NRG1 dependent models on the left, CTC1007, CTC1125, CTC1063, CTC1119, CTC1273 NRG1 independent models on the right). Boxplots show low and upper quartiles and median line is indicated. Whiskers, 1.5 × interquartile range. Two-sided Wilcoxon test was used. d. Boxplots showing FGFR2-3-4 mRNA expression (normalized counts) from RNAseq data. Cells are grouped according to NRG1 dependency (CTC1106, CTC596, CTC1296, CTC782, CTC775 NRG1 dependent models on the left, CTC1007, CTC1125, CTC1063, CTC1119, CTC1273 NRG1 independent models on the right). Boxplots show low and upper quartiles and median line is indicated. Whiskers, 1.5 × interquartile range. Two-sided Wilcoxon test was used. e. Correlation plot between Lapatinib sensitivity (AUC) and FGFR1 expression in n = 33 breast cancer cell lines. Data retrieved from DepMap portal (CTDv2 database). f. Correlation plot between drug sensitivity (n = 543 drugs) and FGFR1 expression in pan-cancer cell lines. Data retrieved from DepMap portal (CTDv2 database). g. Correlation plot between drug sensitivity (n = 543 drugs) and ERBB3 expression in breast cancer cell lines. Data retrieved from DepMap portal (CTDv2 database). h. Correlation plot between AZD4547 sensitivity (AUC) and ERBB3 expression in n = 33 breast cancer cell lines. Data retrieved from DepMap portal (CTDv2 database). Source data
Extended Data Fig. 10
Extended Data Fig. 10. FGFRs expression in CTCs and body weight during in vivo treatments.
a. UMAP plot from scRNAseq analysis. Each dot represents one putative CTC, the color gradient is based on the expression of the indicated gene. b. Plot showing body weights of mice monitored over time in PDX1007 treated with vehicle (red), Lapatinib (blue), AZD4547 (turquoise) or Lapatinib+AZD4547 (black). Data are mean ± standard deviation, n = 6 mice per group. Source data

References

    1. Baccelli, I. et al. Identification of a population of blood circulating tumor cells from breast cancer patients that initiates metastasis in a xenograft assay. Nat. Biotechnol.31, 539–544 (2013). - PubMed
    1. Janni, W. J. et al. Pooled analysis of the prognostic relevance of circulating tumor cells in primary breast cancer. Clin. Cancer Res.22, 2583–2593 (2016). - PubMed
    1. Alix-Panabieres, C. & Pantel, K. Clinical applications of circulating tumor cells and circulating tumor DNA as liquid biopsy. Cancer Discov.6, 479–491 (2016). - PubMed
    1. Gkountela, S. et al. Circulating tumor cell clustering shapes DNA methylation to enable metastasis seeding. Cell176, 98–112 (2019). - PMC - PubMed
    1. Koch, C. et al. Characterization of circulating breast cancer cells with tumorigenic and metastatic capacity. EMBO Mol. Med.12, e11908 (2020). - PMC - PubMed

MeSH terms