. 2025 Jan;57(1):65-79.
doi: 10.1038/s41588-024-02022-z. Epub 2025 Jan 3.

Blood DNA virome associates with autoimmune diseases and COVID-19

Noah Sasa #  1   2   3   4 Shohei Kojima #  5 Rie Koide #  5 Takanori Hasegawa  6 Ho Namkoong  7 Tomomitsu Hirota  8 Rei Watanabe  9   10 Yuumi Nakamura  11   12 Eri Oguro-Igashira  13   14 Kotaro Ogawa  1   15 Tomohiro Yata  1   15 Kyuto Sonehara  1   3   4 Kenichi Yamamoto  1   16   17 Toshihiro Kishikawa  1   2   18 Saori Sakaue  1   19   20   21 Ryuya Edahiro  1   13 Yuya Shirai  1   13   22 Yuichi Maeda  13   14 Takuro Nii  13   14 Shotaro Chubachi  23 Hiromu Tanaka  23 Haruka Yabukami  5 Akari Suzuki  24 Kimiko Nakajima  25 Noriko Arase  26 Takashi Okamoto  27 Rika Nishikawa  28 Shinichi Namba  1   3   4 Tatsuhiko Naito  1   3   4 Ippei Miyagawa  29 Hiroaki Tanaka  29 Masanobu Ueno  29 Yosuke Ishitsuka  9   10 Junichi Furuta  10 Kayo Kunimoto  30 Ikko Kajihara  31 Satoshi Fukushima  31 Hideaki Miyachi  11 Hiroyuki Matsue  11 Masahiro Kamata  32 Mami Momose  33 Toshinori Bito  28 Hiroshi Nagai  28 Tetsuya Ikeda  34 Tatsuya Horikawa  35 Atsuko Adachi  36 Tsukasa Matsubara  37 Kyoko Ikumi  38 Emi Nishida  38 Ikuma Nakagawa  39 Mayu Yagita-Sakamaki  13   14 Maiko Yoshimura  40 Shiro Ohshima  40 Makoto Kinoshita  15 Satoru Ito  41 Toru Arai  42 Masaki Hirose  42 Yoshinori Tanino  43 Takefumi Nikaido  43 Toshio Ichiwata  44 Shinya Ohkouchi  45 Taizou Hirano  46 Toshinori Takada  47 Ryushi Tazawa  48 Konosuke Morimoto  49 Masahiro Takaki  50 Satoshi Konno  51 Masaru Suzuki  51 Keisuke Tomii  52 Atsushi Nakagawa  52 Tomohiro Handa  53 Kiminobu Tanizawa  54 Haruyuki Ishii  55 Manabu Ishida  55 Toshiyuki Kato  56 Naoya Takeda  56 Koshi Yokomura  57 Takashi Matsui  57 Akifumi Uchida  58 Hiromasa Inoue  58 Kazuyoshi Imaizumi  59 Yasuhiro Goto  59 Hiroshi Kida  13   60 Tomoyuki Fujisawa  61 Takafumi Suda  61 Takashi Yamada  62 Yasuomi Satake  62 Hidenori Ibata  63 Mika Saigusa  64 Toshihiro Shirai  64 Nobuyuki Hizawa  65 Koh Nakata  66 Japan COVID-19 Task ForceShinichi Imafuku  67 Yayoi Tada  32 Yoshihide Asano  68   69 Shinichi Sato  69 Chikako Nishigori  28 Masatoshi Jinnin  30 Hironobu Ihn  31 Akihiko Asahina  33 Hidehisa Saeki  70 Tatsuyoshi Kawamura  27 Shinji Shimada  27 Ichiro Katayama  26   71 Hannah M Poisner  72 Taralynn M Mack  72 Alexander G Bick  72 Koichiro Higasa  73   74 Tatsusada Okuno  15 Hideki Mochizuki  15 Makoto Ishii  23   75 Ryuji Koike  76 Akinori Kimura  77 Emiko Noguchi  78 Shigetoshi Sano  25 Hidenori Inohara  2 Manabu Fujimoto  10   26 Yoshikazu Inoue  42 Etsuro Yamaguchi  41 Seishi Ogawa  79   80   81 Takanori Kanai  82 Akimichi Morita  38 Fumihiko Matsuda  73 Mayumi Tamari  8 Atsushi Kumanogoh  13   83 Yoshiya Tanaka  29 Koichiro Ohmura  84 Koichi Fukunaga  23 Seiya Imoto  85 Satoru Miyano  6 Nicholas F Parrish  86 Yukinori Okada  87   88   89   90   91
Collaborators, Affiliations

Blood DNA virome associates with autoimmune diseases and COVID-19

Noah Sasa et al. Nat Genet. 2025 Jan.

Abstract

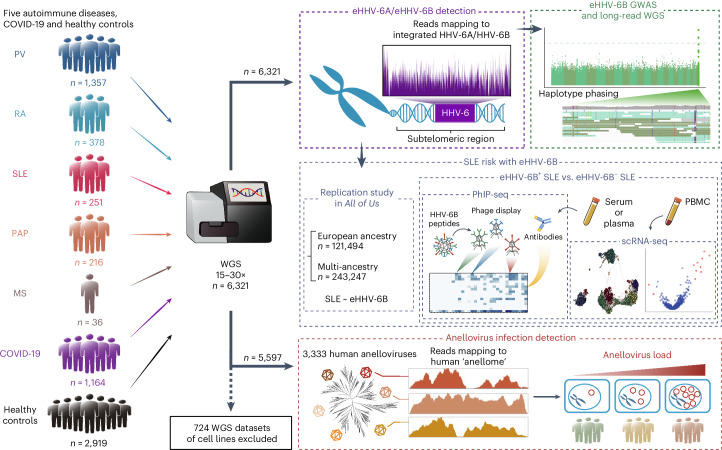
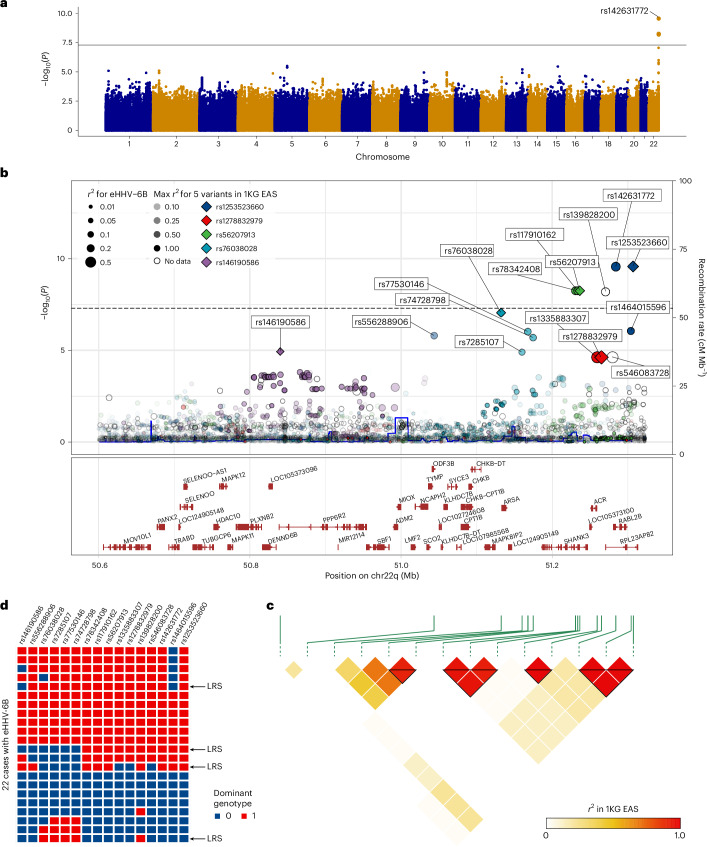
Aberrant immune responses to viral pathogens contribute to pathogenesis, but our understanding of pathological immune responses caused by viruses within the human virome, especially at a population scale, remains limited. We analyzed whole-genome sequencing datasets of 6,321 Japanese individuals, including patients with autoimmune diseases (psoriasis vulgaris, rheumatoid arthritis (RA), systemic lupus erythematosus (SLE), pulmonary alveolar proteinosis (PAP) or multiple sclerosis) and coronavirus disease 2019 (COVID-19), or healthy controls. We systematically quantified two constituents of the blood DNA virome, endogenous HHV-6 (eHHV-6) and anellovirus. Participants with eHHV-6B had higher risks of SLE and PAP; the former was validated in All of Us. eHHV-6B-positivity and high SLE disease activity index scores had strong correlations. Genome-wide association study and long-read sequencing mapped the integration of the HHV-6B genome to a locus on chromosome 22q. Epitope mapping and single-cell RNA sequencing revealed distinctive immune induction by eHHV-6B in patients with SLE. In addition, high anellovirus load correlated strongly with SLE, RA and COVID-19 status. Our analyses unveil relationships between the human virome and autoimmune and infectious diseases.


Conflict of interest statement

Competing interests: The authors declare no competing interests.

Figures

Fig. 1
Fig. 1. Overview of the study design.
We collected 6,321 WGS datasets from patients with five autoimmune diseases (PV, RA, SLE, PAP and MS) and COVID-19 and healthy controls. The datasets were analyzed to detect eHHV-6 and anellovirus infection. In addition, we conducted a large-scale replication study of the association between SLE and eHHV-6 using All of Us WGS data. We conducted GWAS of HHV-6B positivity. We performed long-read sequencing, PhIP-seq and scRNA-seq targeting eHHV-6B-positive patients with SLE (Methods).
Fig. 2
Fig. 2. Prevalence of eHHV-6 and SLEDAI scores for eHHV-6B-positive patients with SLE.
a, Scatter plot of the prevalence of eHHV-6A versus eHHV-6B in participants with five autoimmune diseases, COVID-19 and healthy controls. The marker size indicates the sample size for each disease. The red line indicates that the prevalence of eHHV-6 = 1%. b, Box plot of SLEDAI scores for patients with SLE without and with eHHV-6B. SLEDAI scores in participants with eHHV-6B were significantly higher than those without eHHV-6B (mean SLEDAI = 30.5 and 6.0 for eHHV-6B-positive and eHHV-6B-negative patients with SLE, respectively; two-sided Wald test P = 1.3 × 10−8). The histogram shows the distribution of the number of patients with SLE without and with eHHV-6B (top). The horizontal histogram shows the distribution of SLEDAI scores of patients with SLE without and with eHHV-6B, with different colors (right). Boxes denote the IQR; the median is shown as horizontal bars; whiskers extend to 1.5× IQR; outliers are shown as individual points. IQR, interquartile range.
Fig. 3
Fig. 3. eHHV-6B in Japanese integrated into chr22q.
a, Manhattan plot of common variant-based GWAS of eHHV-6B (22 cases versus 216 controls). The straight line indicates the genome-wide significance level (5 × 10−8). b, Regional association plot for the distal end of chr22q. The dotted line indicates the genome-wide significance level. The 16 variants with P < 1 × 10−4 were labeled by reference SNP ID (rs ID). Color shading represents the maximum value of LD (r2) with each of the lead variants in East Asian populations of 1KG. The circle size indicates LD (r2) with the HHV-6B genome in the present WGS data. c, LD map of the lead variants in East Asian populations of 1KG. d, Heatmap representing the dominant genotype of the 16 variants in 22 eHHV-6B-positive participants. We confirmed that the variants were on the same haplotype in four patients with SLE with eHHV-6B by 30× HiFi long-read sequencing (Extended Data Fig. 1c). Uncorrected P values from the GWAS analysis (two-sided Wald test) are shown in a and b. LRS, long-read sequencing; EAS, East Asian.
Fig. 4
Fig. 4. HHV-6 epitope mapping of antibodies in patients with SLE.
a, Detection of epitopes on HHV-6 proteins. Means of the PhIP-seq scores of the indicated participant groups are shown. Each dot shows a score for a peptide split by a 14 amino acids sliding window applied to HHV-6A and HHV-6B proteins. Specific proteins of interest are labeled. b, Detection of epitopes on the three HHV-6B proteins. Copy numbers of immunoprecipitated phage genomes encoding HHV-6B peptides are shown as a heatmap. Three HHV-6B proteins that harbor abundant epitopes are shown. The region of the IE-A transactivator associated with eHHV-6B positivity is labeled with an orange arrow (amino acids 476–490). c, Statistical association between the presence of eHHV-6 and the copy numbers of immunoprecipitated phage genomes encoding HHV-6 peptides. IE-A transactivator amino acids 476–490 are labeled in orange. Uncorrected P values from the two-sided Wald test are shown. Red horizontal lines show the threshold of P (<0.05) after Bonferroni correction. IS, immunosuppressant use; NC, no antibody control; M, male; F, female.
Fig. 5
Fig. 5. scRNA-seq of PBMCs from eHHV-6B-positive and eHHV-6B-negative patients with SLE.
a, UMAP embedding of scRNA-seq data for all 66,915 PBMCs from the participants with SLE (n = 4 for eHHV-6B-positive and 11 for eHHV-6B-negative). Thirty cell types were defined by RNA expression of marker genes using Azimuth. b, Graphical representation of neighborhoods identified by Milo. Nodes are neighborhoods, colored by neighborhood groups, and their sizes correspond to the number of cells in each neighborhood. Graph edges depict the number of cells shared between adjacent neighborhoods. c, Enriched biological processes by GO analysis of DE genes of each neighborhood group. The total number of DE genes in each group is indicated in brackets. Dot color indicates the statistical significance of the enrichment (adjusted P values via the Benjamini–Hochberg method), and dot size represents the gene ratio annotated to each term. d, Graphical representation of neighborhoods identified by Milo as in b. Node color indicates the difference between the mean of the antiviral ISG scores of cases and the mean of the scores of controls within the neighborhood (spatial FDR < 0.05), comparing eHHV-6B-positive patients with SLE as cases (n = 4) and eHHV-6B-negative patients with SLE as controls (n = 11). Neighborhoods with nonsignificant differences (spatial FDR ≥ 0.05) are colored white. Neighborhoods that contain only cells of either cases or controls are colored black. e, Comparison of differences within each neighborhood group shown in d using a two-sided paired t test. Diff is the average difference between the case and control means. Boxes denote the IQR; the median is shown as horizontal bars; whiskers extend to 1.5 times the IQR. *FDR < 1.0 × 10−10 and **FDR < 1.0 × 10−50. ASDC, Axl+ Siglec-6+ dendritic cell; pDC, plasmacytoid dendritic cell; HPSC, hematopoietic stem and progenitor cell; Treg, regulatory T cell; NK, natural killer; TEM, effector memory T cell; ILC, innate lymphoid cell; MAIT, mucosal-associated invariant T; GDT, γδ T cells; CTL, cytotoxic T cell; Padj, adjusted P value; Nhood, neighborhood.
Extended Data Fig. 1
Extended Data Fig. 1. HHV-6 genome coverage and haplotypes on the distal end of chr22q in four eHHV-6B-positive patients with SLE.
a,b, The mean of HHV-6A/B genome coverages normalized by half of the human genome coverage. The gray shade area represents the 95% confidence interval. Typically, eHHV-6-positive subjects carry the whole HHV-6 genome, but some carry only one of the terminal direct repeats (DRs)—solo-DR—and not the unique (U) region of the HHV-6 genome. All four eHHV-6B-positive patients with SLE carried the whole HHV-6B genome, and two out of three eHHV-6B-positive patients with PAP carried only solo-DR. The mean normalized coverage of full-length HHV-6 was approximately 1, which supports the HHV-6 genomes we found are heritable endogenous viruses. Since the aligner could not distinguish between DR-L and DR-R sequences, solo-DR-derived reads were mapped to both. The mean normalized coverage of solo-DR was approximately 0.5, which also supports the endogeneity of the HHV-6 genome. c, Phased genotypes of the 16 variants with uncorrected P < 1 × 10−4 in GWAS, derived from long-read sequencing of 4 eHHV-6B-positive patients with SLE. Dark red and black boxes indicate haploid visually confirmed with IGV. Light red and blue indicate genotypes from WGS joint genotyping. IGV, Integrative Genomics Viewer.
Extended Data Fig. 2
Extended Data Fig. 2. DA analysis, DE analysis and GO enrichment analysis of scRNA-seq data of PBMCs from eHHV-6B-positive and eHHV-6B-negative patients with SLE.
a, Beeswarm plot showing the distribution of adjusted log2(fold change) in abundance between cases and controls in neighborhoods, with eHHV-6B-positive patients with SLE as case (n = 4) and eHHV-6B-negative patients with SLE as control (n = 11). b, The DE analysis between cases and controls in neighborhood groups as in a. DE genes (FDR < 0.01 and |fold change| > 2) are colored in red and labeled by gene symbols. ce, Left: gene-concept network (cneplot) in neighborhood groups 6, 7 and 18. It shows the linkage of the DE genes and the concepts (GO biological process). The color of the genes represents the fold change values, and the size of the GO terms represents the number of associated genes. Right: directed acyclic graph for GO enrichment analysis in neighborhood groups 6, 7 and 18. Circles represent the GO function, colored by their FDR. Arrows indicate the relationship between the upstream and downstream GO functions.
Extended Data Fig. 3
Extended Data Fig. 3. Comparison of the antiviral ISG scores in patients with SLE on immunosuppressants.
a, Graph representation of neighborhoods identified by Milo as in Fig. 5b. Node color indicates the difference between the mean of the antiviral ISGs scores of eHHV-6B-positive patients (case; n = 3) and eHHV-6B-negative patients (control; n = 6) with SLE on immunosuppressants (spatial FDR < 0.05). Neighborhoods with non-significant differences (spatial FDR ≥ 0.05) are colored white. Neighborhoods that contain only cells of either cases or controls are colored black. b, Comparison of differences within each neighborhood group shown in a using a two-sided paired t-test. Diff is the average difference between the case and control means. Boxes denote the IQR; the median is shown as horizontal bars; whiskers extend to 1.5 times the IQR. *FDR < 1.0 × 10−10, **FDR < 1.0 × 1050.
Extended Data Fig. 4
Extended Data Fig. 4. Reverse cumulative distributions of anellovirus load.
The reverse cumulative distribution plot of anellovirus load in subjects with five autoimmune diseases and COVID-19 and healthy controls. Y-axis indicates the proportions of subjects with anellovirus load > values (x-axis). The proportions of anellovirus infection with anellovirus load >1 were significantly higher in patients with SLE, RA and COVID-19 than in healthy controls. The proportions of anellovirus viremia with anellovirus load >8.0 were significantly higher in patients with SLE, RA and COVID-19 than in healthy controls (dashed lines and asterisks).
Extended Data Fig. 5
Extended Data Fig. 5. Distribution of anellovirus load among various clinical metrics.
Two histograms show the distribution of each axis. a, Strip plot of anellovirus load for patients with SLE without and with low serum complement levels. Anellovirus-positive subjects associated significantly with low serum complement levels (OR 4.4, Wald test uncorrected P = 0.020). NA, not available. b, Strip plot of anellovirus load for patients with SLE treated without and with immunosuppressants. Anellovirus-positive and anellovirus-infected subjects had a significantly positive correlation with immunosuppressant use (OR 3.3 and 7.3, Wald test uncorrected P = 0.0050 and 0.012, respectively). c, Strip plot of anellovirus load for patients with RA stratified by RF and ACPA. All anellovirus-viremic subjects were RF-positive and ACPA-positive. d, Strip plot of anellovirus load for patients with COVID-19 treated without and with oxygen therapy. All subjects with a high anellovirus load were treated with oxygen therapy. Horizontal dashed lines in ad represent thresholds for anellovirus positivity (0.08), anellovirus infection (1.0) and anellovirus viremia (8.0).
Extended Data Fig. 6
Extended Data Fig. 6. The detection limit of the anellovirus load.
Histogram of anellovirus load below 0.2. The colors of the bars indicate the number of ‘anellovirus reads’ in each sample. We set the detection limit of the anellovirus load to 0.08 (red dashed line). Subjects with ‘anellovirus reads’ >5 (anellovirus load >0.08) were defined as anellovirus-positive. Subjects with anellovirus load between 0 and 0.08 might be false-positive.

References

    1. Hardy, T. A., Blum, S., McCombe, P. A. & Reddel, S. W. Guillain–Barré syndrome: modern theories of etiology. Curr. Allergy Asthma Rep.11, 197–204 (2011). - PubMed
    1. Bjornevik, K. et al. Longitudinal analysis reveals high prevalence of Epstein–Barr virus associated with multiple sclerosis. Science375, 296–301 (2022). - PubMed
    1. Lanz, T. V. et al. Clonally expanded B cells in multiple sclerosis bind EBV EBNA1 and GlialCAM. Nature603, 321–327 (2022). - PMC - PubMed
    1. Miller, S. D. et al. Persistent infection with Theiler’s virus leads to CNS autoimmunity via epitope spreading. Nat. Med.3, 1133–1136 (1997). - PubMed
    1. Tokuyama, M. et al. Antibodies against human endogenous retrovirus K102 envelope activate neutrophils in systemic lupus erythematosus. J. Exp. Med.218, e20191766 (2021). - PMC - PubMed

MeSH terms