. 2025 Jan;57(1):115-125.
doi: 10.1038/s41588-024-02030-z. Epub 2025 Jan 3.

Comprehensive genomic characterization of early-stage bladder cancer

Collaborators, Affiliations

Comprehensive genomic characterization of early-stage bladder cancer

Frederik Prip et al. Nat Genet. 2025 Jan.

Abstract

Understanding the molecular landscape of nonmuscle-invasive bladder cancer (NMIBC) is essential to improve risk assessment and treatment regimens. We performed a comprehensive genomic analysis of patients with NMIBC using whole-exome sequencing (n = 438), shallow whole-genome sequencing (n = 362) and total RNA sequencing (n = 414). A large genomic variation within NMIBC was observed and correlated with different molecular subtypes. Frequent loss of heterozygosity in FGFR3 and 17p (affecting TP53) was found in tumors with mutations in FGFR3 and TP53, respectively. Whole-genome doubling (WGD) was observed in 15% of the tumors and was associated with worse outcomes. Tumors with WGD were genomically unstable, with alterations in cell-cycle-related genes and an altered immune composition. Finally, integrative clustering of multi-omics data highlighted the important role of genomic instability and immune cell exhaustion in disease aggressiveness. These findings advance our understanding of genomic differences associated with disease aggressiveness in NMIBC and may ultimately improve patient stratification.


Conflict of interest statement

Competing interests: The authors declare no competing interests.

Figures
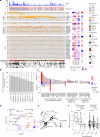
Fig. 1
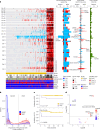
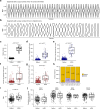
Fig. 1. Genomic landscape of NMIBC.
a, Oncoplot of the 33 significantly mutated genes in the cohort (MutSigCV; mutated in >5% of tumors). The annotations on the right show enrichment for mutations in the UROMOL2021 transcriptomic classes and in tumors with WGD. Statistically significant associations between mutations and the UROMOL2021 classes and WGD were determined using Fisher’s exact test. P values were adjusted using the FDR approach. Dot indicates P < 0.05 and the asterisk indicates P < 0.01. b, Comparison of gene mutations in paired, recurring tumors from 60 patients. Only genes that were mutated in at least ten of the earliest tumors were included. On the x axis, n indicates the number of the earliest tumors with a mutation in the respective gene. Gray bars show the percentage of recurrent tumors where a mutation in the given gene was rediscovered. c, Comparison of mutation frequencies in NMIBC and MIBC. Selected genes include genes significantly mutated in the UROMOL cohort (NMIBC; 33 genes displayed in a) and genes significantly mutated in the TCGA cohort (MIBC). The set of genes significantly mutated in both the NMIBC and MIBC cohorts is listed on the left-hand side, and the set of genes significantly mutated in NMIBC only is listed in the middle and the set of genes significantly mutated in MIBC only is listed on the right-hand side. Fisher’s exact tests were performed to assess differences in mutation frequencies between NMIBC and MIBC, and asterisks indicate genes with significantly different mutation frequencies. Colors represent the OR between the mutation frequency of a gene in NMIBC and MIBC. P values were adjusted using the FDR approach. d, Degree of co-occurrence (red dots) and mutual exclusivity (blue dots) between the 33 significantly mutated genes (a). P values and ORs are listed in Supplementary Table 5. e, Network of significantly co-occurring mutations (OR > 1 and FDR < 0.05 in d). The width of the lines indicates the significance level of the respective associations (thicker lines indicate lower FDR). f, Percentage of mutations attributable to the SBS5 signature stratified by smoking status and ERCC2 mutation status (ERCC2 mutation—15 current smokers, 20 former smokers and 9 never smokers; ERCC2 WT—111 current smokers, 107 former smokers and 28 never smokers). Boxplots represent the median and lower and upper quartiles, and whiskers correspond to the 1.5× interquartile range. Statistically significant differences between groups were determined using two-sided Wilcoxon rank sum tests. Source data
Fig. 2
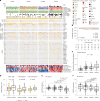
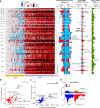
Fig. 2. WGD in NMIBC.
a, Copy-number profile of 362 tumors arranged by the proportion of the genome with a copy number >2. Vertical annotations on the left, definition of chr arms with red lines indicating centromeres (left); chromosomal arm-level events (>70% of the chromosomal arm affected) for diploid tumors (compared to two copies) and tumors with WGD (compared to four copies; left-middle); genome-wide G scores computed by GISTIC2, red and blue bars highlight chromosomal regions that are significantly enriched for focal gains or losses, respectively (right-middle); percentage of diploid tumors with copy-neutral LOH (right). b, Proportion of the genome with a copy number above two in NMIBC and MIBC (TCGA cohort). The dashed line indicates the cut-off (50%) used to define tumors with WGD. c, Kaplan–Meier plot of the probability of PFS as a function of ploidy status for 226 patients that did not receive BCG treatment during their disease course and had available genomic data (top; 206 diploid tumors and 20 tumors with WGD) and a subanalysis including only the 32 tumors classified as UROMOL2021 class 2a (bottom; 25 diploid tumors and 7 tumors with WGD). Statistically significant differences between groups were assessed by two-sided log-rank tests. d, Association between mutations in specific genes and WGD. The dashed line represents an FDR-adjusted P value of 0.05. CN, copy number. Source data
Fig. 3
Fig. 3. CNAs in diploid tumors and tumors with WGD.
a, Percentage of diploid tumors and tumors with WGD with chr arm-level gains and losses when compared to two copies for diploid tumors and four copies for tumors with WGD. The dashed line shows a slope of 1. b, Percentage of tumors with WGD that have losses (copy number < 4) and/or LOH for selected chrs. c, Fraction of tumors with LOH in TP53 stratified by TP53 mutation status and ploidy. Statistically significant associations between groups were determined using the chi-square test. d, GISTIC2-computed G scores reflecting how significantly a region is affected by focal gains in tumors with WGD and diploid tumors. The dashed line shows a slope of 1. e, GISTIC2-computed G scores reflecting how significantly a region is affected by focal losses in tumors with WGD and diploid tumors. The dashed line shows a slope of 1. f, Central proteins in cell cycle regulation. Proteins encoded by genes found to be frequently affected by gain-of-function genomic alterations (mutations and/or gains) in the current study are colored red and proteins encoded by genes found to be frequently affected by loss-of-function genomic alterations (mutations and/or losses) in the current study are colored blue. g, Observed genomic alterations in genes involved in cell cycle regulation stratified by ploidy status. The type of genomic alteration (that is, mutation, gain or loss; left), and the percentage of diploid tumors (yellow) and tumors with WGD (purple; right) with a genomic alteration in the selected genes. h, Percentage of copy-neutral LOH on chr4 in diploid tumors. i, Fraction of copy-neutral LOH and gains affecting FGFR3 in diploid tumors stratified by FGFR3 mutation status. Statistically significant associations between groups were determined using the chi-square test. Source data
Fig. 4
Fig. 4. Gene expression and immunological features associated with WGD.
a, Volcano plot of differentially expressed genes between diploid tumors and tumors with WGD. b, Regulon activity of genes involved in different steps of the cell cycle, from G0 (senescence) to M (mitosis), stratified by ploidy and involvement of the p53 pathway (TP53 mutations and/or MDM2 gain; 219 diploid, WT tumors; 46 diploid, p53 pathway-altered (p53 alt) tumors; 19 WGD, WT tumors; 28 WGD, p53 alt tumors). Statistically significant differences between groups were determined using Kruskal–Wallis tests. c, Estimated RNA-based cell-type scores stratified by ploidy status (265 diploid tumors and 47 tumors with WGD). Statistically significant differences between groups were determined using two-sided Wilcoxon rank sum tests. d, Estimated RNA-based T cell exhaustion scores stratified by ploidy status (265 diploid tumors and 47 tumors with WGD). Statistically significant differences between groups were determined using a two-sided Wilcoxon rank sum test. e, Percentage of PD-1 positive cells in the cancer cell area (excluding stromal areas) assessed by IHC stratified by ploidy status (103 diploid tumors and 20 tumors with WGD). Statistically significant differences between groups were determined using a two-sided Wilcoxon rank sum test. f, Spider plot showing the median z score of gene expression for genes involved in antigen processing and presentation stratified by ploidy status. Asterisks indicate genes with a significantly different gene expression between diploid tumors and tumors with WGD. Statistically significant differences between groups were determined using a two-sided Wilcoxon rank sum test. P values were adjusted using the FDR approach. g, Fraction of tumors with HLA LOH in diploid tumors and tumors with WGD. Statistically significant associations between variables were determined using Fisher’s exact test. Boxplots represent the median and lower and upper quartiles, and whiskers correspond to the 1.5× interquartile range. Source data
Fig. 5
Fig. 5. Integrative clustering analysis.
a, Oncoplot of the 33 genes displayed in Fig. 1a for 230 tumors with somatic mutation, CNA and gene expression data. Tumors are stratified by the four iClusters. The UROMOL2021 class 2a weight was estimated using the WISP tool. The lower panel shows the scaled mean expression values of selected gene signatures. b, Kaplan–Meier plot of the probability of PFS as a function of the iClusters for 229 patients (iClus1, n = 53; iClus2, n = 76; iClus3, n = 43; iClus4, n = 57). Statistically significant differences between groups were determined using a two-sided log-rank test. c, Proportion of bases in an abnormal state for diploid tumors stratified by iClusters (iClus1, n = 53; iClus2, n = 77; iClus3, n = 41; iClus4, n = 31). Abnormal was defined as different from a copy number of two or an imbalanced copy number of two. Statistically significant differences between groups were determined using the Kruskal–Wallis test. d, Estimated RNA-based cell-type scores stratified by iClusters (iClus2, n = 77; iClus4, n = 57). Statistically significant differences between groups were determined using two-sided Wilcoxon rank sum tests. e,f. ERAP1 (e) and ERAP2 (f) gene expression stratified by iClusters (iClus1, n = 53; iClus2, n = 77; iClus3, n = 43; iClus4, n = 57). Statistically significant differences between groups were determined using two-sided Wilcoxon rank sum tests. Boxplots represent the median and lower and upper quartiles, and whiskers correspond to the 1.5× interquartile range. Source data
Extended Data Fig. 1
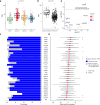
Extended Data Fig. 1. TMB, validation of mutations in RNA-sequencing data and mutations enriched in females.
a, Tumor mutational burden (TMB) stratified by the UROMOL2021 transcriptomic classes (class 1, n = 85; class 2a, n = 122; class 2b, n = 113; class 3, n = 94). Statistically significant differences between groups were determined using a Kruskal–Wallis test. b, TMB in ERCC2 mutated (n = 48) and ERCC2 wild-type (WT; n = 390) tumors. Statistically significant differences between groups were determined using a two-sided Wilcoxon rank sum test. c, Validation of single-nucleotide variants called in the significantly mutated genes from Fig. 1a using RNA-sequencing data. Blue bars show the percentage of mutations observed with at least one read at the RNA level in the subset of patients with both whole-exome and RNA-sequencing data available. Gray bars show the percentage of mutations observed in RNA when removing tumors without an RNA-based mutation with too low coverage (<10 WT reads from RNA-sequencing) to reliably confirm absence of a mutation. d, Allele-specific expression (alternate allele frequency in RNA minus alternate frequency in DNA). Asterisks indicate genes that deviate significantly from zero after correction for multiple testing (false discovery rate (FDR); Supplementary Table 3). e, Enrichment of mutations in females. The dashed lines represent a FDR-adjusted p value of 0.05. OR = odds ratio. Boxplots represent the median, lower and upper quartiles, and whiskers correspond to the 1.5× interquartile range. Source data
Extended Data Fig. 2
Extended Data Fig. 2. Estimated cancer cell fractions and mutations associated with the UROMOL2021 classes.
a, Estimated fraction of cancer cells harboring the mutation outlined for each of the 33 genes displayed in Fig. 1a (excluding genes located on sex chromosomes). Boxplots represent the median, lower and upper quartiles, and whiskers correspond to the 1.5× interquartile range. On the x-axis, n indicates the number of tumors with a mutation in the given gene. The dashed horizontal line indicates the median cancer cell fraction when assessing all mutations. be, Enrichments of mutations in the UROMOL2021 classes. The dashed lines represent a false discovery rate (FDR)-adjusted p value of 0.05. OR = odds ratio. fi. Pairwise comparisons of mutation frequencies in different genes between the UROMOL2021 classes. The dashed lines represent a FDR-adjusted p value of 0.05. Source data
Extended Data Fig. 3
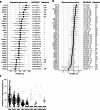
Extended Data Fig. 3. Prognostic value of mutations and contribution of mutational signatures.
a, Forest plot based on univariate Cox proportional hazards regression models of the association between gene mutations and progression-free survival for patients that did not receive BCG treatment (n = 245, 19 events). Black dots indicate hazard ratios (HRs) and horizontal lines show the corresponding 95% confidence intervals (95% CI). P-values were adjusted using the false discovery rate (FDR) approach. b, Forest plot based on univariate Cox proportional hazards regression models of the association between gene mutations and recurrence-free survival for patients that did not receive BCG treatment (n = 232, 135 events). Black dots indicate hazard ratios (HRs) and horizontal lines show the corresponding 95% confidence intervals (95% CI). P-values were adjusted using the FDR approach. c, Contribution of different single-base substitutions (SBS) 96 signatures to the mutational landscape of the 325 tumors having more than 100 single-nucleotide variants. Boxplots represent the median, lower and upper quartiles, and whiskers correspond to the 1.5× interquartile range. Source data
Extended Data Fig. 4
Extended Data Fig. 4. Molecular characteristics of diploid tumors and tumors with WGD.
a, B-allele frequency (BAF) in segments with a copy number of four in tumors classified as having undergone whole-genome doubling (WGD). b, BAF in segments with a copy number of four in tumors classified as being diploid. c, Median ploidy in diploid tumors (n = 308) and tumors with WGD (n = 54). dg, Number of segments with copy-number loss (d), the fraction of the genome with a loss (e), the number of segments with copy-number gain (f) and the fraction of the genome with a gain (g) in diploid tumors (n = 308) and tumors with WGD (n = 54). Loss was defined as a copy number <2 in diploid tumors and <4 in tumors with WGD. Gain was defined as a copy number >2 in diploid tumors and >4 in tumors with WGD. h, Association between the UROMOL2021 classes and tumor ploidy status (class 2a/2b versus class 1/3). i, Tumor mutational burden (TMB) in diploid tumors (n = 308) and tumors with WGD (n = 54). j, Contribution of single-base substitutions (SBS) 96 signatures in diploid tumors (n = 206) and tumors with WGD (n = 50). Boxplots represent the median, lower and upper quartiles, and whiskers correspond to the 1.5× interquartile range. Statistically significant differences between groups were determined using two-sided Wilcoxon rank sum tests (cg,i,j) or Fisher’s exact test (h). Source data
Extended Data Fig. 5
Extended Data Fig. 5. Copy-number alterations and mutations in diploid tumors and tumors with WGD.
a, Co-occurrence of mutations and gene loss in TSC1 and SPTAN1, respectively, in diploid tumors. Statistically significant associations between groups were determined using chi-square test. WT = wild type. b, Co-occurrence of RB1 mutations and RB1 loss stratified by ploidy status. WGD = whole-genome doubling. Loss was defined as copy number (CN) <2 for diploid tumors and <4 for tumors with WGD. CN2 2/0 represents loss of one allele and duplication of the remaining allele. Statistically significant associations between groups were determined using a chi-square test. c, Genomic alterations in genes involved in cell cycle regulation and genes more frequently mutated in tumors with WGD compared with diploid tumors (Fig. 2d). Tumors are stratified by TP53 alteration status. Statistically significant associations between groups were determined using Fisher’s exact tests. Source data
Extended Data Fig. 6
Extended Data Fig. 6. Copy-number alterations in MIBC.
a, Copy-number (CN) profile of 412 tumors from TCGA (muscle-invasive bladder cancer (MIBC)) arranged by the proportion of the genome with a CN > 2. Vertical annotations on the left: definition of chromosome arms with red lines indicating centromeres (left); chromosomal arm-level events (>70% of the chromosomal arm affected) for diploid tumors (compared to two copies) and tumors with WGD (compared to four copies; left-middle); genome-wide G scores computed by GISTIC2, red and blue bars highlight chromosomal regions that are significantly enriched for focal gains or losses, respectively (right-middle); percentage of diploid tumors with copy-neutral loss of heterozygosity (LOH; right). CNAs = copy-number alterations. b,c, GISTIC2-computed G scores of tumors from TCGA reflecting how significantly a region is affected by focal gains (b) and losses (c) in tumors with WGD and diploid tumors. d, Frequency of gains in chromosome (chr) 13 and gains in chr6 in diploid tumors from TCGA stratified by TP53 mutation status. Source data
Extended Data Fig. 7
Extended Data Fig. 7. Gene expression features associated with WGD.
a, False discovery rate (FDR)-adjusted p values of the 10 most upregulated (left) and downregulated (right) reactome pathways in tumors with whole-genome doubling (WGD) as calculated by the enrichPathway function of the ReactomePA R package. HRR = homology-directed repair through homologous recombination, SSA = single-strand annealing, CENPA = centromere protein A, NMD = nonsense-mediated decay, EJC = exon junction complex. b, Regulon activity of genes involved in different steps of the cell cycle, stratified by ploidy status and involvement of the p53 pathway (TP53 mutations and/or MDM2 gain; 219 diploid, wild-type (WT) tumors; 46 diploid, p53 pathway-altered tumors; 19 WGD, WT tumors; 28 WGD, p53 pathway-altered tumors). Statistically significant differences between groups were determined using Kruskal–Wallis tests. p53 alt = altered p53 pathway. c, Expression of genes involved in homology-directed repair stratified in tumors with WGD (n = 47) and diploid tumors (n = 265). Statistically significant associations between groups were determined using two-sided Wilcoxon rank sum tests. d, RNA-based score for neutrophil infiltration stratified by ploidy status and UROMOL2021 classes (class 1, 72 diploid tumors and 2 with WGD (no statistical test performed); class 2a; 59 diploid tumors and 25 with WGD; class 2b, 75 diploid tumors and 15 with WGD; class 3, 59 diploid tumors and 5 with WGD). Statistically significant associations between groups were determined using two-sided Wilcoxon rank sum tests. Boxplots represent the median, lower and upper quartiles, and whiskers correspond to the 1.5× interquartile range. Source data
Extended Data Fig. 8
Extended Data Fig. 8. Molecular features associated with iClusters.
a, Sankey plot showing the association between the UROMOL2021 classes, the iClusters (iClus) and whole-genome doubling (WGD) status of the 230 tumors included in the integrative clustering analysis. b, Class 2a weighted in silico pathology (WISP) weight stratified by iClusters for tumors classified as the UROMOL2021 class 2a (iClus4, n = 26; others, n = 11) and class 2b (iClus4, n = 29; others, n = 48). c, Tumor mutational burden (TMB) stratified by iClusters (iClus1, n = 53; iClus2, n = 77; iClus3, n = 43; iClus4, n = 57). d, TMB stratified by iClusters for diploid tumors (iClus1, n = 53; iClus2, n = 77; iClus3, n = 41; iClus4, n = 31). e, RNA-based immune infiltration score stratified by iClusters (iClus1, n = 53; iClus2, n = 77; iClus3, n = 43; iClus4, n = 57). f, Estimated tumor T cell fraction stratified by iClusters (iClus1, n = 53; iClus2, n = 77; iClus3, n = 43; iClus4, n = 57). The T cell fraction was estimated using whole-exome sequencing (WES) of tumor DNA. g, Adaptive-to-innate immune ratio for tumors in iClus2 (n = 77) and iClus4 (n = 57). Values above 1 indicate a higher adaptive component, whereas values below 1 indicate a higher innate component. h, Estimated blood T cell fraction stratified by iClusters (iClus1, n = 53; iClus2, n = 77; iClus3, n = 43; iClus4, n = 57). The T cell fraction was estimated using WES of germline DNA. i, T cell receptor diversity in blood (Shannon diversity, estimated using WES of germline DNA) stratified by iClusters (iClus1, n = 53; iClus2, n = 77; iClus3, n = 43; iClus4, n = 57). j, Estimated blood T cell fraction stratified by disease progression status (yes, n = 14; no, n = 215). The T cell fraction was estimated using WES of germline DNA. k, T cell receptor diversity in blood (Shannon diversity, estimated using WES of germline DNA) stratified by disease progression status (yes, n = 14; no, n = 215). Boxplots represent the median, lower and upper quartiles, and whiskers correspond to the 1.5× interquartile range. Statistically significant associations between groups were determined using two-sided Wilcoxon rank sum tests or Kruskal–Wallis tests. Source data
Extended Data Fig. 9
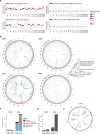
Extended Data Fig. 9. Somatic structural variants in NMIBC assessed by long-read sequencing.
a, Inferred total copy-number (CN) profile estimated from shallow whole-genome sequencing (sWGS) for two tumors with whole-genome doubling (WGD; left) and two diploid tumors (right). UROMOL IDs are shown. Chr = chromosome. b, Circos plots showing structural variants (SVs) estimated from long-read sequencing for two tumors with WGD (U0457 and U1171) and two diploid tumors (U0380 and U0641). c, Number of SV types within each of the four tumors analyzed by long-read sequencing. d, Number of interchromosomal SVs in the four tumors. e, Circos plot presenting the fusion genes called from RNA-sequencing data with DNA evidence from long-read sequencing of tumor U1171. Source data
Extended Data Fig. 10
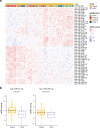
Extended Data Fig. 10. microRNA activity in diploid tumors and tumors with WGD.
a, Heatmap of cross-patient microRNA (miRNA) activities for the 101 miRNAs with differential activities between diploid tumor and tumors with whole-genome doubling (WGD; 312 tumors in total). Statistically significant differences between groups were determined using two-sided Wilcoxon rank sum tests, and p values were adjusted using the Bonferroni method (family-wise error rate (FWER)). miRNAs with an FWER < 0.1 are shown. Hierarchical agglomerative clustering was applied to both rows and columns for visualization purposes. b, miRNA activity of miR-21 and miR-29a for diploid tumors (n = 265) and tumors with WGD (n = 47). Statistically significant differences between groups were determined using two-sided Wilcoxon rank sum tests. Boxplots represent the median, lower and upper quartiles, and whiskers correspond to the 1.5× interquartile range. Source data

References

    1. Sung, H. et al. Global cancer statistics 2020: GLOBOCAN estimates of incidence and mortality worldwide for 36 cancers in 185 countries. CA Cancer J. Clin.71, 209–249 (2021). - PubMed
    1. Dyrskjøt, L. et al. Bladder cancer. Nat. Rev. Dis. Primers9, 58 (2023). - PMC - PubMed
    1. Babjuk, M. et al. European Association of Urology Guidelines on non-muscle-invasive bladder cancer (Ta, T1, and carcinoma in situ). Eur. Urol.81, 75–94 (2022). - PubMed
    1. Dyrskjøt, L. & Ingersoll, M. A. Biology of nonmuscle-invasive bladder cancer: pathology, genomic implications, and immunology. Curr. Opin. Urol.28, 598–603 (2018). - PubMed
    1. Kamoun, A. et al. A consensus molecular classification of muscle-invasive bladder cancer. Eur. Urol.77, 420–433 (2020). - PMC - PubMed

Substances