. 2025 Apr;32(4):740-755.
doi: 10.1038/s41594-024-01417-0. Epub 2025 Jan 3.

ATM and IRAK1 orchestrate two distinct mechanisms of NF-κB activation in response to DNA damage

Affiliations

ATM and IRAK1 orchestrate two distinct mechanisms of NF-κB activation in response to DNA damage

Elodie Bournique et al. Nat Struct Mol Biol. 2025 Apr.

Erratum in

Abstract

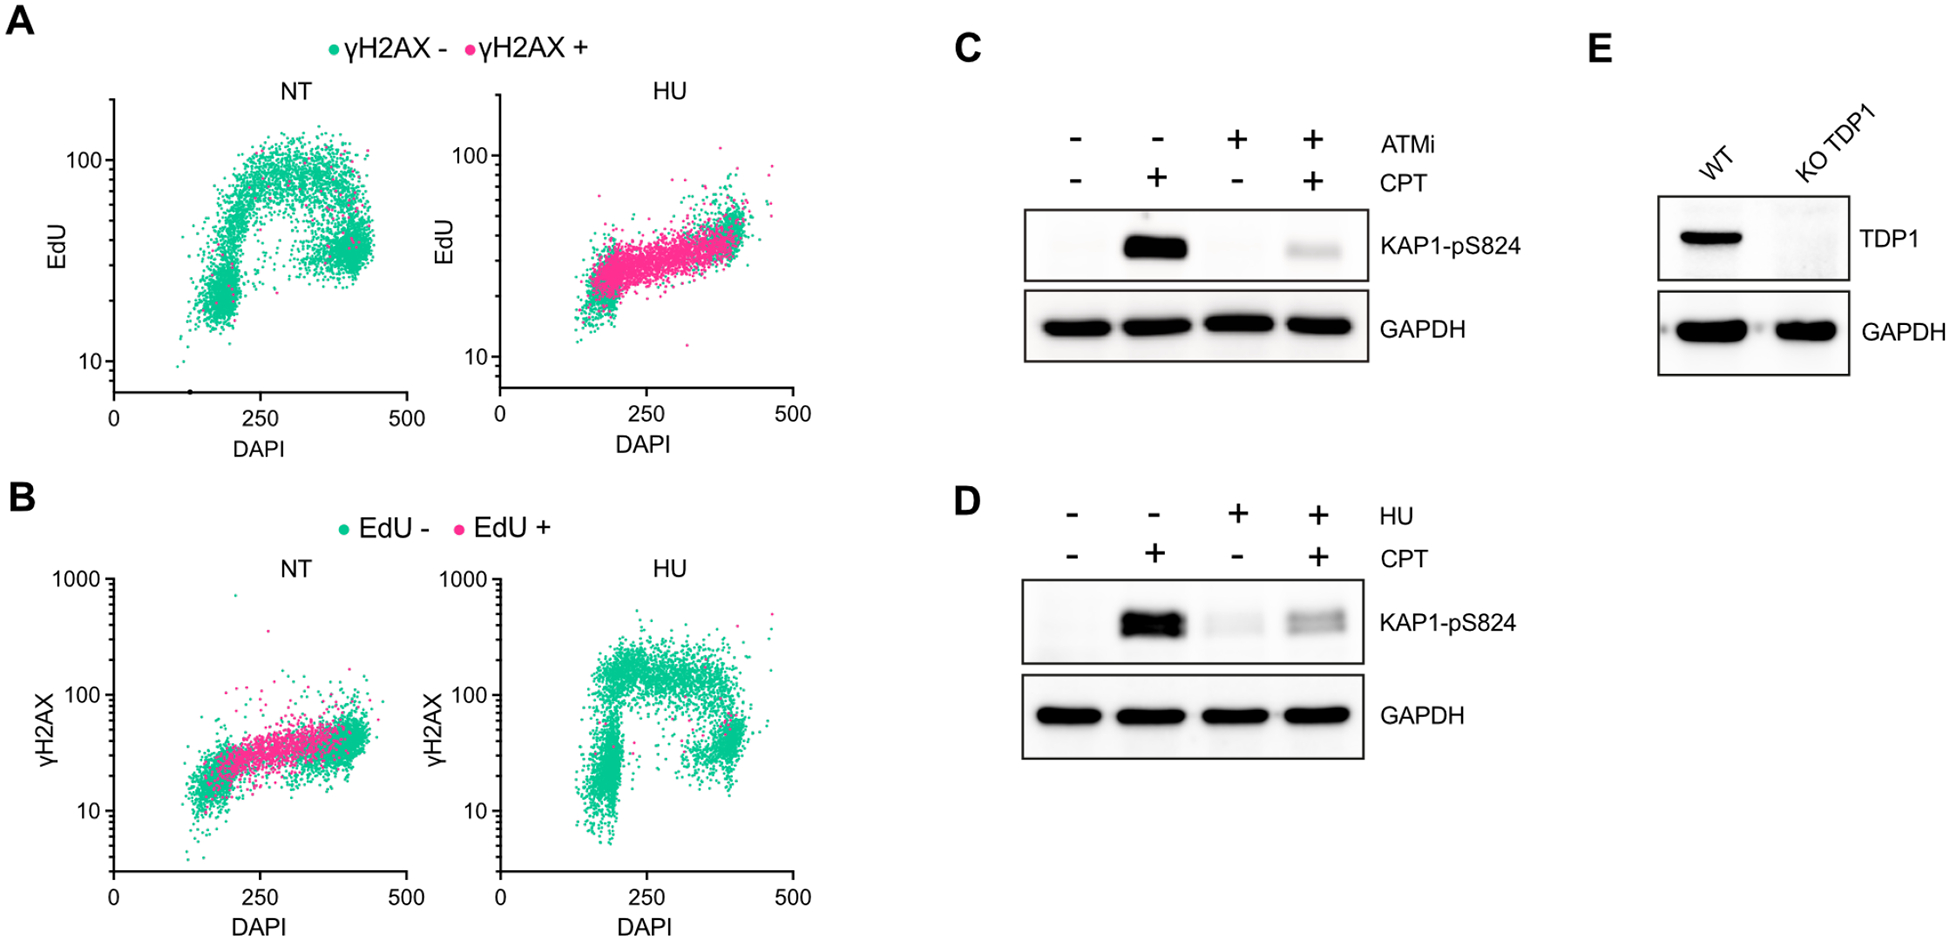
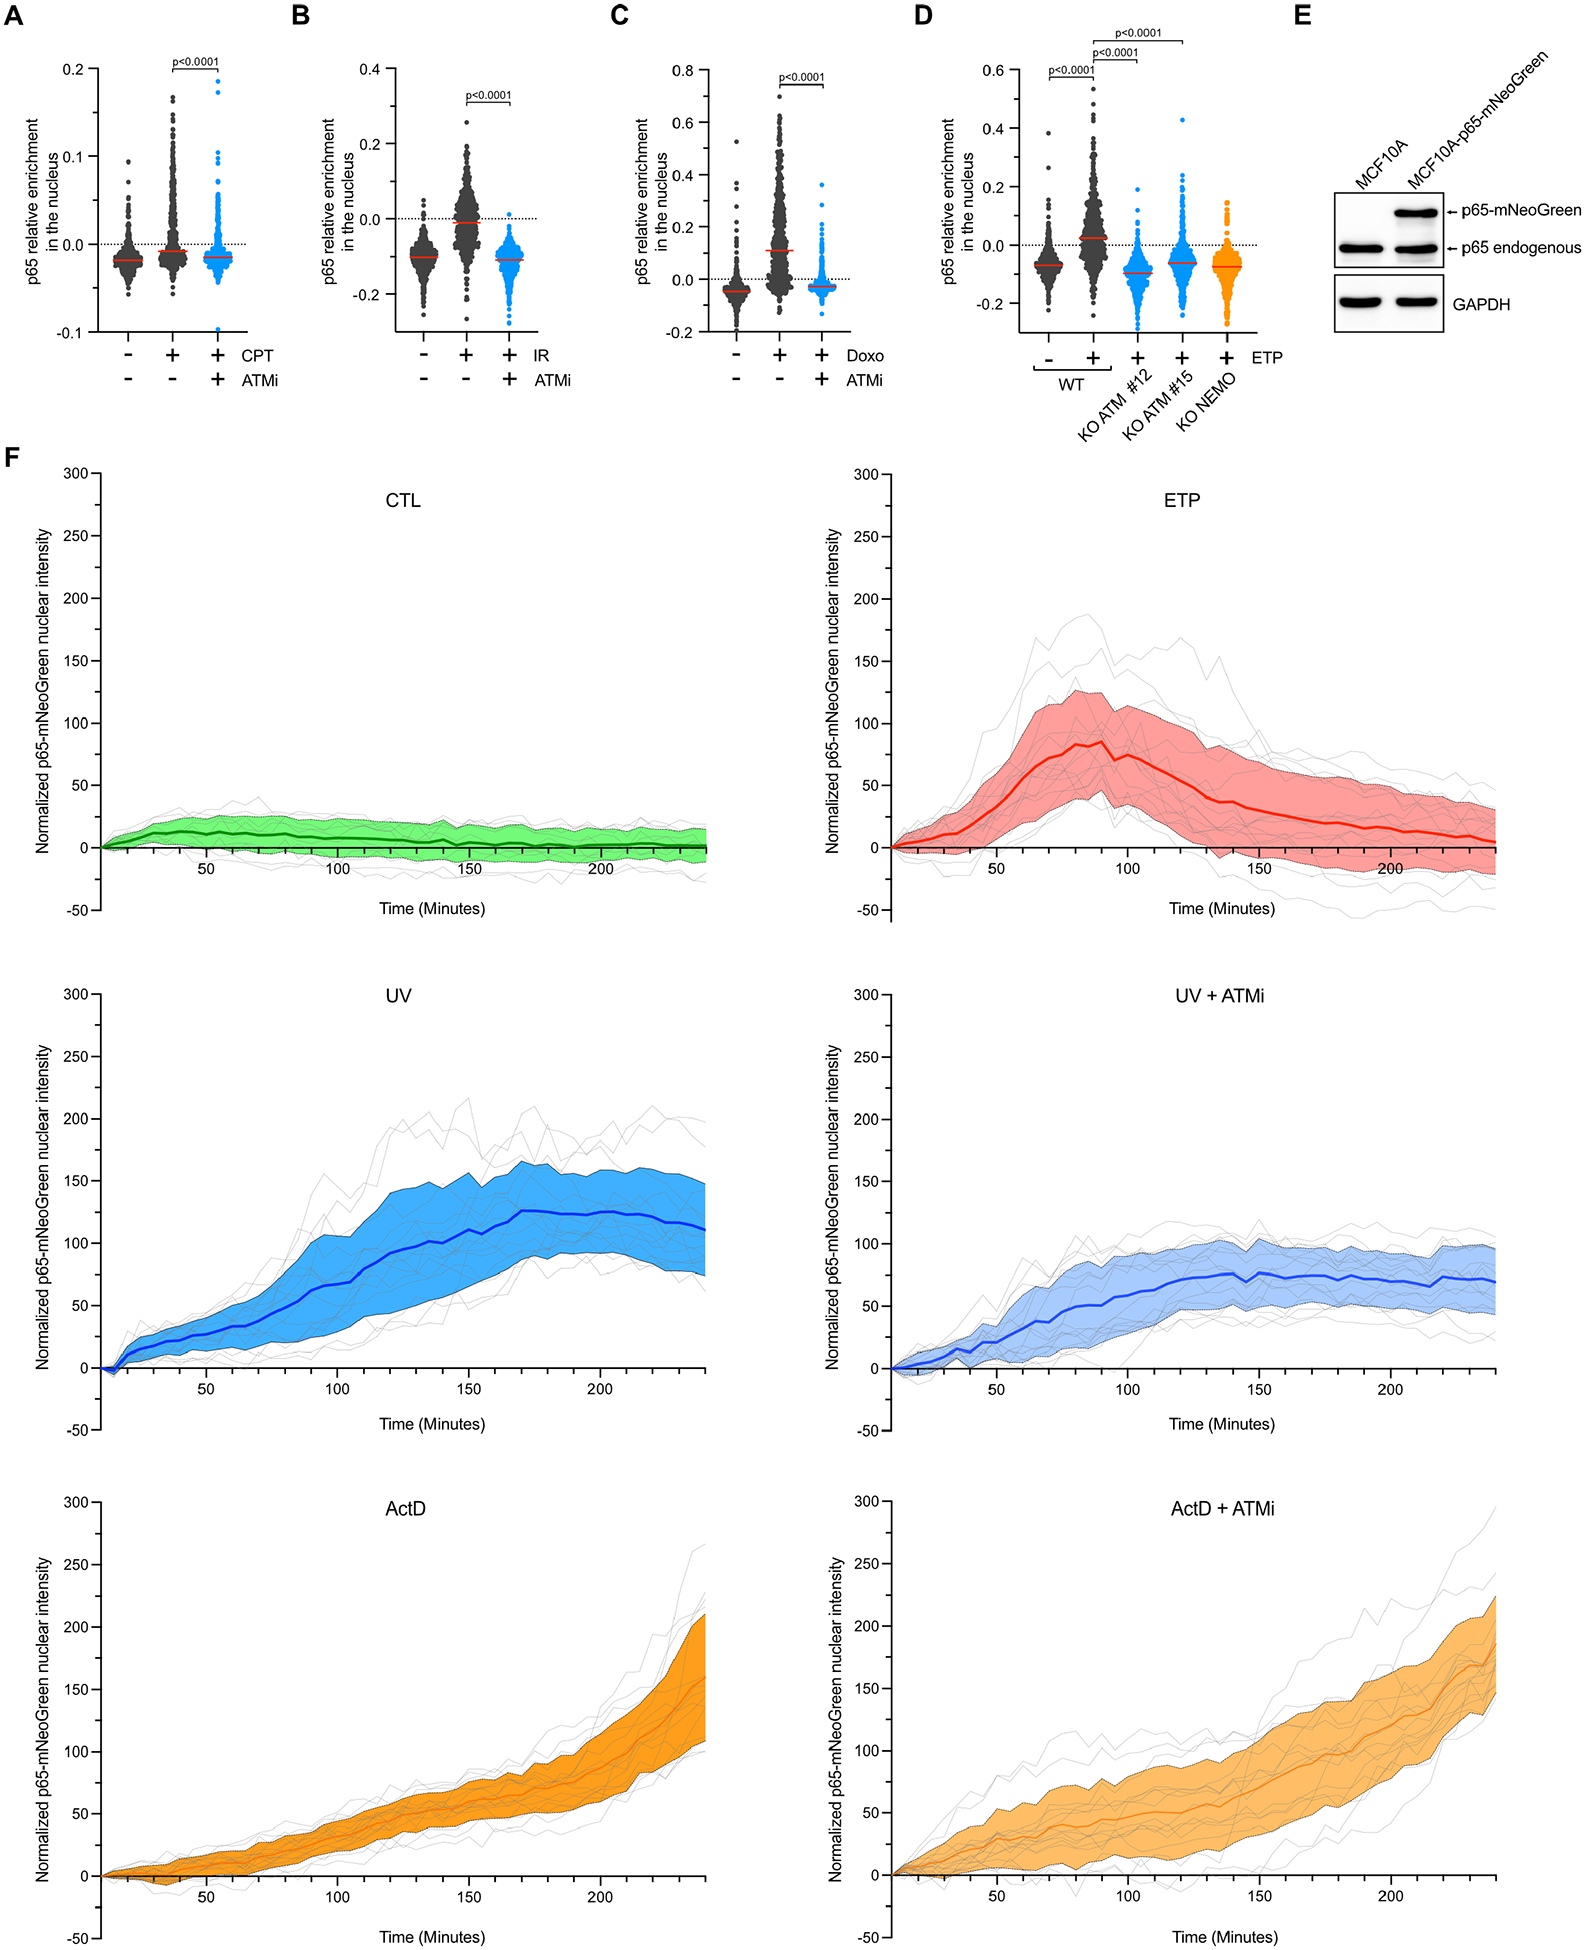
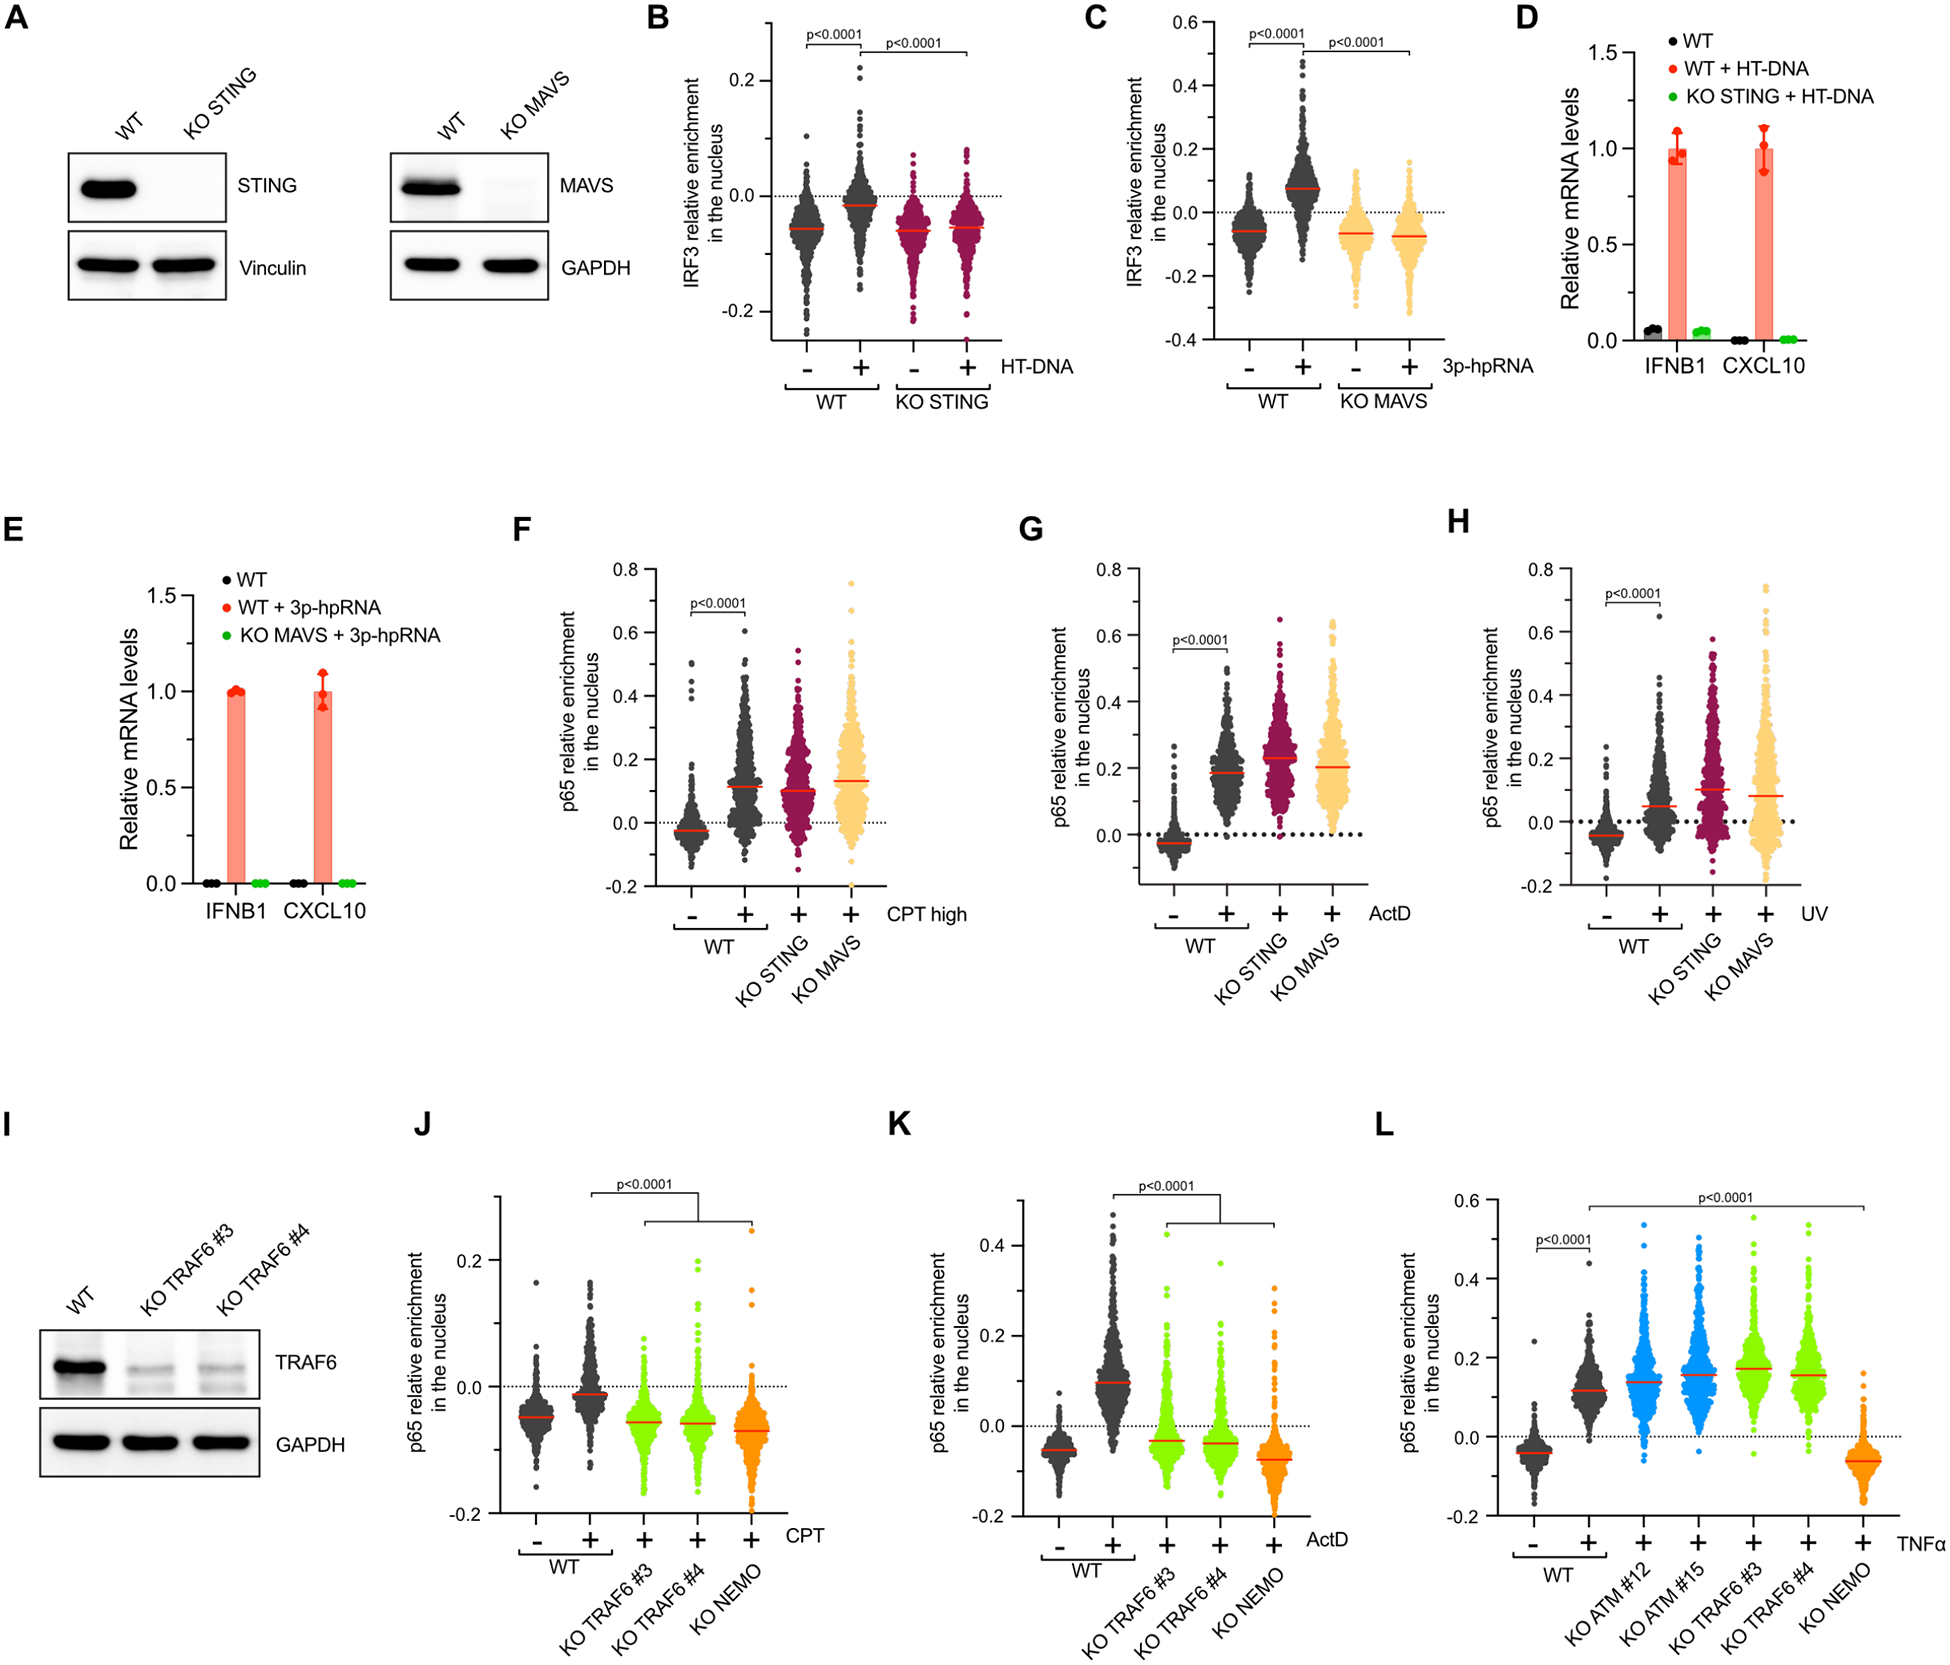
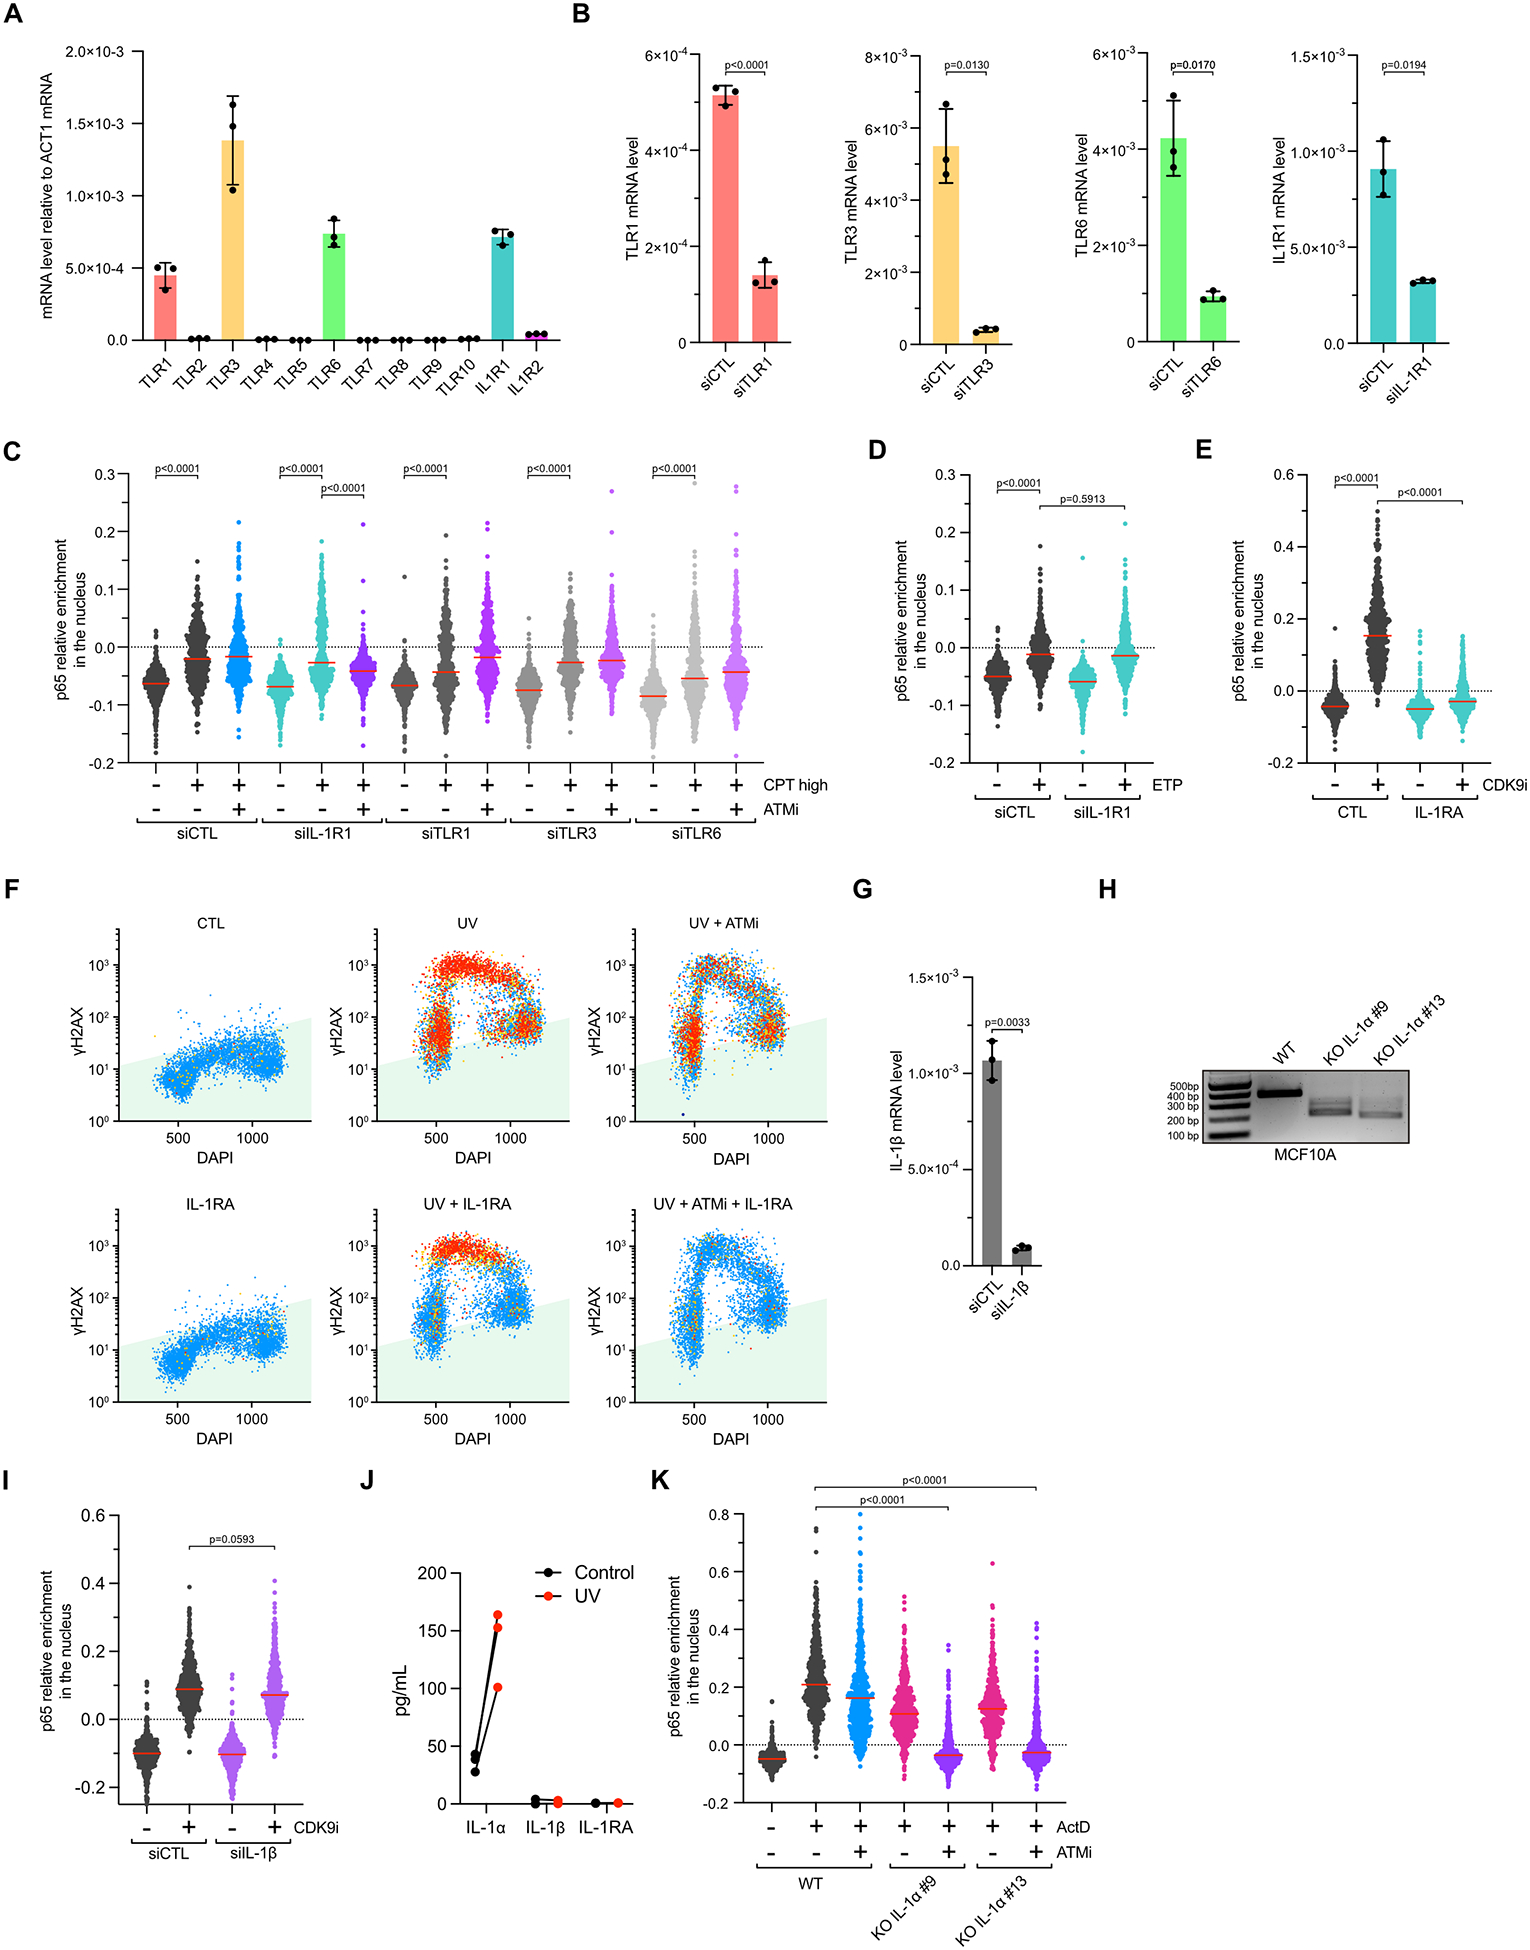
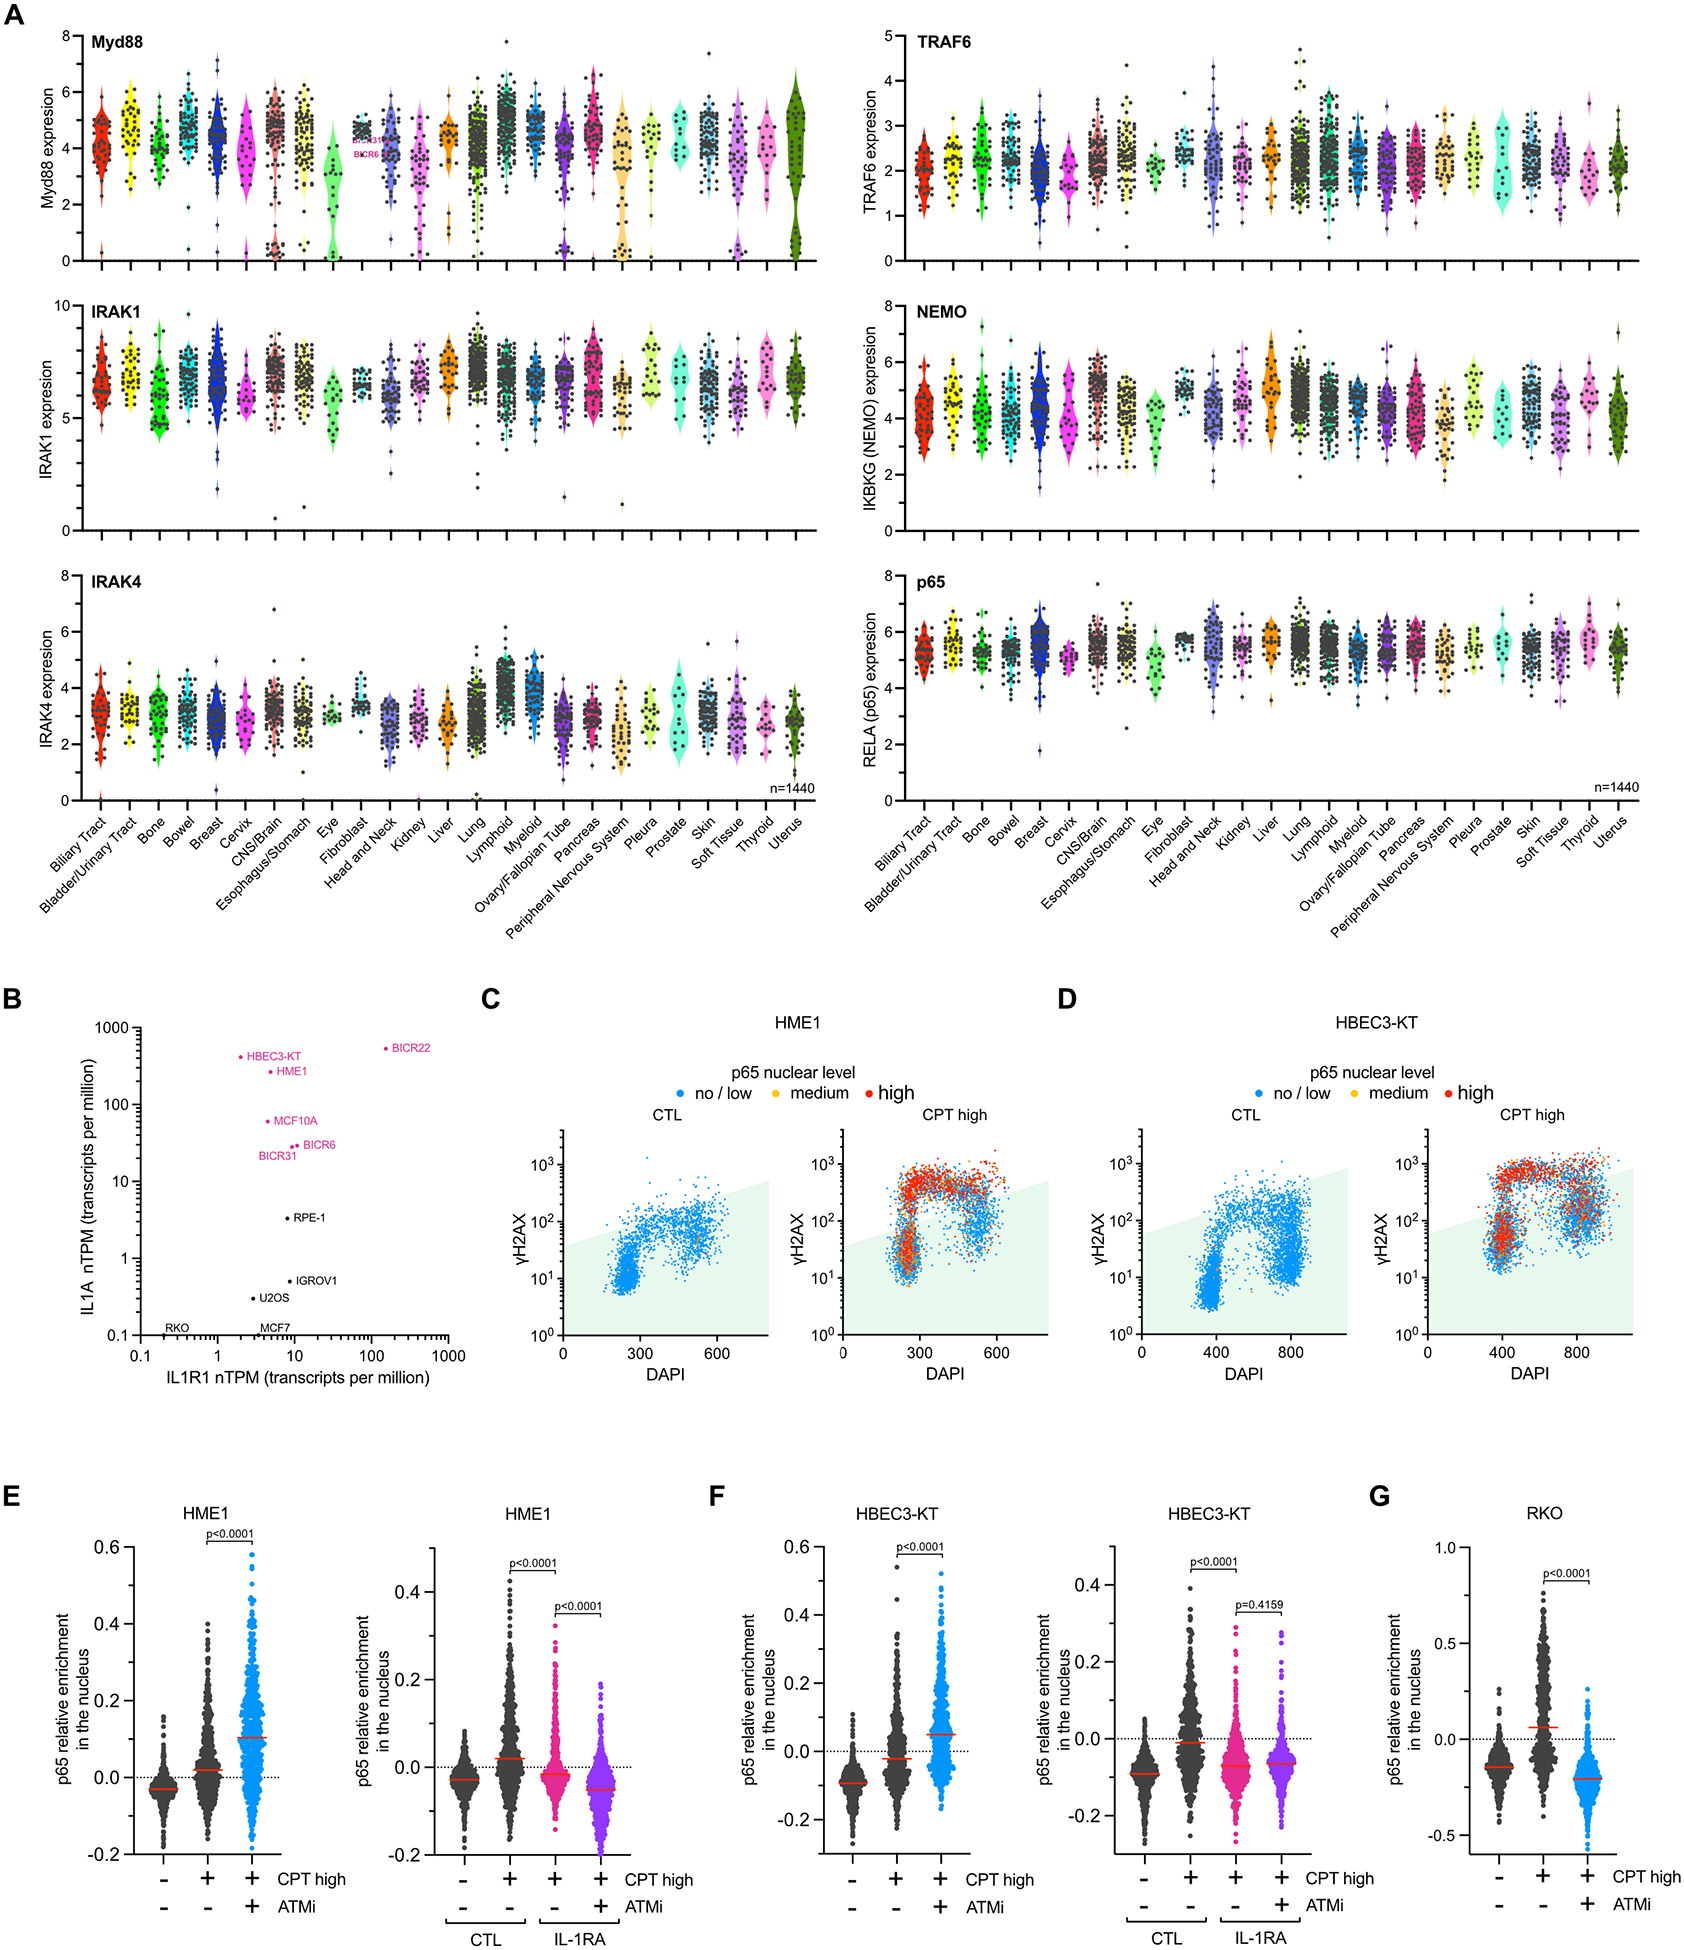
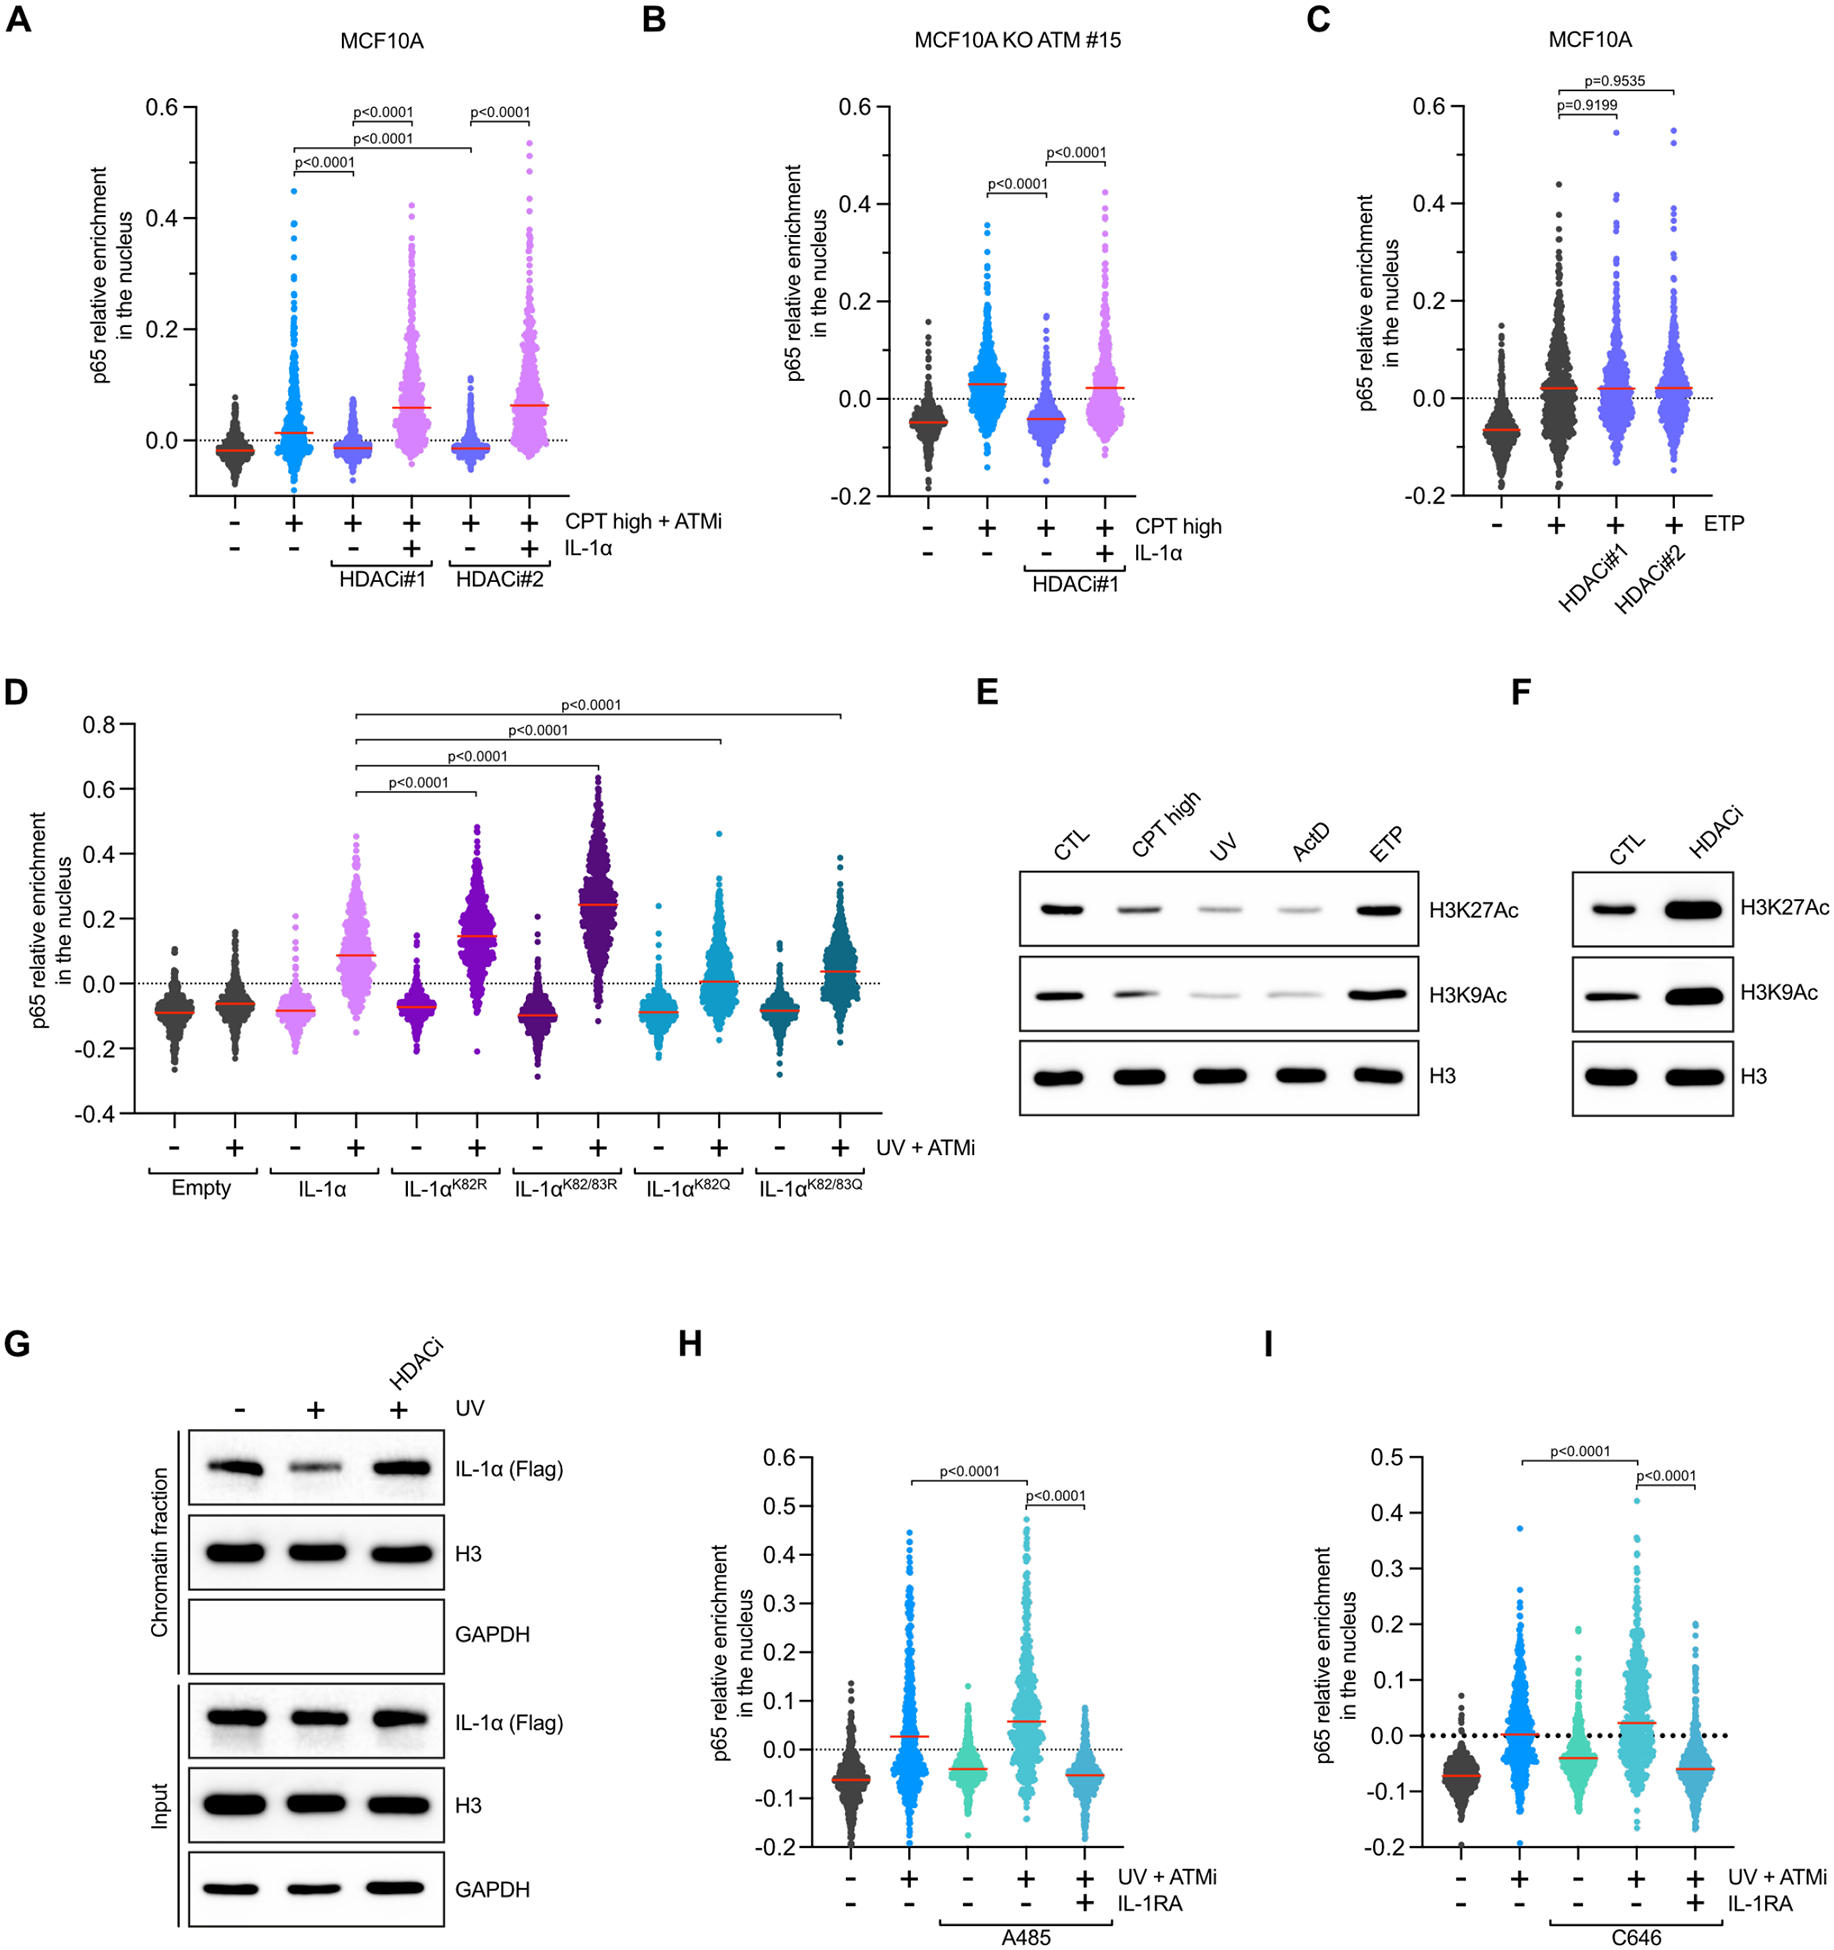
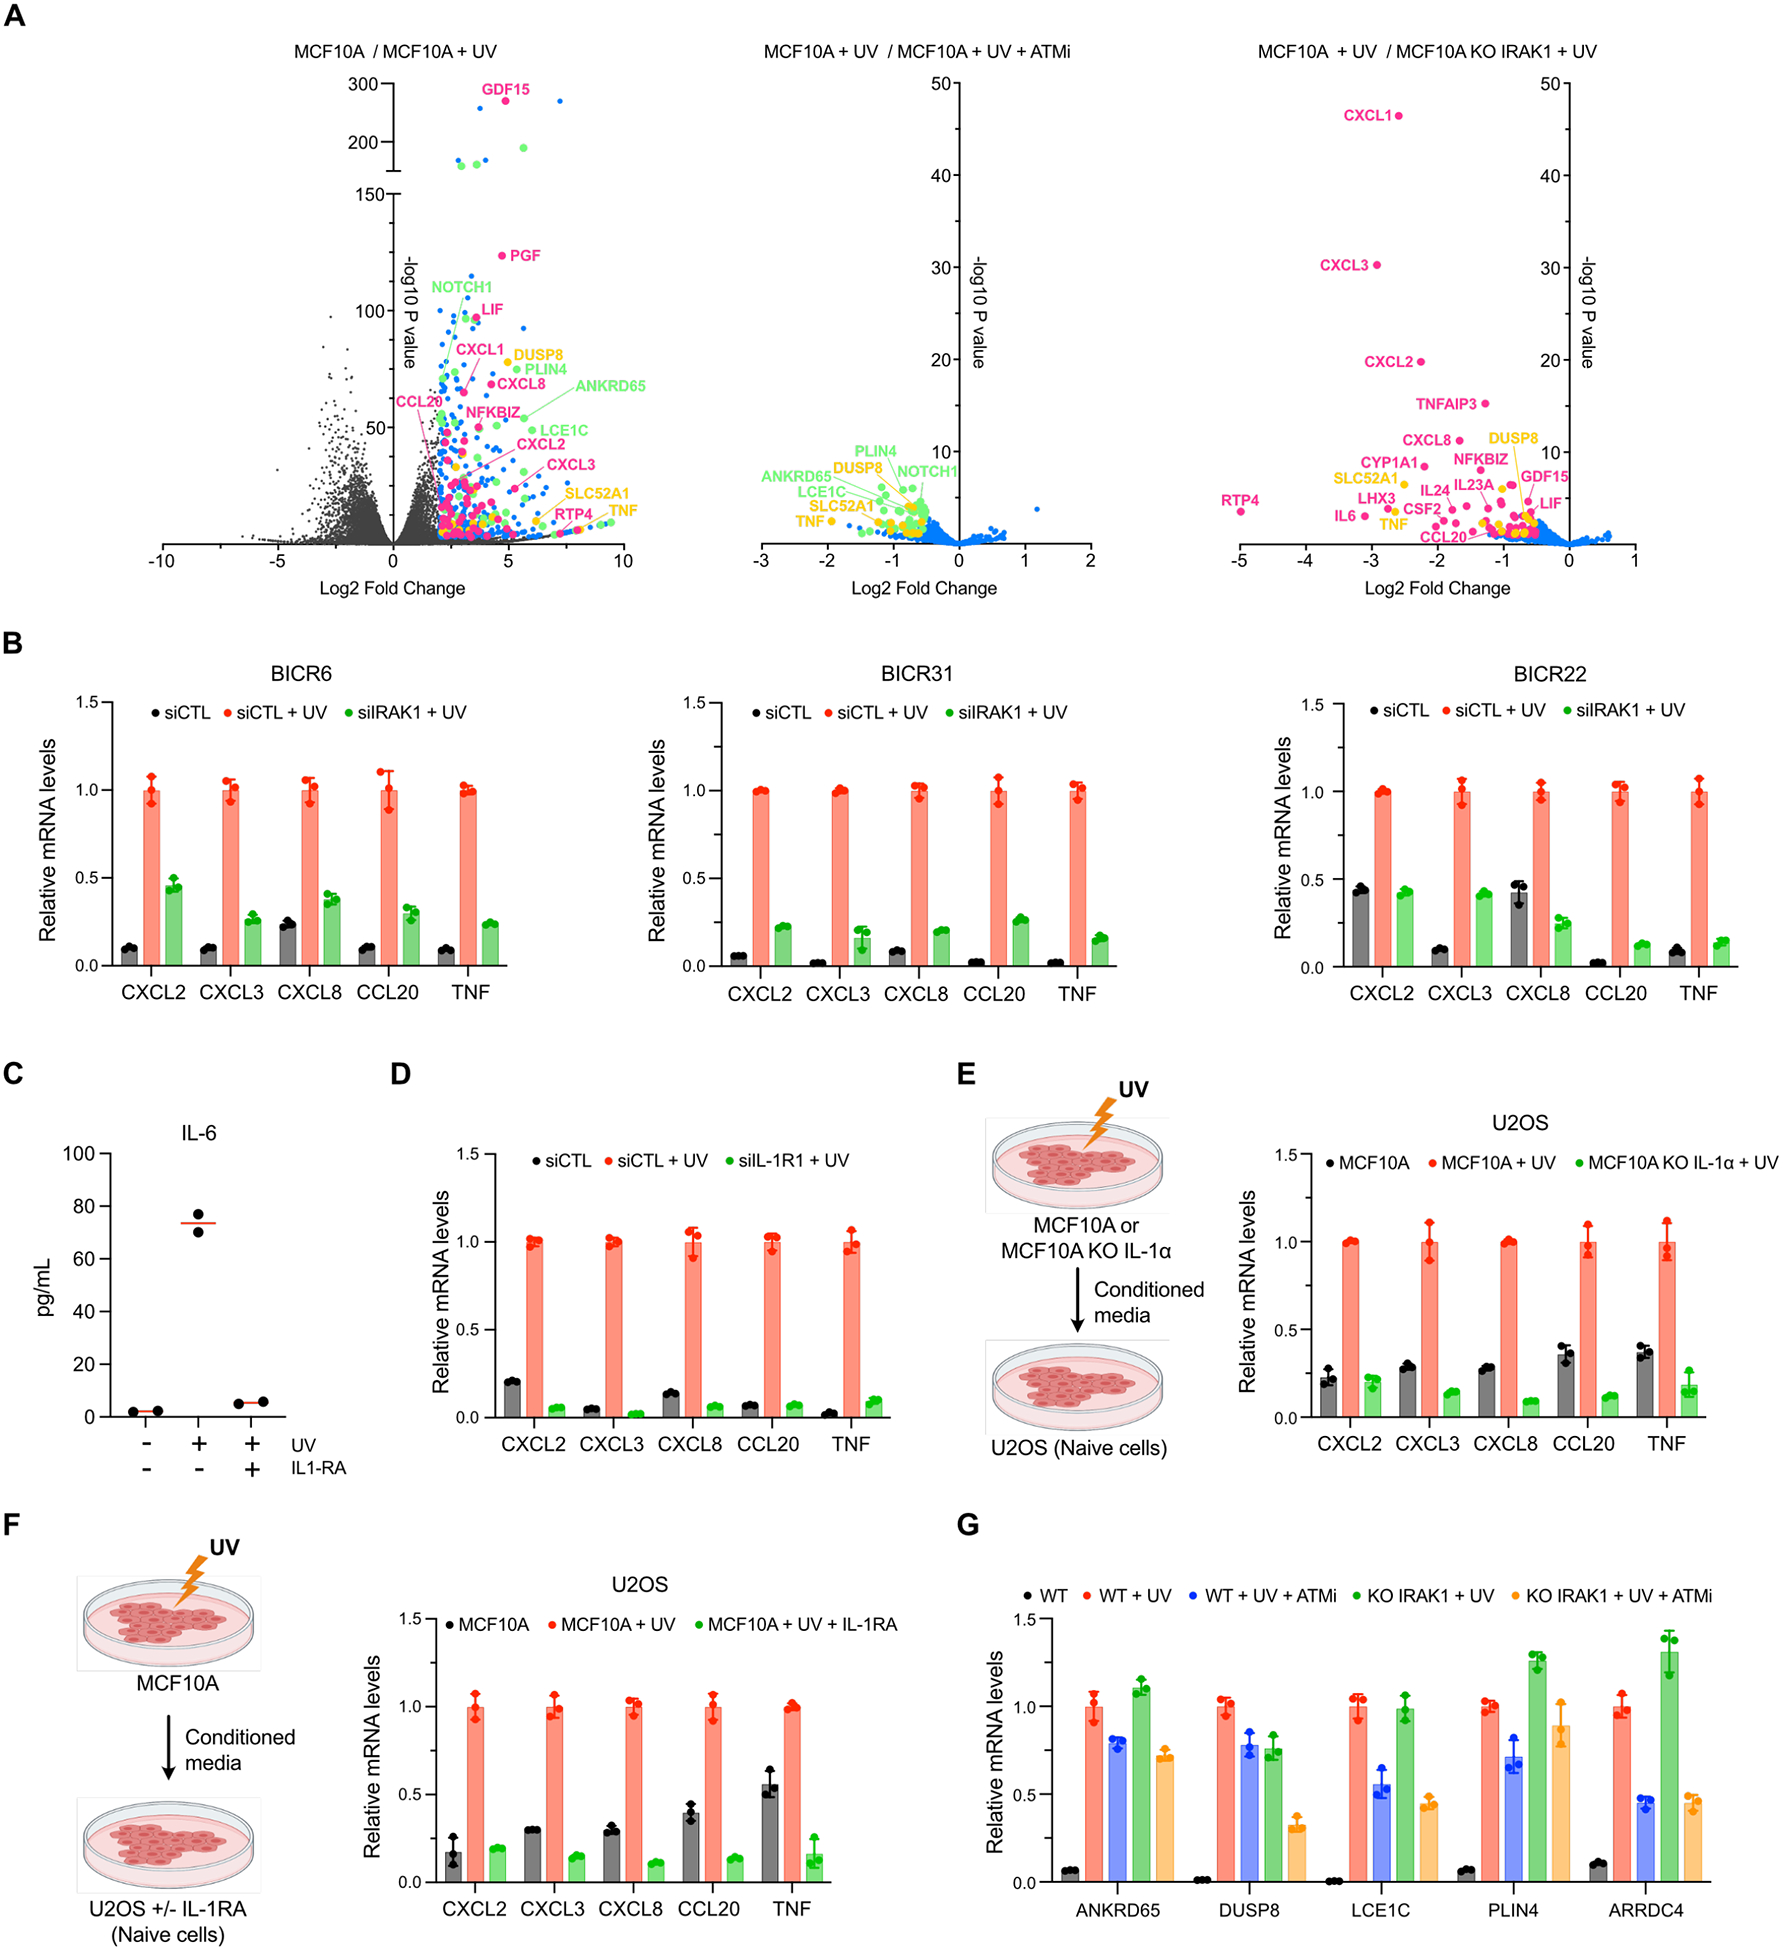
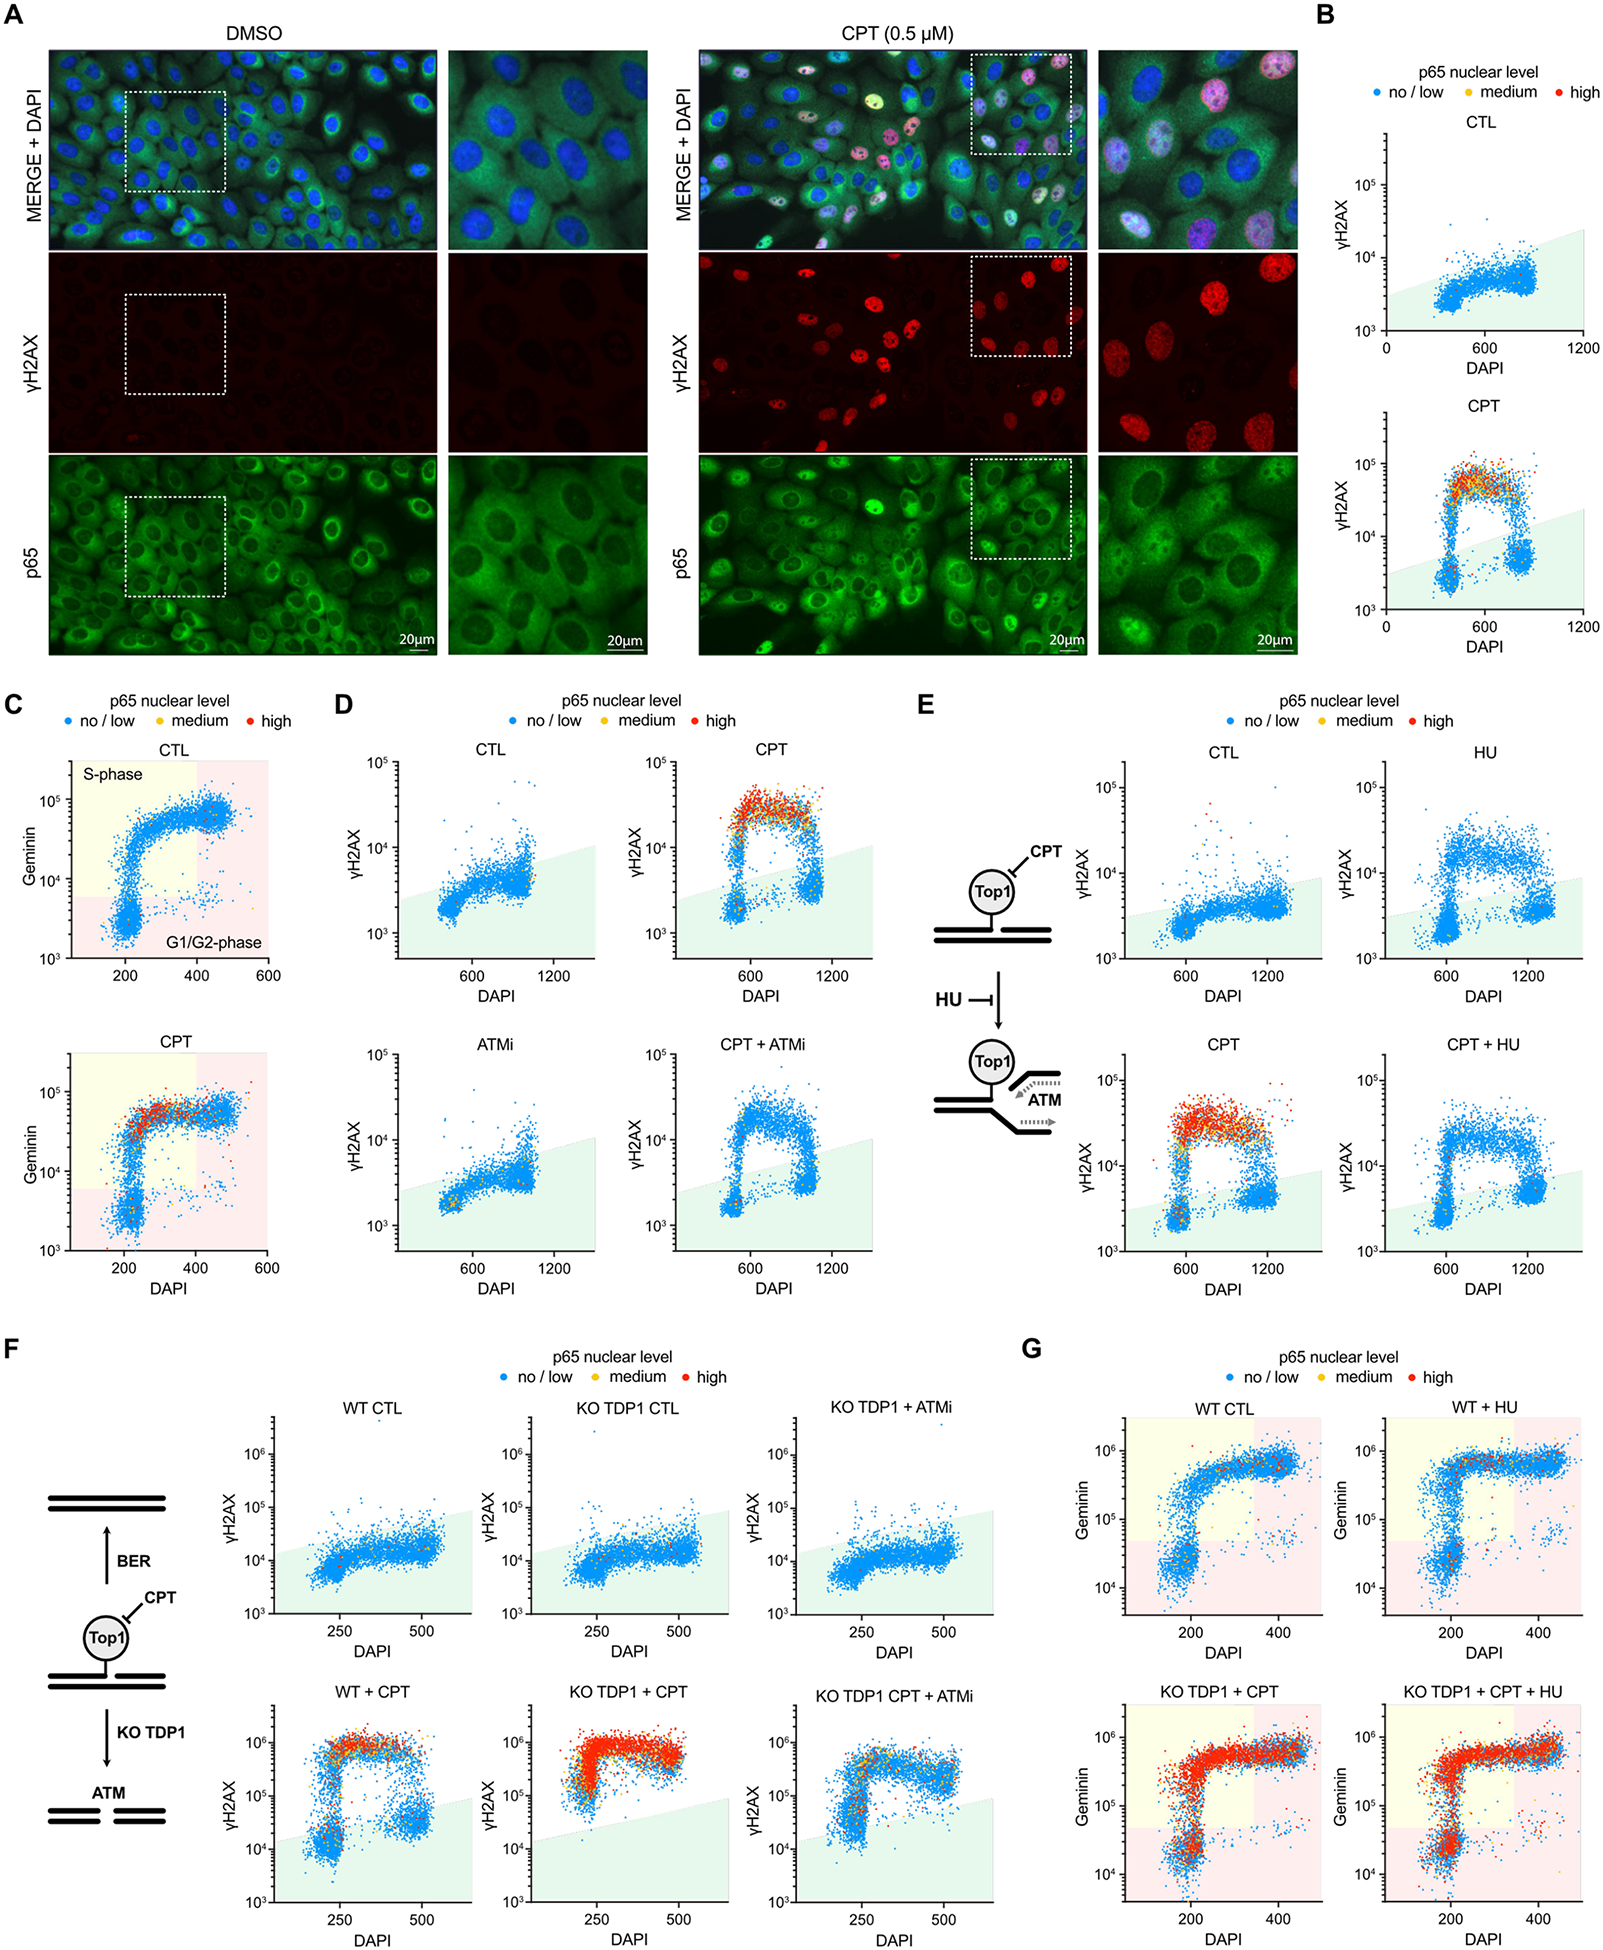
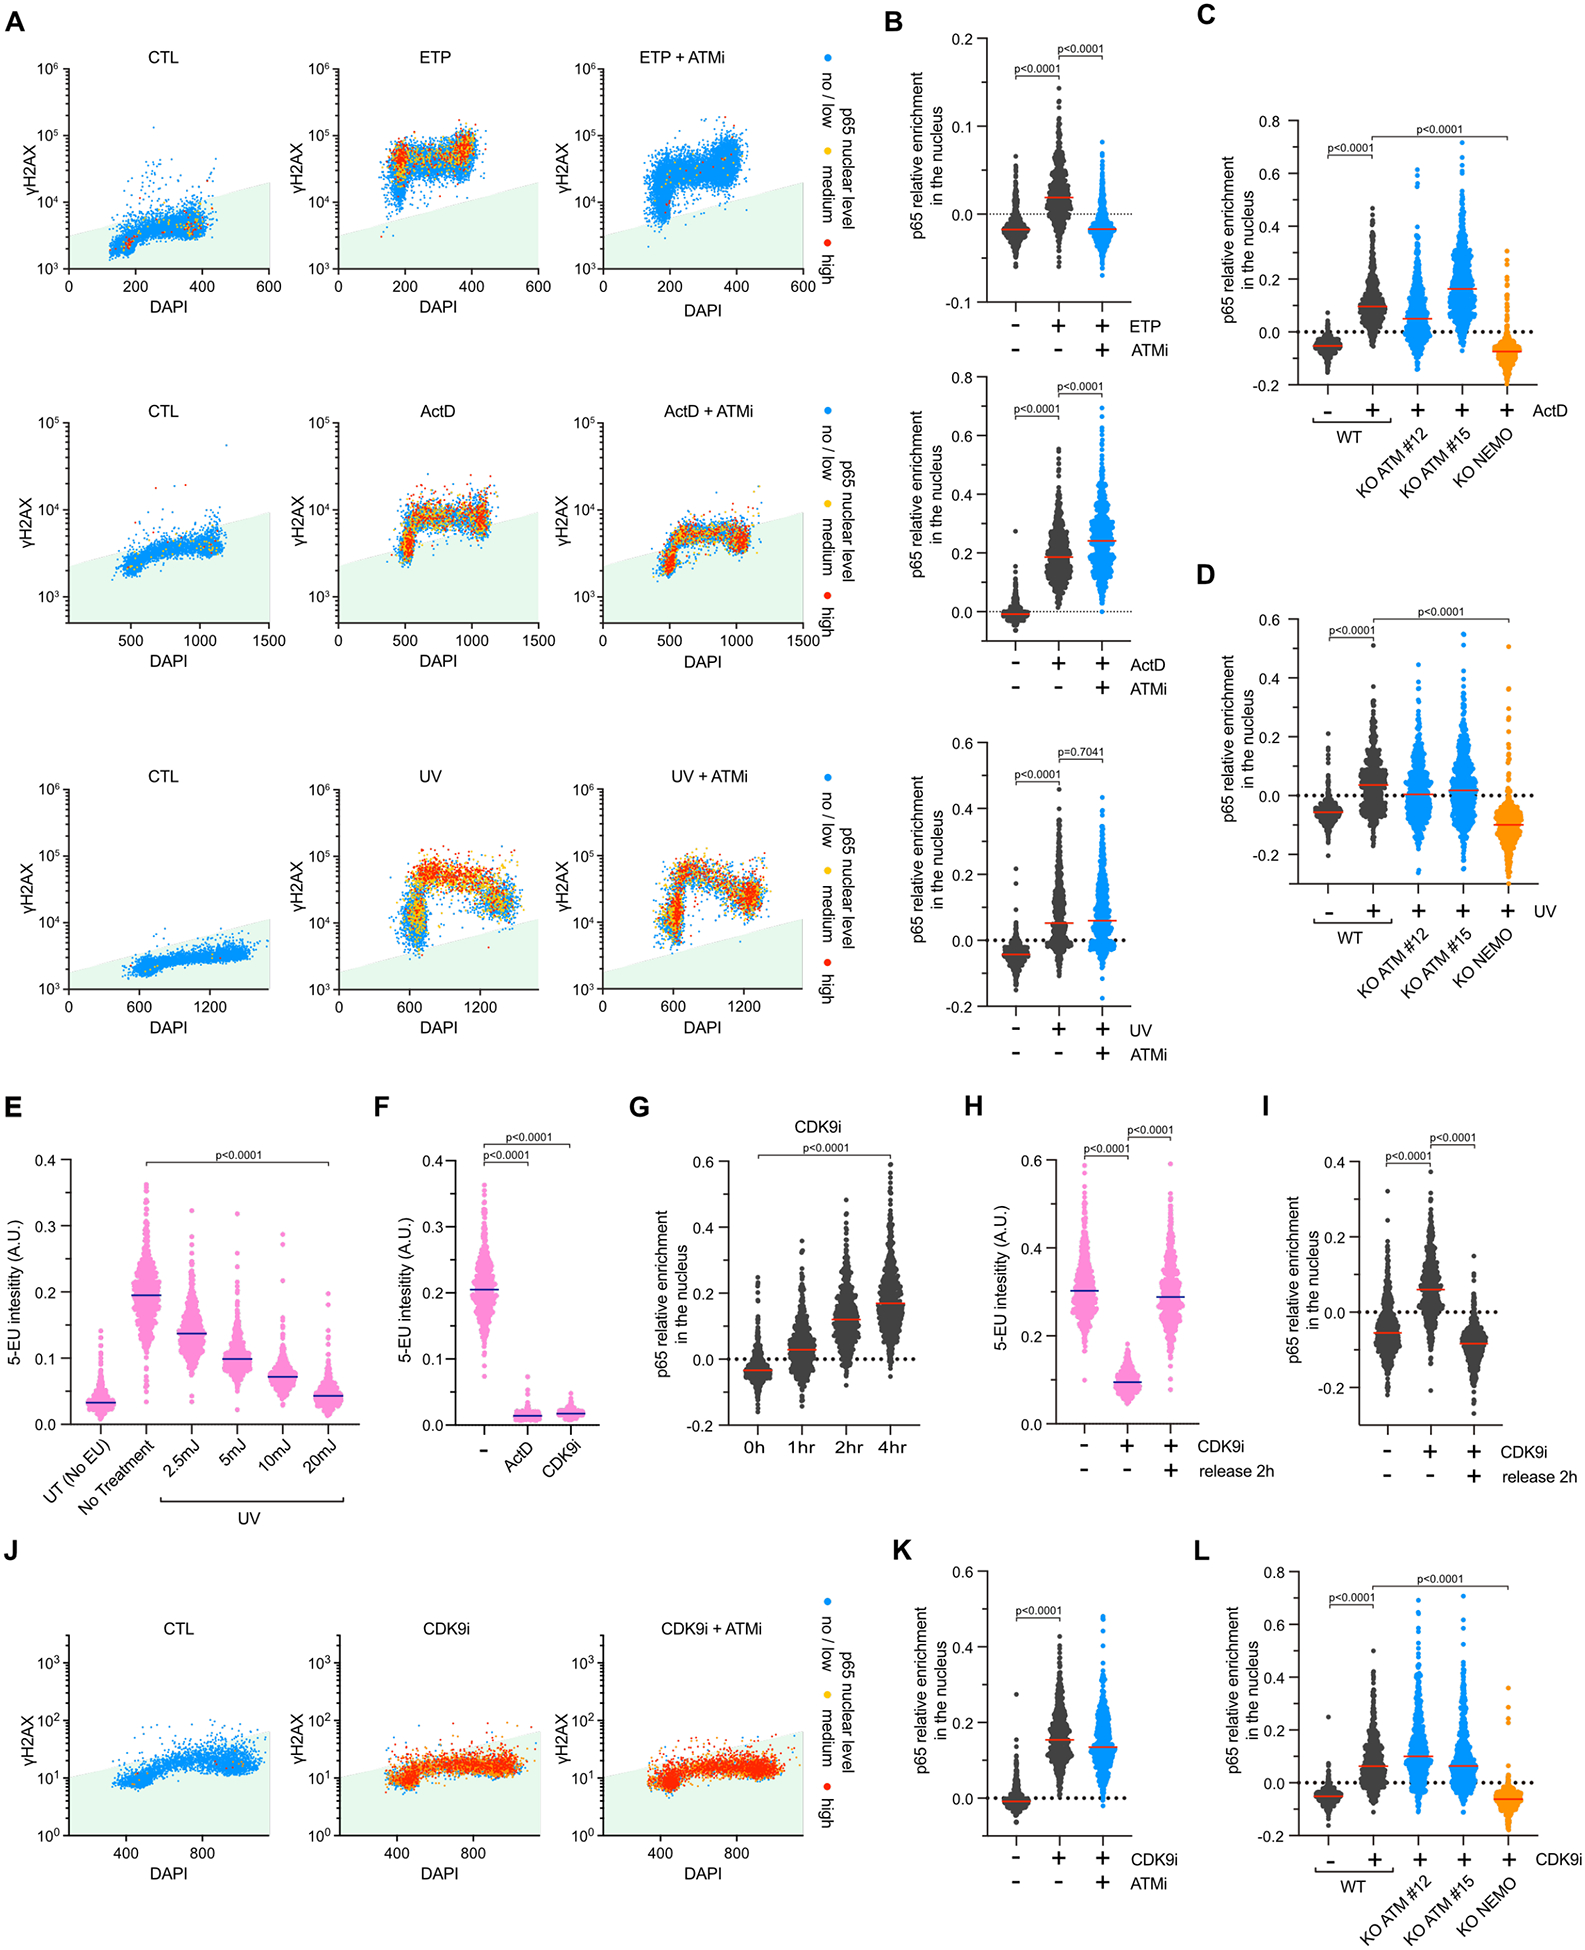
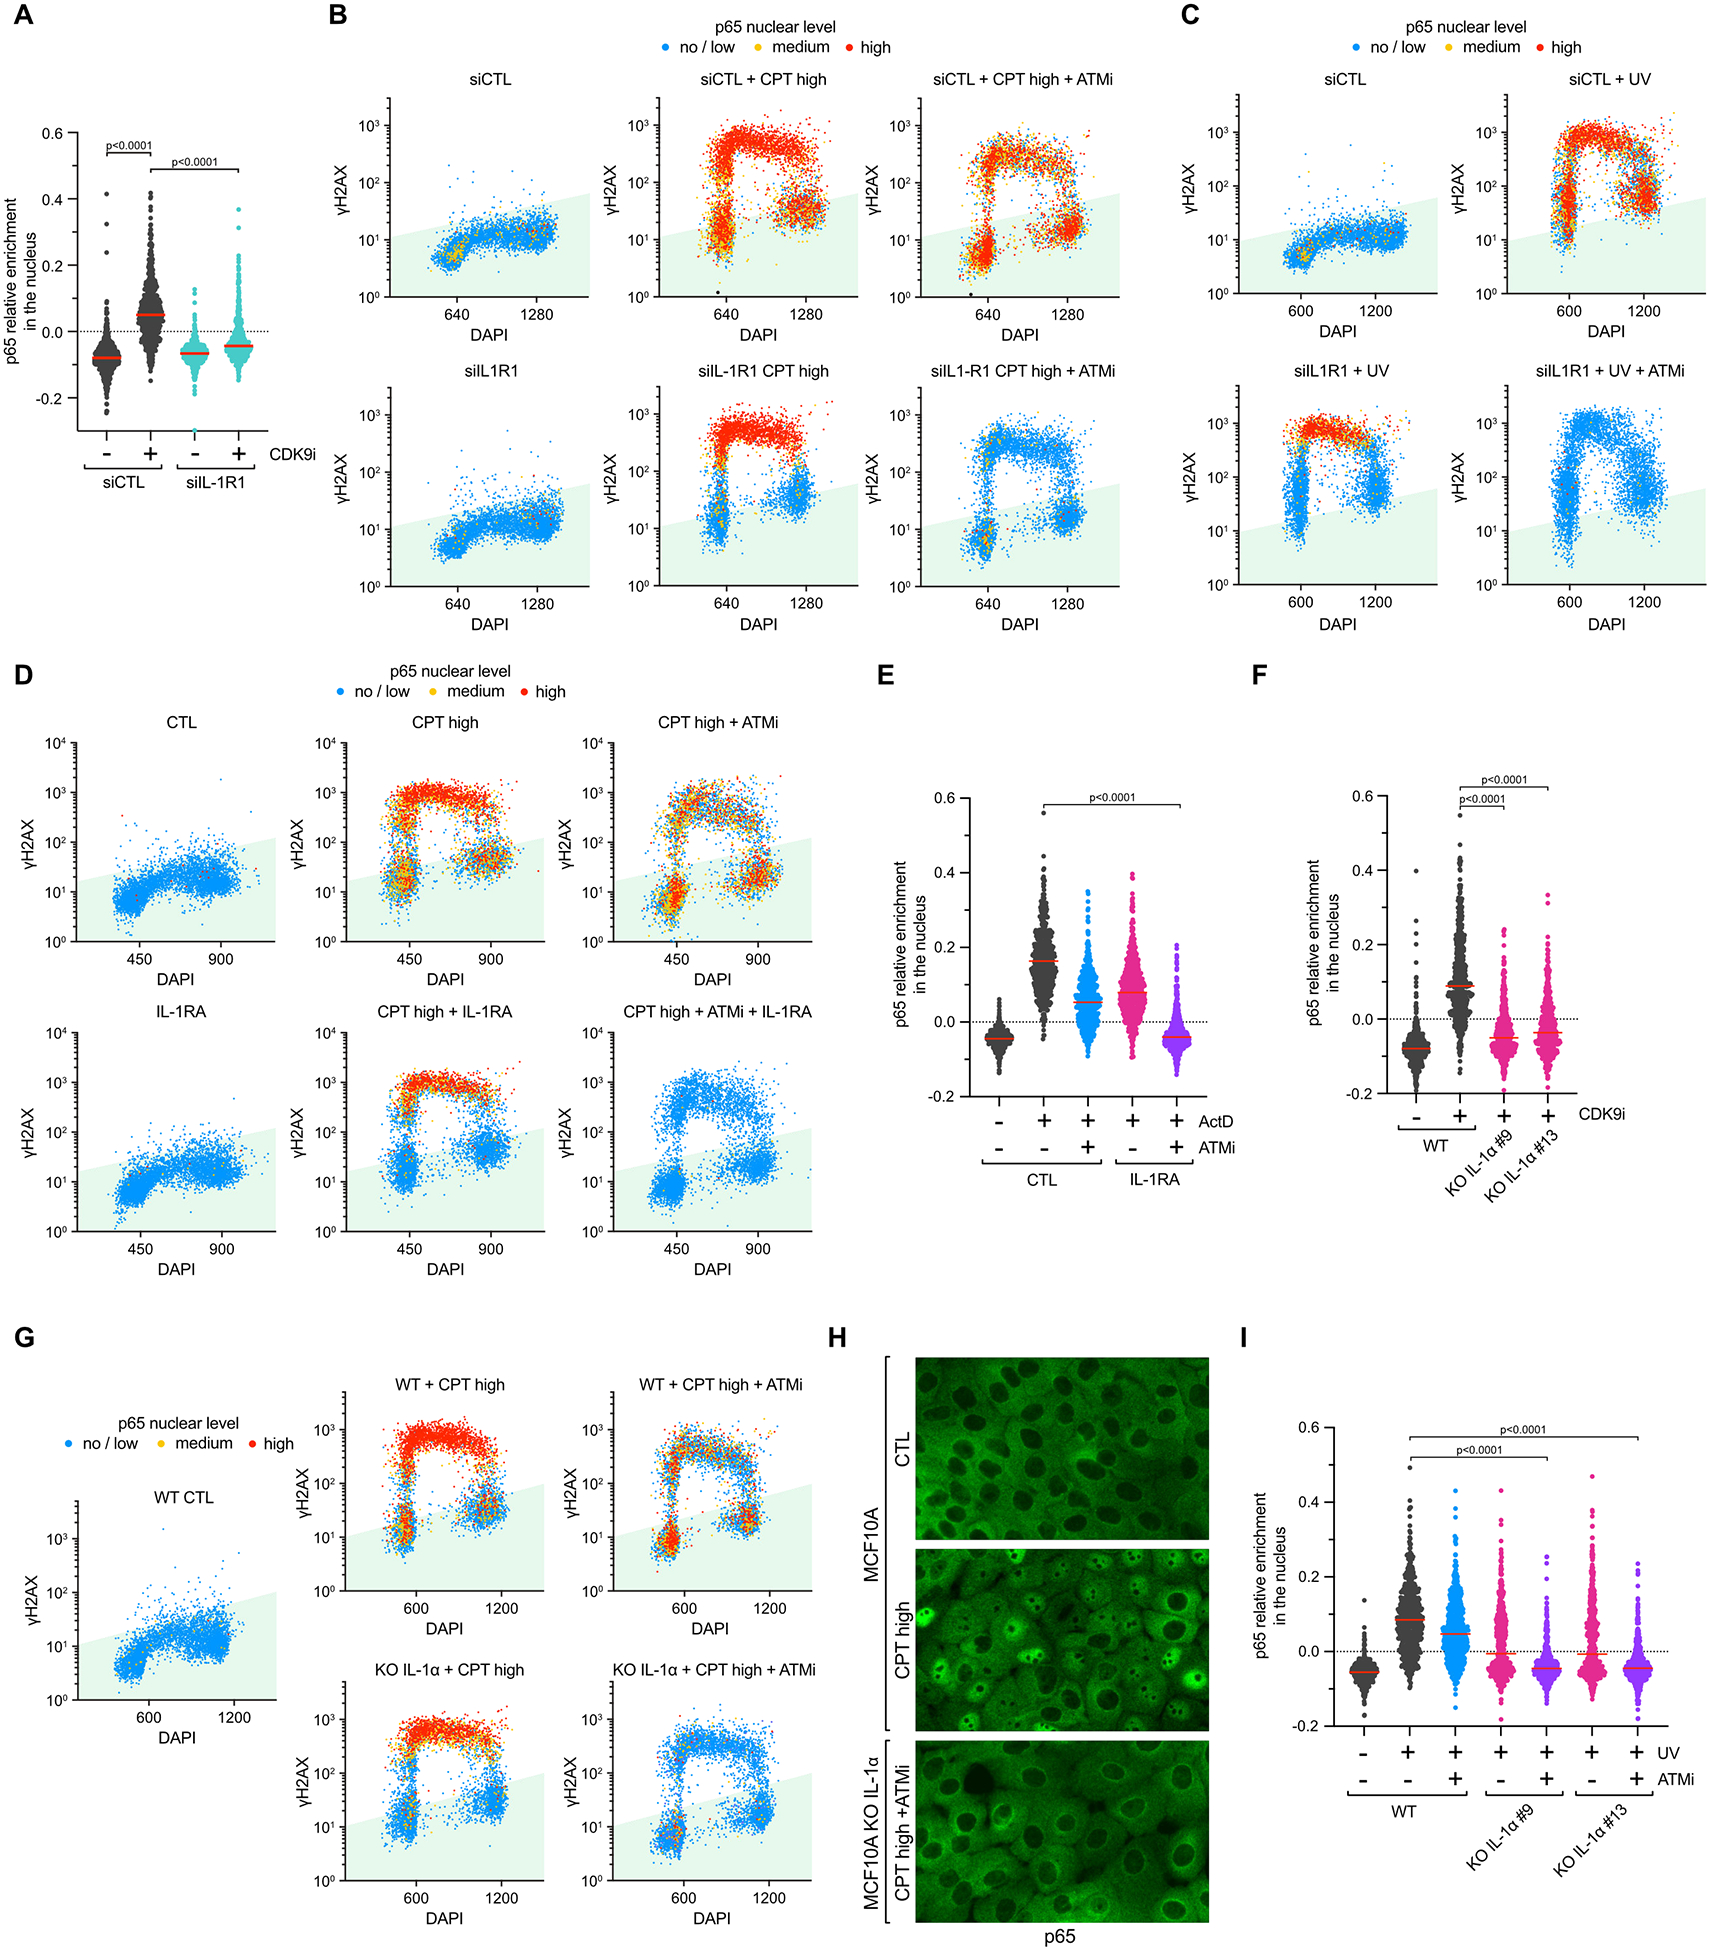
DNA damage in cells induces the expression of inflammatory genes. However, the mechanism by which cells initiate an innate immune response in the presence of DNA lesions blocking transcription remains unknown. Here we find that genotoxic stresses lead to an acute activation of the transcription factor NF-κB through two distinct pathways, each triggered by different types of DNA lesions and coordinated by either ataxia-telangiectasia mutated (ATM) or IRAK1 kinases. ATM stimulates NF-κB in cells with DNA double-strand breaks. By contrast, IRAK1-induced NF-κB signaling occurs in neighboring cells through IL-1α secretion from transcriptionally stressed cells caused by DNA lesions blocking RNA polymerases. Subsequently, both pathways stimulate TRAF6 and the IKK complex to promote NF-κB-mediated inflammatory gene expression. These findings provide an alternative mechanism for damaged cells with impaired transcription to initiate an inflammatory response without relying on their own gene expression, a necessary step that injured cells depend on during canonical innate immune responses.


Conflict of interest statement

Competing interests: The authors declare no competing interests.

Figures

Extended Data Figure 1:
A. Representative images showing p65 staining by immunofluorescence in MCF10A WT or p65 KO cells. B. Immunofluorescence for p65 and IκBα in MCF10A WT cells treated with CPT (0.5 μM) for 2 h. C. The levels of NEMO and GAPDH were analyzed by western blot in MCF10A WT or NEMO KO cells. D. MCF10A WT and NEMO KO cells were treated with CPT (0.5 μM) for 2 h and relative levels of p65 nuclear intensity in individual cell was quantified by immunofluorescence. Red lines indicate the mean. (Number of cells, n=550). E. Quantification of p65 nuclear levels, γH2AX intensity, and DNA content (DAPI) of 5,000 MCF10A WT cells treated with CPT (0.5 μM) or TPT (1 μM) for 2 h in the presence of absence of ATRi (0.5 μM). Colors display nuclear p65 levels compared to the cytoplasm in each cell. F-G. QIBC of MCF10A WT cells stained for p65, γH2AX, and DNA content (DAPI). Cells were with CPT (0.5 μM) ± DNA-PKi (2 mM) (F) or TPT (1 μM) ± ATMi (10 μM) (G) for 2 h. Cells were color coded according to the levels of nuclear p65. (Number of cells, n=5000). H. The levels of ATM and Vinculin were analyzed by western blot in MCF10A WT or ATM KO cells. I. MCF10A WT or ATM KO cells were treated with CPT (0.5 μM) for 2 h then p65 nuclear levels were quantified by immunofluorescence.
Extended Data Figure 2:
A-B. QIBC of MCF10A cells treated with HU (2 mM) for 2 h and stained for EdU, γH2AX, and DNA content (DAPI). Cells were color coded according to the levels of γH2AX (A) or EdU (B). (Number of cells, n=5000). C-D. MCF10A WT cells were treated with CPT (0.5 μM) for 2 h in the presence or in the absence of ATMi (10 μM) (C) or HU (2 mM) (D). Level of KAP1-pS824 and GAPDH were analyzed by western blot. E. The levels of TDP1 and GAPDH were analyzed by western blot in MCF10A WT or TDP1 KO cells.
Extended Data Figure 3:
A. The levels of PARP1, Caspase 3, and GAPDH levels were analyzed by western blot in MCF10A treated with CPT (20 μM, 4 h), UV (20 mJ/cm2, 4 h), ActD (5 μM, 4 h), CDK9i (6 μM, 4 h), ETP (50 μM, 4 h), Doxo (0.5 μM, 4h), or with Staurosporine (1 μM, 7h). B. Representative flow cytometry plots of Annexin V-FITC and Propidium Iodide (PI) staining of MCF10A cells treated with CPT (20 μM, 4 h), UV (20 mJ/cm2, 4 h), ActD (5 μM, 4 h), CDK9i (6 μM, 4 h), ETP (50 μM, 4 h), or with Staurosporine (1 μM, 7h). C. The levels of nuclear p65 were analyzed in MCF10A treated with CPT (0.5 μM), ETP (25 μM), IR (20 Gy), Doxorubicin (Doxo; 0.5 μM), HU (2 mM), APH (1 μg/mL), H2O2 (0.5 μM), Oxaliplatin (300 μM), MMC (3 μM), MMS (500 μM), 5-FU (10 μM), ATRi (1 μM), PARPi (10 μM), ActD (5 μM), or UV (10 mJ/cm2) for the indicated time. Red lines indicate the mean. (Number of cells, n=550).
Extended Data Figure 4:
A-C. The relative levels of nuclear p65 were analyzed in MCF10A WT or indicated KO cells treated with CPT (1 μM; 2 h) (A), IR (20 Gy; 1 h) (B), Doxo (0.5 μM; 2 h) (C) ± ATMi (10 μM). Red lines indicate the mean. (Number of cells, n=550). D. Quantification of p65 nuclear relative intensity in MCF10A WT, ATM KO, or NEMO KO cells treated with ETP (25 μM; 2 h). Red lines indicate the mean. (Number of cells, n=550). E. The levels of endogenous p65 and ectopically expressed p65-mNeonGrean were analyzed by western blot. F. Relative nuclear p65 intensity was quantified over time by live imaging in MCF10A-p65-mNeonGreen treated with ETP (50 μM), UV (10 mJ/cm2), or ActD (5 μM). When indicated, cells were pre-treated with ATMi (10 μM) for 30 min. For cells treated with ETP, UV or ActD ± ATMi, only cells that become nuclear p65-mNeonGreen positive during treatment were quantified. Red lines indicate the mean, and shadow sections represent the standard deviation. (Number of cells, n=15).
Extended Data Figure 5:
A-B. The levels of indicated proteins were analyzed by western blot in MCF10A WT treated with CDK9i (6 μM; 4 h), CDK7i (1 μM; 4 h) (A), or TPL (10 μM) (B). C-D. Quantification of 5-EU incorporation in MCF10A cells treated with TPL (10 μM) (C) or CDK7i (1 μM) (D) for 4h. Blue lines indicate the mean. (Number of cells, n=550). E-F. The relative levels of nuclear p65 were analyzed in MCF10A treated with TPL (10 μM) (E) or CDK7i (1 μM) (F) for the indicated time. Red lines indicate the mean. (Number of cells, n=550). G. QIBC of MCF10A cells stained for p65, γH2AX, and DNA contents (DAPI). Cells were treated with CDK7i (1 μM) ± ATMi (10 μM) for 4 h. (Number of cells, n=5000). H-I. Quantification of the relative levels of nuclear p65 in the indicated cell lines treated with 10 μM of TPL ± ATMi (10 μM) for 4 h. Red lines indicate the mean. (Number of cells, n=550).
Extended Data Figure 6:
A. The indicated protein levels were analyzed by western blot in MCF10A WT, STING KO, or MAVS KO cells. B. MCF10A WT and STING KO cells were transfected with HT-DNA (1 mg/mL) for 12 h. Relative nuclear IRF3 levels were then monitored by immunofluorescence. Red lines indicate the mean. (Number of cells, n=550). C. Quantification by immunofluorescence of nuclear IRF3 levels in MCF10A WT and MAVS KO cells transfected with 3phpRNA (250 ng/mL) for 12 h. Red lines indicate the mean. (Number of cells, n=550). D-E. Quantification of IFNB1 and CXCL10 mRNA levels by RT-qPCR in MCF10A WT cells and STING KO (D) or MAVS KO (E) cells treated as indicated. Each target was normalized to the highest expressing condition. Mean values ± SD (n = 3). F-H. The relative levels of nuclear p65 were analyzed in MCF10A WT, STING KO, or MAVS KO cell lines treated with CPT (10 μM) for 2 h (F), ActD (5 μM) for 4 h (G), or UV (10 mJ/cm2) for 4 h (H). Red lines indicate the mean. (Number of cells, n=550). I. The levels of TRAF6 and GAPDH were analyzed by western blot in MCF10A WT or TRAF6 KO cells. J-L. The relative levels of nuclear p65 were analyzed in MCF10A WT, ATM KO, TRAF6 KO, or NEMO KO cell lines treated with CPT (0.5 μM; 2 h) (J), ActD (5 μM; 4 h) (K), or TNFα (50ng/mL; 30 min) (L). Red lines indicate the mean. (Number of cells, n=550).
Extended Data Figure 7:
A. MCF10A cells were treated with CPT (10 μM), UV (10 mJ/cm2), ActD (5 μM), CDK9i (6 μM), or TPL (10 μM) for 4 h and the levels of KAP1-pS824 and GAPDH were analyzed by western blot. B. The levels of RIP1 and GAPDH were analyzed by western blot in MCF10A WT or RIP1 KO cells. C. Quantification of relative p65 nuclear levels in MCF10A WT or RIP1 KO cell lines treated with CDK9i (6 μM) for 4 h. Red lines indicate the mean. (Number of cells, n=550). D-E. The protein levels of IRAK1, Myd88, and GAPDH were analyzed by western blot in MCF10A cells knockout or knockdown for IRAK1 and Myd88. F. Representative immunofluorescence images of p65 in MCF10A WT or IRAK1 KO cells treated with UV (10 mJ/cm2) ± ATMi (10 μM) for 4 h. G. QIBC of MCF10A cells stained for p65, γH2AX, and DNA content (DAPI). Cells were transfected with a siRNA control (CTL) or targeting Myd88 and treated with UV (10 mJ/cm2) for 4 h. (Number of cells, n=5000). H. Quantification by QIBC of p65, γH2AX, and DAPI staining in MCF10A WT or IRAK1 KO cells treated with ETP (50 μM; 2 h). (Number of cells, n=5000). I. MCF10A cells were transfected with a siRNA control (CTL) or targeting Myd88 and treated with ETP (50 μM) for 2 h. p65 nuclear levels, γH2AX intensity, and DNA content were then monitor by QIBC. (Number of cells, n=5000). J. Quantification of relative p65 nuclear levels in MCF10A WT cells transfected with siMyd88 and treated with ActD (5 μM) ± ATMi (10 μM) for 4 h. Red lines indicate the mean. (Number of cells, n=550).
Extended Data Figure 8:
A. mRNA expression levels of indicated targets were analyzed by RT-qPCR in MCF10A cells. Mean values ± SD (n = 3). B. Quantification of TLR1, TLR3, TLR6 and IL1R1 mRNA levels by RT-qPCR in MCF10A WT cells knockdown for the respective targets. Mean values ± SD (n = 3). C-D. The relative levels of nuclear p65 were analyzed in MCF10A WT cells transfected with siRNAs against indicated targets, and subsequently treated with CPT (10 μM) ± ATMi (10 μM) (C) or ETP (50 μM) (D) for 2 h. Red lines indicate the mean. (Number of cells, n=550). E. Quantification of p65 nuclear relative levels in MCF10A cells treated with CDK9i (6 μM) ± IL-1RA (150 ng/mL) for 4 h. Red lines indicate the mean. (Number of cells, n=550). F. QIBC of MCF10A WT cells stained for p65, γH2AX, and DNA content (DAPI). Cells were treated with UV (10 mJ/cm2) ± ATMi (10 μM) in the presence or absence of IL-1RA (150 ng/mL) for 4 h. (Number of cells, n=5000). G. IL1B mRNA levels were monitored by RT-qPCR in MCF10A cells transfected with siCTL or siIL-1β. Mean values ± SD (n = 3). H. PCR amplicons on mRNA templates prepared from the indicated cell lines and performed using primers surrounding both gRNAs used to generate IL-1α KO cell lines. I. The relative levels of nuclear p65 were analyzed in MCF10A cells transfected with siIL-1β, subsequently treated with CDK9i (6 μM) ± IL-1RA (100 ng/mL) for 4 h. Red lines indicate the mean. (Number of cells, n=550). J. The levels of IL-1α, IL-1β, and IL-1RA were measured by ELISA in conditioned media from MCF10A WT cells treated with UV (10 mJ/cm2) for 4 h. K. Quantification of p65 nuclear relative levels in MCF10A WT or IL-1α KO cells treated with ActD (5 μM) ± ATMi (10 μM). Red lines indicate the mean. (Number of cells, n=550).
Extended Data Figure 9:
A. mRNA expression levels of Myd88, IRAK1, IRAK4, TRAF6, NEMO, and RELA (p65) in a panel of 1440 cell lines and classified by cancer types. B. IL1A and IL1R1 mRNA levels were analyzed in MCF10A, BICR6, BICR31, BICR22, HBEC3-KT, HME1, RPE-1, IGROV1, U2OS, RKO, and MCF7. C-D. QIBC of HME1 cells (C) or HBEC3-KT cells (D) cells stained for p65, γH2AX, and DNA content (DAPI). Cells were treated with CPT (20 μM) for 4 h. (Number of cells, n=5000). E-G. Relative levels of nuclear p65 intensity were analyzed in HME1 (E), HBEC3-KT (F), or RKO (G) cells treated with CPT (20 μM) ± ATMi (10 μM) for 4 h in the presence or absence of IL-1RA (250 ng/mL). Red lines indicate the mean. (Number of cells, n=550).
Extended Data Figure 10:
A. BICR6, BICR31, and BICR22 cells were treated with CPT (20 μM) ± ATMi (10 μM) for 4 h. The relative nuclear levels of p65 were then analyzed by immunofluorescence. Red lines indicate the mean. (Number of cells, n=550). B. BICR6, BICR31, and BICR22 cells were pretreated with IL-1RA (250 ng/mL) for 1 h and subsequently treated with CPT (20 μM) ± ATMi (10 μM) for 4 h. The relative nuclear levels of p65 were then analyzed by immunofluorescence. Red lines indicate the mean. (Number of cells, n=550). C-D. Quantification of p65 nuclear relative levels in BICR6, BICR31, and BICR22 cells transfected with the indicated siRNAs and treated with CPT (20 μM) ± ATMi (10 μM) for 4 h. Red lines indicate the mean. (Number of cells, n=550).
Extended Data Figure 11:
A-B. U2OS cells were cultured in the presence or absence of MCF10A WT-GFP or IL-1α KO-GFP and treated with CDK9i (6 μM) (A) or CPT (20 μM) + ATMi (10 μM) (B) for 4h. The relative nuclear levels of p65 were then analyzed by immunofluorescence. Red lines indicate the mean. (Number of cells, n=550). C. Quantification of p65 nuclear levels in MCF10A IL-1α KO cells co-cultured or not with MCF10A WT-GFP and treated with CDK9i (6 μM) ± IL-1RA (250 ng/mL) for 4 h. Red lines indicate the mean. (Number of cells, n=550). D. IGROV-1 cells were cultured in the presence or absence of MCF10A WT-GFP and treated with UV (10 mJ/cm2) ± IL-1RA (250 ng/mL) for 4 h. The relative levels of nuclear p65 were measured by immunofluorescence. Red lines indicate the mean. (Number of cells, n=550). E. Quantification of p65 nuclear localization in U2OS cells co-cultured with U2OS transfected with IL-1α-GFP following the indicated treatment for 4 h. Red lines indicate the mean. (Number of cells, n=550). F. MCF10A WT or IL-1α KO cells were treated with UV (10 mJ/cm2) for 4 h. Then, the conditioned media was collected and added to U2OS naive cells for 30 min. Next, the relative nuclear levels of p65 were monitored by immunofluorescence in U2OS cells. Red lines indicate the mean. (Number of cells, n=550).
Extended Data Figure 12:
A. Quantification of relative p65 nuclear levels in MCF10A WT cells treated for 4 h with CPT+ATMi in the presence or absence of the indicated HDAC. When indicated, cells were treated were treated with recombinant human IL-1α (1.25 ng/mL), 30 min before fixation. Red lines indicate the mean. (Number of cells, n=550). B. Quantification of relative p65 nuclear levels in MCF10A ATM KO cells treated for 4 h with CPT (20 μM) in the presence or absence of the indicated HDAC inhibitors. When indicated, cells were treated were treated with recombinant human IL-1α (1.25 ng/mL), 30 min before fixation. Red lines indicate the mean. (Number of cells, n=550). C. Quantification of p65 nuclear levels in MCF10A WT cells treated with ETP (50 μM) for 4 h in the presence or absence of the indicated HDAC inhibitors. Red lines indicate the mean. (Number of cells, n=550). D. U2OS cells were transfected with indicated IL-1α-Flag constructs. Cells were subsequently treated UV (10 mJ/cm2) + ATMi (10 μM) for 4 h. Relative nuclear p65 levels were then quantified by immunofluorescence. Red lines indicate the mean. (Number of cells, n=550). E-F. MCF10A cells were treated with CPT (20 μM), UV (10 mJ/cm2), ActD (5 μM), ETP (50 μM) for 4 h (E) or HDACi#1 (10μM) (F) for 10h and the levels of H3K27ac, H3K9ac and total H3 were analyzed by western blot. G. Levels of IL-1α, H3, and GAPDH in the soluble and chromatin fractions of UV-treated cells in the presence or absence of HDACi were analyzed by western blot. H-I. MCF10A cells were treated with UV (10 mJ/cm2) + ATMi (10 μM) for 4 h in the presence or absence of IL-1RA (250 ng/mL). When indicated, cells were pre-treated with A485 (10 μM) (H) or C646 (10 μM) (I).
Extended Data Figure 13:
A. Volcano plots of differentially expressed genes in MCF10A WT or IRAK1 KO#7 cells treated with UV (10 mJ/cm2) for 12 h in the presence or absence of ATMi (10 μM). Data are derived from n = 2 biological replicates. B. MCF10A WT cells were treated with UV (10 mJ/cm2) ± IL-1RA (250 ng/mL). The levels of IL-6 were then analyzed in the conditioned media by ELISA. Red lines indicate the mean. C. BICR6, BICR31 and BICR22 cells were treated with UV (10 mJ/cm2) for 12h. Then CXCL2, CXCL3, CXCL8, CCL20, and TNF mRNA levels were quantified by RT-qPCR. Each target was normalized to the highest expressing condition. Mean values ± SD (n = 3). D. CXCL2, CXCL3, CXCL8, CCL20, and TNF mRNA levels were measured by RT-qPCR in MCF10A cells known-down for IL-1R1 treated with UV (10 mJ/cm2) for 12 h. Each target was normalized to the highest expressing condition. Mean values ± SD (n = 3). E. Indicated cell lines were treated with UV (10 mJ/cm2) for 4h. The conditioned media was collected and added to U2OS naive cells for 30 min. CXCL2, CXCL3, CXCL8, CCL20, and TNF mRNA levels were then measured by RT-qPCR in U2OS cells. Each target was normalized to the highest expressing condition. Mean values ± SD (n = 3). F. MCF10A cells were treated with UV (10 mJ/cm2) for 4h. The conditioned media was collected and added to U2OS naive cells for 30 min ± IL-1RA (250 ng/mL) (with 1h pretreatment). CXCL2, CXCL3, CXCL8, CCL20, and TNF mRNA levels were then monitored by RT-qPCR in U2OS cells. Each target was normalized to the highest expressing condition. Mean values ± SD (n = 3). G. The levels of ANKRD65, DUSP8, LCE1C, PLIN4, and ARRDC4 mRNA were analyzed by RT-qPCR in MCF10A WT or IRAK1 KO cells treated with UV (10 mJ/cm2) ± ATMi (10 μM) for 12 h. Each target was normalized to the MCF10A WT+UV sample. Mean values ± SD (n = 3).
Extended Data Figure 14:
A. BICR6, BICR31, and BICR22 cells were treated with CPT (2.5 μM) for 12 h. CXCL2, CXCL3, CXCL8, CCL20, and TNF mRNA levels were then quantified by RT-qPCR. Each target was normalized to the highest expressing condition. Mean values ± SD (n = 3). B-C. CXCL2, CXCL3, CXCL8, CCL20, and TNF mRNA levels were measured by RT-qPCR in MCF10A KO p65 cells (B) or MCF10A cells known-down for IL-1R1 (C) treated with CPT (2.5 μM) for 12 h. Each target was normalized to the highest expressing condition. Mean values ± SD (n = 3).
Figure 1:
Figure 1:. A quantitative image-based cytometry approach to monitor p65 activation caused by TOP1 inhibition.
A. Immunofluorescence for p65 and γH2AX in MCF10A cells treated with DMSO or CPT (0.5 μM) for 2 h. Scale bar: 20 μm. B-C. Quantification of p65 nuclear levels, DNA contents, and γH2AX (B) or Geminin (C) intensity of 5,000 MCF10A cells treated for 2 h with DMSO or CPT (0.5 μM). Each individual cell was color-coded according to the intensity of p65 in the nucleus compared to its cytoplasmic staining. D. Quantification of p65 nuclear levels, γH2AX intensity, and DNA contents of 5,000 MCF10A cells treated with DMSO or CPT (0.5 μM) for 2 h. When indicated, cells were pre-treated with ATMi (10 μM) for 30 min before adding CPT. Cells were color-coded according to the levels of p65 nuclear intensity. E. Left: Model in which HU blocks DNA replication fork collapse caused by TOP1cc. Right: Quantification of p65 nuclear levels, γH2AX intensity, and DNA contents of 5,000 MCF10A cells treated with HU (2 mM) for 5 min followed by DMSO or CPT (0.5 μM) treatment for 2 h. Cells were color-coded according to the levels of p65 nuclear intensity. F. Left: Model highlighting TOP1cc leading to DSBs formation in the absence of TDP1. Right: Quantification of p65 nuclear levels, γH2AX intensity, and DNA contents of 5,000 MCF10A WT or TDP1 KO cells treated with DMSO or CPT (0.5 μM) for 2 h. When indicated, cells were pre-treated with DMSO or ATMi (10 μM), for 30 min before CPT. Cells were color-coded according to the intensity of p65 nuclear staining. G. Quantification of p65 nuclear levels, Geminin intensity, and DNA contents of 5,000 MCF10A WT or TDP1 KO cells treated CPT (0.5 μM) ± HU (2 mM) for 2 h. Cells were color-coded according to the levels of p65 nuclear intensity.
Figure 2:
Figure 2:. Two distinct classes of DNA lesions promote nuclear p65.
A. Quantification of p65 nuclear levels, γH2AX intensity, and DNA contents of 5,000 MCF10A cells treated with ETP (25 μM; 2 h), ActD (5 μM; 4 h), or UV (20 mJ/cm2; 4 h) in the presence or absence of ATMi (10 μM). B. Levels of nuclear p65 intensify relative to cytoplasmic p65 intensity were measured by immunofluorescence following indicated treatments. Red lines indicate the mean. (Number of cells, n=550). C-D. Quantification of p65 nuclear relative intensity in MCF10A WT, ATM KO, or NEMO KO cells treated with ActD (5 μM) (C) or UV (10 mJ/cm2) (D) for 4 h. Red lines indicate the mean. (Number of cells, n=550). E-F. MCF10A cells were treated with UV (E), ActD (5 μM) or CDK9i (6 μM) (F) for 4 h. RNA synthesis was analyzed by visualizing incorporated 5-EU. Blue lines indicate the mean. (Number of cells, n=550). G. p65 nuclear relative intensity was quantified by immunofluorescence in MCF10A cells treated with CDK9i (6 μM) and analyzed at the indicated time. Red lines indicate the mean. (Number of cells, n=550). H-I. MCF10A WT cells were treated with CDK9i (6 μM; 4 h), then washed and released in fresh media for 2 h. The levels of 5-EU incorporation (H) and relative nuclear p65 intensity (I) were analyzed by microscopy. Blue or red lines indicate the mean. (Number of cells, n=550). J. QIBC of MCF10A cells stained for p65 and γH2AX. Cells were treated with 6 μM of CDK9i for 4h in the presence or absence of ATMi (10 μM). (Number of cells, n=5000). K. Quantification of p65 nuclear relative intensity in MCF10A cells treated with CDK9i (6 μM; 4 h) ± ATMi (10 μM). Red lines indicate the mean. (Number of cells, n=550). L. The levels of nuclear p65 were analyzed in MCF10A WT, ATM KO, or NEMO KO cell lines treated with 6 μM of CDK9i for 4h. Red lines indicate the mean. (Number of cells, n=550).
Figure 3:
Figure 3:. ATM-dependent and independent activation of p65 after TOP1 inhibition.
A-B. MCF10A cells were treated with the indicated concentration of CPT for 2 h. The levels of 5-EU incorporation (A) and relative nuclear p65 intensity (B) were analyzed by microscopy. Blue and red lines indicate the mean. (Number of cells, n=550). C-D. MCF10A cells were treated with CPT (20 μM) for 2 h then washed and released in fresh media for 4h. The levels of 5-EU incorporation (C) and relative nuclear p65 intensity (D) were analyzed by microscopy. Blue or red lines indicate the mean. (Number of cells, n=550). E. QIBC of MCF10A cells stained for p65 and γH2AX. Cells were treated with CPT (0.5 μM) or CPT high (20 μM) for 2 h in the presence or absence of ATMi (10 μM). (Number of cells, n=5000). F. The relative levels of nuclear p65 were analyzed in MCF10A WT treated with CPT (20 μM) for 2 h ± ATMi (10 μM). Red lines indicate the mean. (Number of cells, n=550). G. Quantification of relative p65 nuclear levels in MCF10A WT, ATM KO, or NEMO KO cell lines treated with CPT (20 μM) for 4 h. Red lines indicate the mean. (Number of cells, n=550). H-I. MCF10A cells were treated with 0.5 μM (H) or 20 μM (I) CPT for 2 h in the presence or absence of ATMi (10 μM). The relative levels of nuclear p65 intensity were analyzed in the designated cell cycle phases. Red lines indicate the mean. (Number of cells, n=550). J. QIBC of MCF10A cells stained for p65 and γH2AX. Cells were treated with CPT (0.5 μM) or CPT high (20 μM) for 2 h in the presence or absence of HU (2 mM). (Number of cells, n=5000).
Figure 4:
Figure 4:. TRAF6, IRAK1, and Myd88 promote p65 nuclear localization mediated by DNA lesions blocking transcription.
A-D. The relative levels of nuclear p65 intensity were analyzed in MCF10A WT, TRAF6 KO, or NEMO KO cell lines treated with ETP (25 μM; 2 h) (A), UV (10 mJ/cm2; 4 h) (B), CPT (20 μM; 4 h) (C), and CDK9i (6 μM; 4 h) (D). Red lines indicate the mean. (Number of cells, n=550). E. MCF10A WT or IRAK1 KO cells were treated with DMSO or CDK9i (6 μM) for 4h, and the relative levels of nuclear p65 were analyzed. Red lines indicate the mean. (Number of cells, n=550). F. The relative levels of nuclear p65 were analyzed in MCF10A transfected with siRNA against IRAK1 or Myd88 and subsequently treated with CDK9i (6 μM) for 4 h. Red lines indicate the mean. (Number of cells, n=550). G-H. QIBC of MCF10A cells stained for p65, γH2AX, and DAPI. MCF10A WT or IRAK1 KO cells were treated with CPT (10 μM) (G) or UV (10 mJ/cm2) (H) ± ATMi (10 μM) for 4 h. (Number of cells, n=5000). I. MCF10A cells knockdown for the indicated targets were treated with CPT (10 μM) for 4 h in the presence or absence ATMi (10 μM). Relative p65 nuclear levels, γH2AX intensity, and DNA contents of 5,000 MCF10A cells were monitored by QIBC. J. The relative levels of nuclear p65 were analyzed in MCF10A WT or IRAK1 KO cells treated with ActD (5 μM) ± ATMi (10 μM) for 4h. Red lines indicate the mean. (Number of cells, n=550).
Figure 5:
Figure 5:. IL-1α signaling-mediated IRAK1 activation stimulates p65 in response to transcriptional stresses.
A. Relative levels of nuclear p65 intensity were analyzed in MCF10A transfected with siRNA targeting IL-1R1 and subsequently treated with CDK9i (6 μM) for 4 h. Red lines indicate the mean. (Number of cells, n=550). B-C. QIBC of MCF10A cells stained for p65, γH2AX, and DAPI. Cells knockdown for IL-1R1 were treated with CPT (10 μM; 2 h) (B) or UV (10 mJ/cm2; 4 h) (C) in the presence or in the absence of ATMi (10 μM). (Number of cells, n=5000). D. MCF10A cells were pretreated with IL-1RA (150 ng/mL) for 1h before and then treated with CPT (10 μM) or CPT+ATMi for 4 h. Relative p65 nuclear levels, γH2AX intensity, and DNA contents of 5,000 MCF10A cells were monitored by QIBC. E. The relative nuclear levels of p65 were analyzed in MCF10A cells treated ActD (5 μM; 4 h) in the presence or absence of IL-1RA (150 ng/mL) and/or ATMi (10 μM). Red lines indicate the mean. (Number of cells, n=550). F. Quantification of p65 nuclear levels in MCF10A WT or IL-1α KO cells treated with CDK9i (6 μM) for 4 h. Red lines indicate the mean. (Number of cells, n=550). G. Quantification by QIBC of p65, γH2AX, and DAPI staining in MCF10A WT or IL-1α KO cells treated with CPT (10 μM) or CPT+ATMi for 2 h. (Number of cells, n=5000). H. Representative immunofluorescence pictures of MCF10A WT or IL-1α KO cells treated as indicated in (G). I. The relative levels of nuclear p65 were analyzed in MCF10A WT or IL-1α KO cells treated with UV (10 mJ/cm2) for 4 h in the presence or absence of ATMi (10 μM). Red lines indicate the mean. (Number of cells, n=550).
Figure 6:
Figure 6:. Transcriptional stress promotes p65 activation in surrounding cells.
A. IL1A and IL1R1 mRNA expression levels in a panel of 1440 cell lines and classified by cancer types. B. Percentage of cells positive for p65 nuclear localization in the indicated cell lines treated with either TNFα (50 ng/mL; 30 min), UV (10 mJ/cm2; 4 h), CPT (20 μM; 4 h), ETP (50 μM; 2 h), or recombinant human IL-1α (1.25 ng/mL; 30 min). C. Representative immunofluorescence pictures illustrating p65 nuclear localization in U2OS cells (GFP negative cells) or U2OS co-cultured with MCF10A WT-GFP following treatment with UV+ATMi in the presence or absence of IL-1RA (250 ng/mL) for 4h. Scale bar: 20 μm. D. Quantification of p65 relative nuclear intensity in U2OS cells showed in C. Red lines indicate the mean. (Number of cells, n=550). E. Representative immunofluorescence pictures for p65 and GFP staining of U2OS cells or U2OS complemented with IL-1α-GFP and treated as indicated for 4 h. Scale bar: 20 μm. F. Quantification of p65 nuclear localization in U2OS cells co-cultured with U2OS transfected with IL-1α-GFP following the indicated treatment for 4 h. Red lines indicate the mean. (Number of cells, n=550). G. Quantification of relative p65 nuclear levels in MCF10A WT cells treated with UV+ATMi (10 mJ/cm2) for 4 h in the presence or absence of the indicated HDAC inhibitors. When indicated, cells were treated with recombinant human IL-1α (1.25 ng/mL). Red lines indicate the mean. (Number of cells, n=550).
Figure 7:
Figure 7:. Transcriptional stress induces specific inflammatory gene expression.
A. Volcano plots of differentially expressed genes in MCF10A WT and IRAK1 KO#7 cells treated with UV (10 mJ/cm2) for 12 h in the presence or absence of ATMi (10 μM). Data are derived from n = 2 biological replicates. B. Quantification of CXCL2, CXCL3, CXCL8, CCL20 and TNF mRNA levels by RT-qPCR in MCF10A WT or IRAK1 KO cells treated with UV (10 mJ/cm2) for 12 h. Each target was normalized to the highest expressing condition. Mean values ± SD (n = 3). C. MCF10A WT cells were treated with UV (10 mJ/cm2) ± IL-1RA (250 ng/mL). The levels of secreted IL-8 and TNFα were then analyzed in conditioned media by ELISA. Red lines indicate the mean. D-E. CXCL2, CXCL3, CXCL8, CCL20 and TNF mRNA levels were monitored by RT-qPCR in MCF10A WT, p65 KO (D), or IL-1α KO (E) treated for 12 h with UV (10 mJ/cm2). Each target was normalized to the highest expressing condition. Mean values ± SD (n = 3). F-G. Quantification of CXCL2, CXCL3, CXCL8, CCL20 and TNF mRNA levels by RT-qPCR in MCF10A WT or IRAK1 KO treated for 12 h with recombinant human IL-1α (1.25 ng/mL) (F), or CPT (2.5 μM) (G). Each target was normalized to the highest expressing condition. Mean values ± SD (n = 3).
Figure 8:
Figure 8:
DNA damage induces two distinct pathways promoting NF-κB. The NF-κB pathway is activated through two separate mechanisms orchestrated by ATM or IRAK1 kinases in response to different types of DNA damage. ATM mediates an acute activation of p65 upon DNA lesions, resulting in DSB formation. In contrast, DNA lesions blocking transcription cause IL-1α release from the cells to stimulate the transmembrane receptor IL-1R1 of nearby cells, which in turn activates the MyD88–IRAK1 complex. Like ATM, IRAK1 induces TRAF6, resulting in NF-κB activation and expression of specific inflammatory genes.

References

    1. Chatterjee N, and Walker GC (2017). Mechanisms of DNA damage, repair, and mutagenesis. Environ Mol Mutagen 58, 235–263. 10.1002/EM.22087. - DOI - PMC - PubMed
    1. Huang R, and Zhou PK (2021). DNA damage repair: historical perspectives, mechanistic pathways and clinical translation for targeted cancer therapy. Signal Transduction and Targeted Therapy 2021 6:1 6, 1–35. 10.1038/s41392-021-00648-7. - DOI - PMC - PubMed
    1. Ciccia A, and Elledge SJ (2010). The DNA damage response: making it safe to play with knives. Mol Cell 40, 179–204. 10.1016/j.molcel.2010.09.019. - DOI - PMC - PubMed
    1. Wu J, and Chen ZJ (2014). Innate immune sensing and signaling of cytosolic nucleic acids. Annu Rev Immunol 32, 461–488. 10.1146/annurev-immunol-032713-120156. - DOI - PubMed
    1. Reisländer T, Groelly FJ, and Tarsounas M (2020). DNA Damage and Cancer Immunotherapy: A STING in the Tale. Mol Cell 80, 21–28. 10.1016/J.MOLCEL.2020.07.026. - DOI - PubMed

Substances

LinkOut - more resources