

Flow prediction in sound-based uroflowmetry
- PMID: 39753897
- PMCID: PMC11699153
- DOI: 10.1038/s41598-024-84978-w
Flow prediction in sound-based uroflowmetry
Erratum in
-
Author Correction: Flow prediction in sound-based uroflowmetry.Sci Rep. 2025 Feb 10;15(1):4988. doi: 10.1038/s41598-025-89173-z. Sci Rep. 2025. PMID: 39930040 Free PMC article. No abstract available.
Abstract
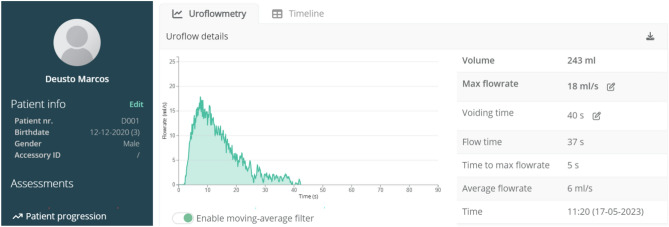
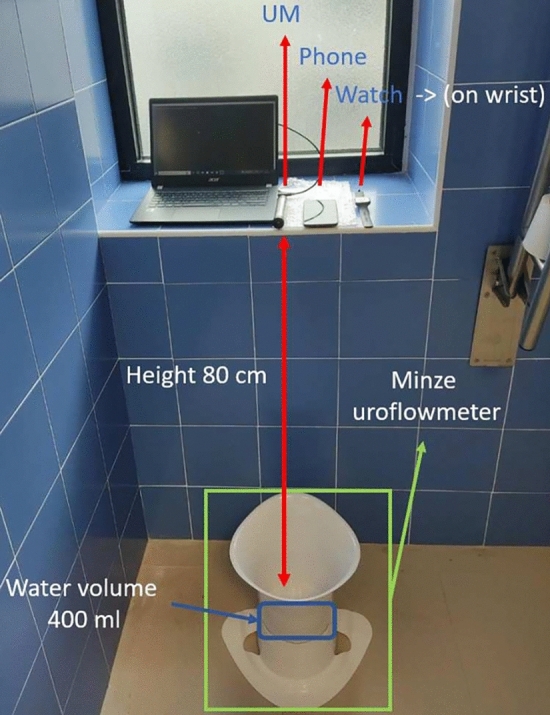
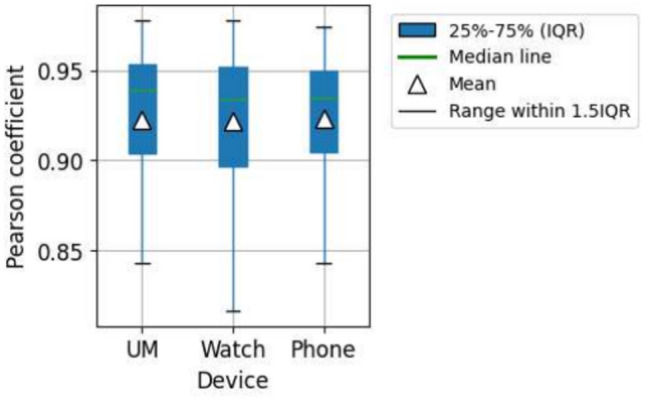
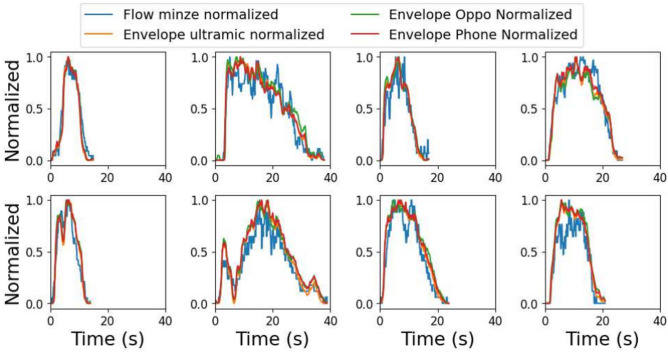
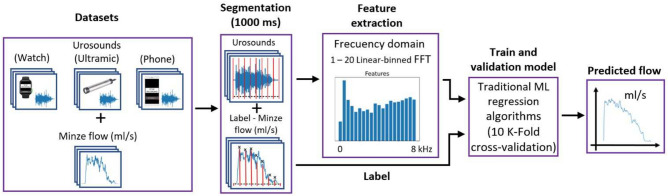
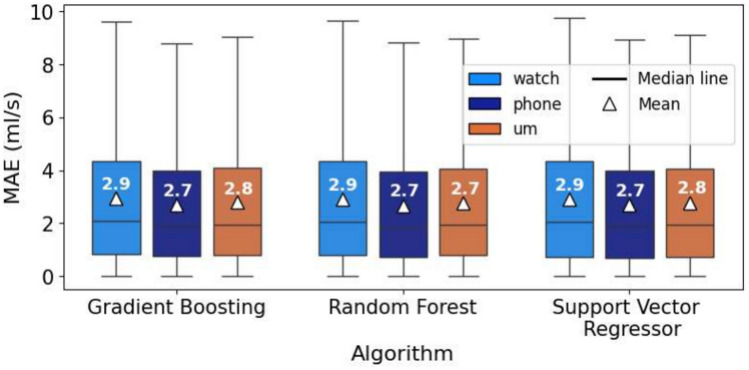
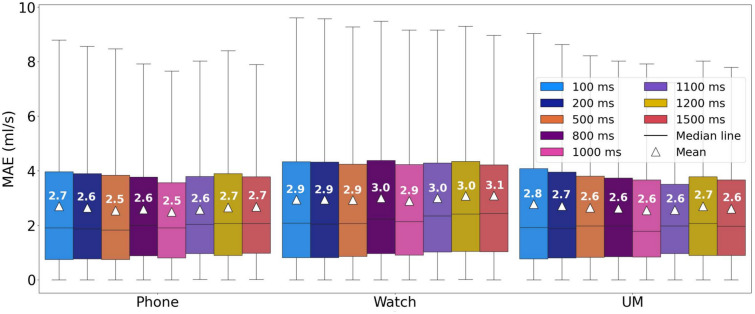
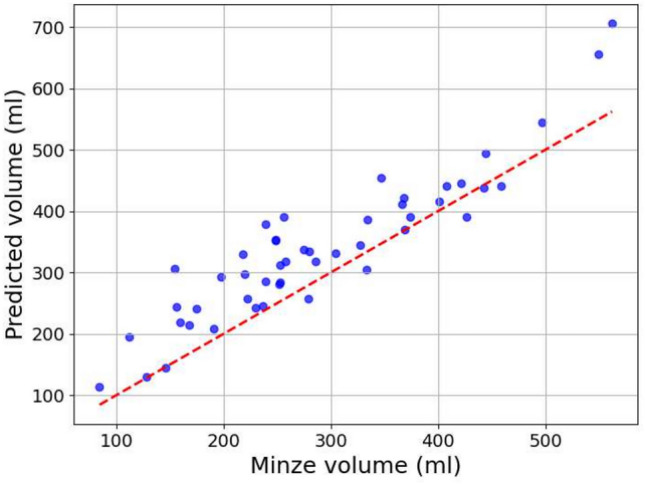
Sound-based uroflowmetry (SU) offers a non-invasive alternative to traditional uroflowmetry (UF) for evaluating lower urinary tract dysfunctions, enabling home-based testing and reducing the need for clinic visits. This study compares SU and UF in estimating urine flow rate and voided volume in 50 male volunteers (aged 18-60), with UF results from a Minze uroflowmeter as the reference standard. Audio signals recorded during voiding were segmented and machine learning algorithms (gradient boosting, random forest, and support vector machine) estimated flow parameters from three devices: Ultramic384k, Mi A1 smartphone, and Oppo smartwatch. The mean absolute error for flow rate estimation were 2.6, 2.5 and 2.9 ml/s, with R2 values of 84%, 83%, and 79%, respectively. Analysis of the Ultramic384k's frequency range showed that the 0-8 kHz band contained 83% of significant components, suggesting higher sampling frequencies are unnecessary. A 1000 ms segment size was optimal for balancing computational efficiency and accuracy. Lin's concordance coefficients for urine flow and voided volume using the smartwatch (0-8 kHz, 1000 ms) were 0.9 and 0.85, respectively, demonstrating that SU is a reliable, cost-effective alternative to UF for estimating key uroflowmetry parameters, with added patient convenience.
Keywords: Acoustic voiding signals; Flow prediction; Machine learning; Sound-based uroflowmetry.
© 2025. The Author(s).
Conflict of interest statement
Declarations. Competing interests: The authors declare no competing interests.
Figures


References
-
- Alothmany, N. et al. Critical review of uroflowmetry methods. J. Med. Biol. Eng.38, 685–696 (2018).
-
- Arjona, M. F. & Sanz, I. P. Hiperplasia benigna de próstata: Una afección de elevada prevalencia en el paciente de edad avanzada. Rev. Española Geriatr. Gerontol.43, 44–51 (2008). - PubMed
-
- Sorel, M. R., Reitsma, H. J., Rosier, P. F., Bosch, R. J. & de Kort, L. M. Uroflowmetry in healthy women: A systematic review. Neurourol. Urodyn.36, 953–959 (2017). - PubMed
-
- Rodrigues Pessoa, R. & Kim, F. Urodynamics and Voiding Dysfunction 7th edn, 452–454 (Abernathy’s Surgical Secrets, 2018).
-
- Kuoch, K. L., Meyer, D., Austin, D. W. & Knowles, S. R. Classification and differentiation of bladder and bowel related anxieties: A socio-cognitive exploration. Curr. Psychol.40, 4004–4011 (2021).
Publication types
MeSH terms
Grants and funding
LinkOut - more resources
Full Text Sources
